The US500 reached a key support area on the H1 chart and started building a bullish structure.
On the intraday (M5/M1), price broke above local resistance and then retested the breakout zone with a clean pullback. This retest was confirmed by a strong bullish candle, signaling continuation to the upside.
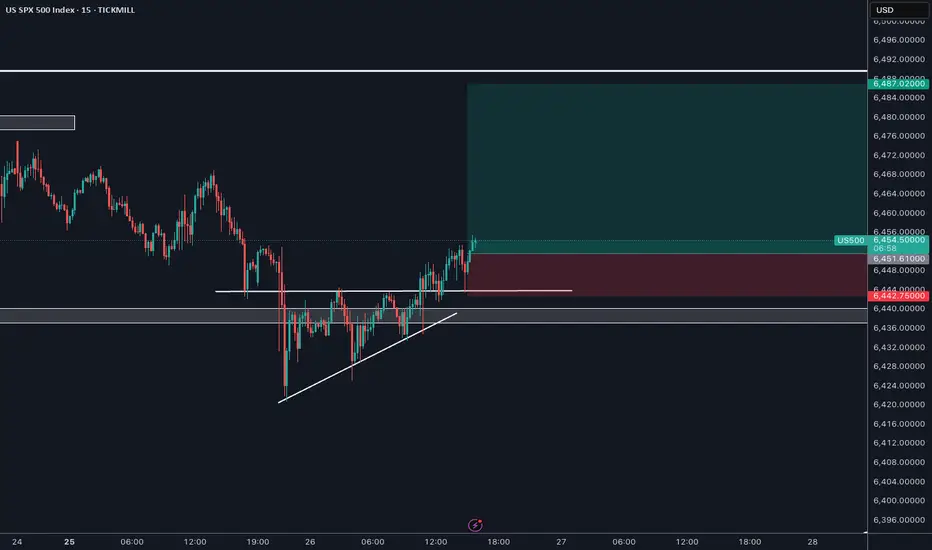
Trade plan:
Entry: after confirmation of the pullback at the breakout zone.
Stop-loss: below support (around 6437).
Target: all-time high zone at 6485–6490.
Risk management: once the first target is reached, stop can be moved to breakeven to protect capital.
This setup supports the expectation of bullish continuation, as long as support holds.
On the intraday (M5/M1), price broke above local resistance and then retested the breakout zone with a clean pullback. This retest was confirmed by a strong bullish candle, signaling continuation to the upside.
Trade plan:
Entry: after confirmation of the pullback at the breakout zone.
Stop-loss: below support (around 6437).
Target: all-time high zone at 6485–6490.
Risk management: once the first target is reached, stop can be moved to breakeven to protect capital.
This setup supports the expectation of bullish continuation, as long as support holds.
Disclaimer
The information and publications are not meant to be, and do not constitute, financial, investment, trading, or other types of advice or recommendations supplied or endorsed by TradingView. Read more in the Terms of Use.
Disclaimer
The information and publications are not meant to be, and do not constitute, financial, investment, trading, or other types of advice or recommendations supplied or endorsed by TradingView. Read more in the Terms of Use.