📊 US500 Intraday Technical Analysis - 10 Nov 2025
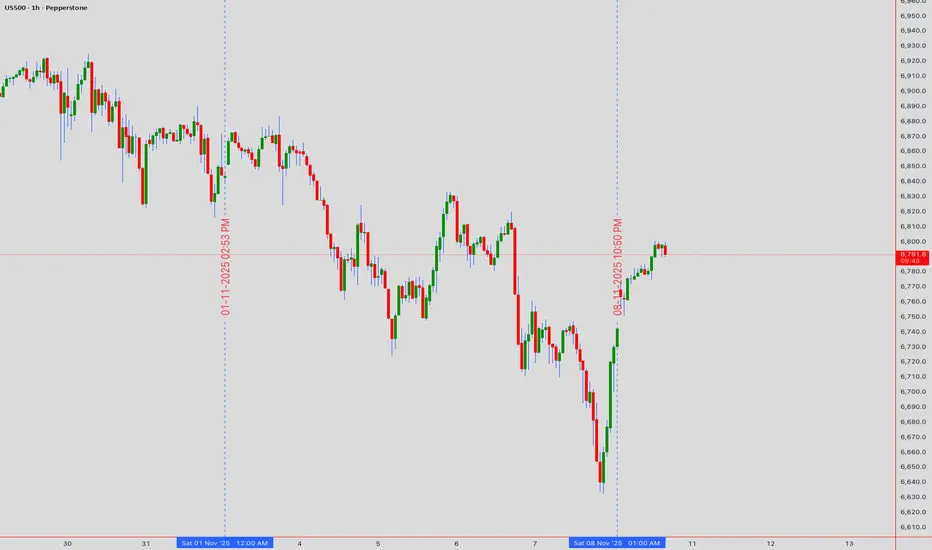
S&P 500 at 6,792 (4:45 PM UTC+4) — Major breakout setup with confluence
━━━━━━━━━━━━━━━━━━━━━━━━━━━━━━━━━━━━
🔍 MARKET STRUCTURE
🔸 Wyckoff Phase D re-accumulation; Dow Theory primary uptrend intact
🔸 Gann Square-of-9 targets: 6,950 (resistance) / 6,650 (support)
🔸 Elliott Wave (3) extension in progress toward 6,950-7,050
━━━━━━━━━━━━━━━━━━━━━━━━━━━━━━━━━━━━
📈 TIMEFRAME MATRIX
Daily (1D): Rising channel 6,700-6,900; RSI 62 (bullish); Ichimoku cloud support 6,550
4H: Broadening wedge 6,750-6,900; EMA21>EMA50>EMA200 (golden cross); VWAP 6,680
1H: Cup-and-handle pattern; BB expanding; VWAP slope bullish
30M: Symmetrical triangle 6,780-6,850; hidden bull divergence on RSI; volume contracting
15M: Bull flag above 6,790; Tenkan>Kijun bullish; stochastic reset ready
5M: Falling wedge retest 6,800; hammer shows demand; watch false breakout
━━━━━━━━━━━━━━━━━━━━━━━━━━━━━━━━━━━━
🎯 PRIMARY LONG (HIGH PROBABILITY)
⚡ MOMENTUM SCALP
Add above 6,950 ONLY if RSI >65 + volume surge; trail stop 6,920
🔻 REVERSAL SHORT
━━━━━━━━━━━━━━━━━━━━━━━━━━━━━━━━━━━━
🚨 BREAKOUT ALERTS
✅ BULL: 1H close >6,950 confirms breakout → target 7,150; move SL to BE+25
✅ BEAR: 1H close <6,780 with volume → retest 6,650 cloud support
━━━━━━━━━━━━━━━━━━━━━━━━━━━━━━━━━━━━
📊 INDICATOR SNAPSHOT
BB Squeeze (30M) expanding | MACD histogram positive | VWAP slope up | EMA21 = trigger line | Hidden bull divergence confirmed on RSI
⚠️ PATTERN RECOGNITION
Harmonic Bat PRZ: 7,050 | Rising Wedge failure <6,790 = Wyckoff spring | H&S risk if 6,700 breaks | Bull trap risk above 6,950 without volume
📈 TIMING & VOLATILITY
Gann 90° window 21:00 UTC (US close) | ATR(14) ≈100 pts | Earnings whispers elevate risk | Risk ≤1% per setup; lock TP1; avoid chasing sub-avg volume
━━━━━━━━━━━━━━━━━━━━━━━━━━━━━━━━━━━━
S&P 500 at 6,792 (4:45 PM UTC+4) — Major breakout setup with confluence
━━━━━━━━━━━━━━━━━━━━━━━━━━━━━━━━━━━━
🔍 MARKET STRUCTURE
🔸 Wyckoff Phase D re-accumulation; Dow Theory primary uptrend intact
🔸 Gann Square-of-9 targets: 6,950 (resistance) / 6,650 (support)
🔸 Elliott Wave (3) extension in progress toward 6,950-7,050
━━━━━━━━━━━━━━━━━━━━━━━━━━━━━━━━━━━━
📈 TIMEFRAME MATRIX
Daily (1D): Rising channel 6,700-6,900; RSI 62 (bullish); Ichimoku cloud support 6,550
4H: Broadening wedge 6,750-6,900; EMA21>EMA50>EMA200 (golden cross); VWAP 6,680
1H: Cup-and-handle pattern; BB expanding; VWAP slope bullish
30M: Symmetrical triangle 6,780-6,850; hidden bull divergence on RSI; volume contracting
15M: Bull flag above 6,790; Tenkan>Kijun bullish; stochastic reset ready
5M: Falling wedge retest 6,800; hammer shows demand; watch false breakout
━━━━━━━━━━━━━━━━━━━━━━━━━━━━━━━━━━━━
🎯 PRIMARY LONG (HIGH PROBABILITY)
- Entry: 6,790-6,820 (flag support + VWAP confluence)
- SL: 6,750 (below triangle base)
- TP1: 6,880 (+90 pips)
- TP2: 6,950 (+160 pips — channel resistance)
- TP3: 7,050 (+260 pips — harmonic extension)
- Confirmation: RSI >55, volume +20%, VWAP holding
⚡ MOMENTUM SCALP
Add above 6,950 ONLY if RSI >65 + volume surge; trail stop 6,920
🔻 REVERSAL SHORT
- Entry: 6,950-7,000 (supply resistance)
- SL: 7,050 (above wedge)
- Targets: 6,900 → 6,820 → 6,750 (Gann support)
- Trigger: Bearish engulfing + RSI divergence on 5M/15M
━━━━━━━━━━━━━━━━━━━━━━━━━━━━━━━━━━━━
🚨 BREAKOUT ALERTS
✅ BULL: 1H close >6,950 confirms breakout → target 7,150; move SL to BE+25
✅ BEAR: 1H close <6,780 with volume → retest 6,650 cloud support
━━━━━━━━━━━━━━━━━━━━━━━━━━━━━━━━━━━━
📊 INDICATOR SNAPSHOT
BB Squeeze (30M) expanding | MACD histogram positive | VWAP slope up | EMA21 = trigger line | Hidden bull divergence confirmed on RSI
⚠️ PATTERN RECOGNITION
Harmonic Bat PRZ: 7,050 | Rising Wedge failure <6,790 = Wyckoff spring | H&S risk if 6,700 breaks | Bull trap risk above 6,950 without volume
📈 TIMING & VOLATILITY
Gann 90° window 21:00 UTC (US close) | ATR(14) ≈100 pts | Earnings whispers elevate risk | Risk ≤1% per setup; lock TP1; avoid chasing sub-avg volume
Educational analysis only. Follow your plan, manage risk, adapt to live price action.
━━━━━━━━━━━━━━━━━━━━━━━━━━━━━━━━━━━━
I am nothing @shunya.trade
Disclaimer
The information and publications are not meant to be, and do not constitute, financial, investment, trading, or other types of advice or recommendations supplied or endorsed by TradingView. Read more in the Terms of Use.
I am nothing @shunya.trade
Disclaimer
The information and publications are not meant to be, and do not constitute, financial, investment, trading, or other types of advice or recommendations supplied or endorsed by TradingView. Read more in the Terms of Use.