📍 To see my confluences and/or linework: Step 1: Grab chart 📊, Step 2: Unhide Group 1 in object tree 🌳, Step 3: Hide and unhide specific confluences 🎯
The Market Participant Battle:
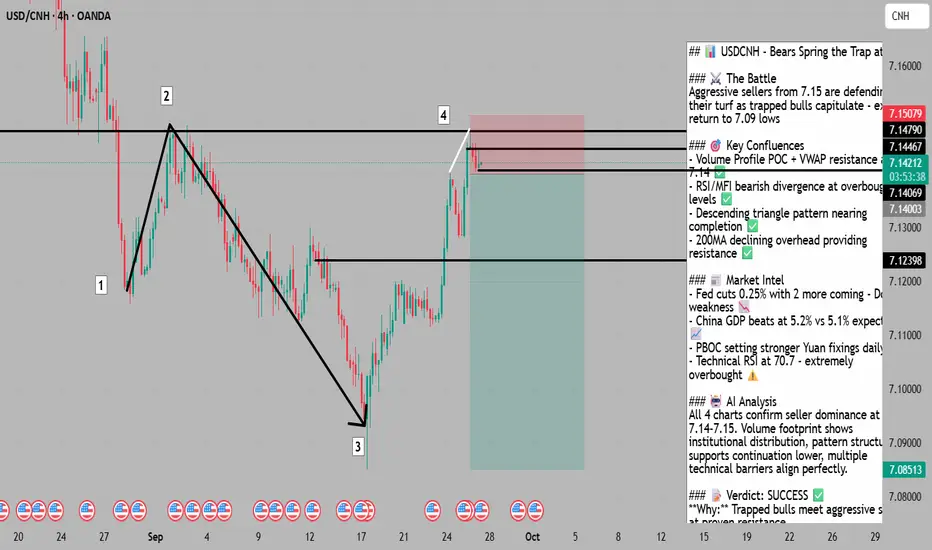
Sellers who dominated at point 2 (7.15) and drove price to point 3 (7.09) proved their control when price broke below point 1. Now at point 4, we're back at this proven seller zone where bears crushed bull hopes before. With fundamentals now massively favoring Yuan strength, these sellers have even more ammunition to defend their territory and push USDCNH lower!
Confluences:
Confluence 1: Volume Profile & VWAP Resistance 📊
Anchored VWAP from point 0 perfectly aligns with the pullback to point 2 and sits above point 4, creating dynamic resistance. Volume profile shows point 4 as a value area low with an empty volume cluster above point 2 that has rejected price twice. Sellers have the high ground!
Confluence 2: Bearish Divergence & Overbought Indicators 📉
Price made a higher high at point 4, but RSI, MFI, and CVD all printed lower highs - textbook bearish divergence! RSI at 70.7 and MFI scream overbought. The micro candle structure shows a lower low forming at point 4 where a candle closed below another - sellers are already attacking!
Confluence 3: Descending Triangle & Moving Average Resistance 🔻
4-hour chart shows a clean descending triangle with lower highs and horizontal support at 7.12398. Price is testing the upper boundary near 7.14467 while the 200-period MA declines from above, adding another layer of resistance.
Web Research Findings:
- Technical Analysis: RSI at 70.7 overbought, ADX 34.46 strong trend, support levels at 7.1782/7.1754/7.1730 📊
- Recent News/Earnings: China Q2 GDP 5.2% beat 5.1% expected, industrial output +6.8% beat 5.6% expected 💪
- Analyst Sentiment: Goldman Sachs/Citigroup bullish China, capital flowing to Chinese assets 🎯
- Data Releases: PBOC setting stronger Yuan fixings daily, China stimulus boosting consumption 📈
- Interest Rate Impact: Fed cut 0.25% Sept 17th with 2 more cuts projected 2025 - Dollar toast! 💵
Layman's Summary:
Perfect alignment! Technical sellers at 7.14 resistance now have fundamental rocket fuel. Fed is cutting rates (weakening dollar), China's economy is outperforming (strengthening Yuan), and PBOC is actively supporting their currency. It's like sellers at 7.14 just got reinforced by an entire army. When technicals and fundamentals align this strongly, powerful moves follow!
Machine Derived Information:
- Image 1: Volume footprint showing heavy selling at 7.14790 - Significance: Institutional distribution confirmed - AGREES ✔
- Image 2: 4H descending triangle with numbered points - Significance: Bearish pattern structure intact - AGREES ✔
- Image 3: 4H with MAs showing resistance confluence - Significance: Multiple technical ceilings align - AGREES ✔
- Image 4: Volume profile POC acting as resistance - Significance: High volume node rejection zone - AGREES ✔
Actionable Machine Summary:
Complete technical alignment! All four charts confirm seller dominance at 7.14-7.15. Volume footprint reveals aggressive distribution, descending triangle approaching completion, moving averages providing dynamic resistance, and volume profile POC acting as ceiling. With fundamentals also supporting the short, this is a rare perfect setup!
Conclusion:
Trade Prediction: SUCCESS ✅
Confidence: Very High
Technical resistance at proven seller zone + overwhelming fundamental Yuan support = explosive short opportunity. Fed easing cycle beginning, China outperforming, PBOC supporting Yuan - everything aligns for USDCNH decline. Entry at 7.14-7.15 with stops above 7.16, targeting 7.09 initially then 7.07-7.08. This is what high-conviction setups look like!
The Market Participant Battle:
Sellers who dominated at point 2 (7.15) and drove price to point 3 (7.09) proved their control when price broke below point 1. Now at point 4, we're back at this proven seller zone where bears crushed bull hopes before. With fundamentals now massively favoring Yuan strength, these sellers have even more ammunition to defend their territory and push USDCNH lower!
Confluences:
Confluence 1: Volume Profile & VWAP Resistance 📊
Anchored VWAP from point 0 perfectly aligns with the pullback to point 2 and sits above point 4, creating dynamic resistance. Volume profile shows point 4 as a value area low with an empty volume cluster above point 2 that has rejected price twice. Sellers have the high ground!
Confluence 2: Bearish Divergence & Overbought Indicators 📉
Price made a higher high at point 4, but RSI, MFI, and CVD all printed lower highs - textbook bearish divergence! RSI at 70.7 and MFI scream overbought. The micro candle structure shows a lower low forming at point 4 where a candle closed below another - sellers are already attacking!
Confluence 3: Descending Triangle & Moving Average Resistance 🔻
4-hour chart shows a clean descending triangle with lower highs and horizontal support at 7.12398. Price is testing the upper boundary near 7.14467 while the 200-period MA declines from above, adding another layer of resistance.
Web Research Findings:
- Technical Analysis: RSI at 70.7 overbought, ADX 34.46 strong trend, support levels at 7.1782/7.1754/7.1730 📊
- Recent News/Earnings: China Q2 GDP 5.2% beat 5.1% expected, industrial output +6.8% beat 5.6% expected 💪
- Analyst Sentiment: Goldman Sachs/Citigroup bullish China, capital flowing to Chinese assets 🎯
- Data Releases: PBOC setting stronger Yuan fixings daily, China stimulus boosting consumption 📈
- Interest Rate Impact: Fed cut 0.25% Sept 17th with 2 more cuts projected 2025 - Dollar toast! 💵
Layman's Summary:
Perfect alignment! Technical sellers at 7.14 resistance now have fundamental rocket fuel. Fed is cutting rates (weakening dollar), China's economy is outperforming (strengthening Yuan), and PBOC is actively supporting their currency. It's like sellers at 7.14 just got reinforced by an entire army. When technicals and fundamentals align this strongly, powerful moves follow!
Machine Derived Information:
- Image 1: Volume footprint showing heavy selling at 7.14790 - Significance: Institutional distribution confirmed - AGREES ✔
- Image 2: 4H descending triangle with numbered points - Significance: Bearish pattern structure intact - AGREES ✔
- Image 3: 4H with MAs showing resistance confluence - Significance: Multiple technical ceilings align - AGREES ✔
- Image 4: Volume profile POC acting as resistance - Significance: High volume node rejection zone - AGREES ✔
Actionable Machine Summary:
Complete technical alignment! All four charts confirm seller dominance at 7.14-7.15. Volume footprint reveals aggressive distribution, descending triangle approaching completion, moving averages providing dynamic resistance, and volume profile POC acting as ceiling. With fundamentals also supporting the short, this is a rare perfect setup!
Conclusion:
Trade Prediction: SUCCESS ✅
Confidence: Very High
Technical resistance at proven seller zone + overwhelming fundamental Yuan support = explosive short opportunity. Fed easing cycle beginning, China outperforming, PBOC supporting Yuan - everything aligns for USDCNH decline. Entry at 7.14-7.15 with stops above 7.16, targeting 7.09 initially then 7.07-7.08. This is what high-conviction setups look like!
Join free public community -> t.me/+ad-OZdmZq7M3MTg1
Disclaimer
The information and publications are not meant to be, and do not constitute, financial, investment, trading, or other types of advice or recommendations supplied or endorsed by TradingView. Read more in the Terms of Use.
Join free public community -> t.me/+ad-OZdmZq7M3MTg1
Disclaimer
The information and publications are not meant to be, and do not constitute, financial, investment, trading, or other types of advice or recommendations supplied or endorsed by TradingView. Read more in the Terms of Use.