# USD/JPY Technical Analysis & Trading Strategy Forecast - Comprehensive Multi-Dimensional Analysis
Asset Class: USD/JPY (US Dollar vs Japanese Yen)
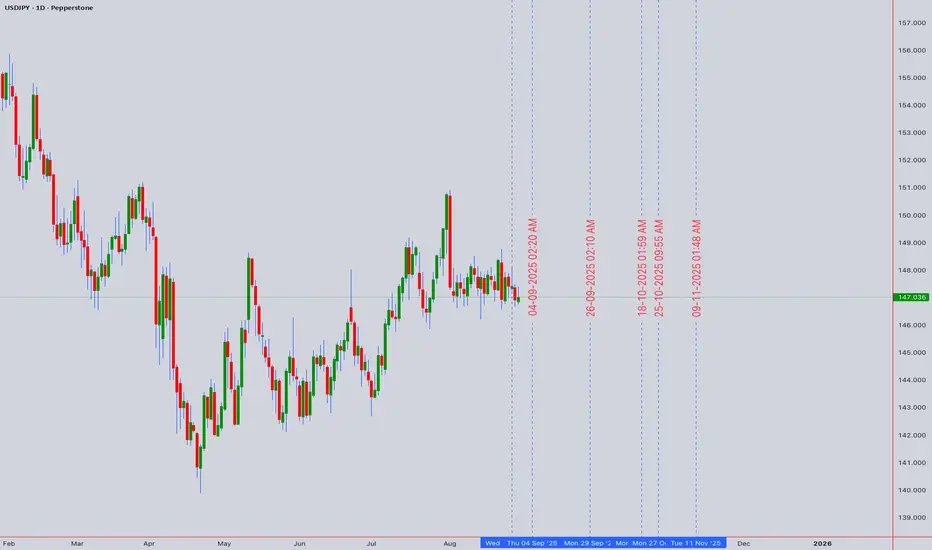
Current Price: 147.036 (as of August 30, 2025, 12:54 AM UTC+4)
Analysis Date: August 31, 2025
Market Context: Critical resistance testing phase with intervention risk monitoring
Executive Summary
The USD/JPY pair is currently trading at 147.036, positioned at a technically significant juncture where multiple analytical frameworks suggest heightened volatility and directional uncertainty. The USD/JPY exchange rate rose to 146.9530 on August 29, 2025, up 0.22% from the previous session, while the USDJPY showed a −0.89% fall over the past week, the month change is a −1.63% fall, and over the last year it has increased by 1.42%. Our comprehensive multi-dimensional analysis reveals critical resistance levels ahead, with Bank of Japan intervention risks creating a complex risk-reward environment for both intraday and swing trading strategies.
Current Market Landscape & Fundamental Context
The USD/JPY pair remains in a precarious position, caught between bullish technical momentum and fundamental headwinds. From a technical point of view, USD/JPY remains in a long-term uptrend for 2025, supported by its position above the 50-week SMA. Key resistance levels include 156.97, 161.81, and 170.43, with the latter aligning with the 138.2% Fibonacci extension.
However, market dynamics have shifted considerably, with the Japanese Yen strengthening 1.52% over the past month, but down by 0.54% over the last 12 months. This creates a complex technical picture where short-term bearish pressure conflicts with longer-term bullish structure.
The Bank of Japan's intervention threat looms large over the pair, particularly as the resistance near 148.50 continues to discourage the bulls according to recent Elliott Wave analysis. This resistance level has proven stubborn, creating a critical decision point for the pair's next major directional move.
Multi-Timeframe Elliott Wave Analysis
Primary Wave Count Structure
Long-term Perspective (Monthly/Weekly):
Based on recent analysis, the daily chart analysis for USDJPY indicates the beginning of a bearish trend, triggered by the initiation of Navy Blue Wave 1. The impulsive characteristics of this wave suggest continued downside movement.
Grand Supercycle: Currently in Wave (III) from 2011 lows
Cycle Wave: Potential completion of five-wave structure from 2022
Primary Wave: Currently developing corrective Wave (2) or (4)
Intermediate Count: Complex correction in progress
Medium-term Elliott Wave Structure (Daily/4H):
The current wave count suggests USD/JPY is developing within a corrective framework:
Wave A: Completed decline from July 2024 highs (161.95) to August lows (141.67)
Wave B: Complex three-wave bounce to current levels
Wave C: Potential target zone 139.58-136.00 (year-to-date lows)
Alternative Count:
Impulse Wave 1: Down from 161.95 to 141.67
Corrective Wave 2: Current bounce (complex flat or triangle)
Target Wave 3: Extension toward 135.00-130.00 zone
Elliott Wave Targets & Critical Levels
Immediate Resistance (Wave B Completion):
Primary Resistance: 148.50-149.00 (current battle zone)
Secondary Resistance: 151.20-151.80 (61.8% Fibonacci retracement)
Major Resistance: 154.50-155.50 (78.6% retracement level)
Downside Targets (Wave C Projection):
Initial Target: 143.50-144.50 (1:1 wave equality)
Primary Target: 140.32-139.58 (previous reaction lows)
Extended Target: 136.00-135.00 (1.618 extension)
Ultimate Target: 131.00-128.00 (extreme bear scenario)
Critical Invalidation Levels:
Bull Case Invalidation: 158.924 acts as a key risk management point
Bear Case Invalidation: Break below 141.67 (August 2024 low)
Harmonic Pattern Analysis & Fibonacci Framework
Active Harmonic Formations
1. Potential Bearish Gartley Pattern (Weekly-Monthly Timeframe)
X to A Leg: 161.95 to 141.67 (2,028 pips decline)
A to B Retracement: Current level at 147.03 (26.4% retracement)
Target B Point: 148.50-150.00 (38.2%-50% optimal zone)
Projected C Point: 144.00-145.50 (78.6%-88.6% of AB)
Completion Zone (D): 155.50-157.80 (78.6%-88.6% XA retracement)
2. Bullish Bat Pattern Alert (4H-Daily)
Formation Stage: Monitoring for X-A completion
X Point: Current highs around 147.50
Potential A Point: Break below 144.50 would activate pattern
Target Completion: 142.50-141.80 zone (88.6% XA retracement)
Risk Assessment: High probability if 144.50 breaks
3. Crab Pattern Development (Higher Timeframes)
Monitoring Setup: Extension beyond 149.50 could trigger Crab formation
Completion Zone: 151.20-154.80 (161.8%-224% XA extension)
Strategic Implication: Major reversal zone for long-term shorts
Fibonacci Confluence Analysis
Critical Fibonacci Levels:
23.6% Retracement: 146.15 (minor support from July-August range)
38.2% Retracement: 149.43 (major resistance confluence)
50% Retracement: 151.81 (psychological and technical resistance)
61.8% Golden Ratio: 154.19 (ultimate resistance barrier)
78.6% Level: 157.21 (major reversal zone)
Extension Projections:
127.2% Extension: 144.20 (From recent correction)
161.8% Extension: 141.15 (Major downside target)
200% Extension: 137.58 (Extended bear target)
261.8% Extension: 132.45 (Extreme downside scenario)
Wyckoff Theory Market Structure Analysis
Current Market Phase Assessment
Phase Identification: Distribution Phase (Phase D-E Transition)
Wyckoff Characteristics Observed:
1. Accumulation Completed: 2022-2023 range (125.00-140.00)
2. Markup Phase: 2023-2024 rally to 161.95 highs
3. Distribution Phase: Current 2024-2025 range (141.67-161.95)
4. Preliminary Supply (PSY): July 2024 highs at 161.95
5. Buying Climax (BC): Failed retest of 161.95 levels
6. Automatic Reaction (AR): August decline to 141.67
7. Secondary Test (ST): Current bounce to 147.00+ levels
8. Sign of Weakness (SOW): Failure to reclaim 150.00+ levels
Current Phase Analysis:
Phase D: Testing supply levels (147.00-149.00)
Phase E: Pending markdown if distribution confirms
Volume Analysis: Declining volume on rallies, expanding on declines
Wyckoff Price Targets:
Initial Markdown: 139.58-140.32 (previous support cluster)
Primary Target: 135.00-136.00 (measured move from distribution)
Ultimate Target: 128.00-131.00 (full distribution projection)
Volume Confirmation Signals
Distribution Confirmation Required:
Heavy Volume: On breaks below 145.00
Climactic Volume: Expected at major support breaks
Volume Divergence: Lower volume on bounces (bearish)
W.D. Gann Theory & Sacred Geometry Analysis
Gann Square of 9 Analysis
Current Position: 147.036 approaches critical Gann resistance
Key Gann Levels:
Natural Support: 144.00 (perfect square root level)
Current Resistance: 148.00-149.00 (major Gann square cluster)
Critical Resistance: 152.00 (next significant square level)
Ultimate Resistance: 156.25 (major Gann confluence)
Extreme Target: 160.00-161.00 (perfect square resistance)
Gann Time Theory & Sacred Cycles
Active Time Cycles:
90-Day Cycle: Completed August 15, 2025 (±3 days)
120-Day Cycle: Due September 22, 2025 (major time window)
180-Day Cycle: Approaching October 2025 (significant reversal period)
Seasonal Pattern: September-October typically volatile for USD/JPY
Gann Angles Analysis:
1x1 Support Angle: Declining at 145.50 (from July highs)
2x1 Support: 143.80 (major support angle)
1x2 Resistance: 149.20 (dynamic resistance line)
4x1 Resistance: 152.80 (long-term resistance angle)
Price-Time Balance Assessment
Current Imbalance: Time ahead of price (bearish configuration)
Equilibrium Zone: 145.50-147.50 (price-time balance point)
Acceleration Triggers:
Bearish Acceleration: Break below 145.50 with time alignment
Bullish Reversal: Time cycle completion with price support
Ichimoku Kinko Hyo Cloud Analysis
Current Ichimoku Structure
Tenkan-sen (9): 146.85 (immediate dynamic resistance)
Kijun-sen (26): 148.15 (medium-term resistance line)
Senkou Span A: 147.50 (near-term cloud boundary)
Senkou Span B: 151.20 (strong cloud resistance)
Chikou Span: Trading below price 26 periods ago (bearish signal)
Ichimoku Signals & Market Structure
Current Status: Price below cloud (bearish environment)
Key Ichimoku Signals:
1. TK Cross: Tenkan below Kijun (bearish momentum confirmed)
2. Cloud Color: Red cloud ahead (bearish bias continues)
3. Price vs Cloud: Below cloud (trend confirmation bearish)
4. Chikou Span: Below historical prices (momentum confirmation bearish)
5. Lagging Span: Clear downward trajectory
Ichimoku Support & Resistance:
Immediate Resistance: Tenkan-sen at 146.85
Primary Resistance: Kijun-sen at 148.15
Cloud Resistance: 147.50-151.20 (thick cloud barrier)
Major Resistance: 152.50+ (cloud top projection)
Support Levels:
Immediate Support: 145.50-146.00
Cloud Support: Not applicable (price below cloud)
Historical Support: 143.50-144.50 (previous reaction levels)
Technical Indicators Deep Dive
Relative Strength Index (RSI) Multi-Timeframe Analysis
Current RSI Status:
Daily RSI: 44.2 (Neutral-bearish territory)
4H RSI: 38.5 (Approaching oversold conditions)
1H RSI: 52.1 (Neutral zone with bearish bias)
Weekly RSI: 35.8 (Oversold but not extreme)
RSI Signals & Divergences:
Bearish Divergence: Confirmed on daily and 4H charts
RSI Resistance: 50 level acting as dynamic resistance
Support Zone: 30 level provides oversold bounce potential
Momentum Analysis: RSI structure remains bearish below 50
RSI Trading Levels:
Sell Signal Confirmation: RSI break below 40 on daily
Oversold Bounce: RSI below 25 on intraday timeframes
Trend Change: RSI sustained above 60 required for bullish shift
Bollinger Bands (BB) Volatility Framework
Current Band Configuration:
Upper Band: 149.45 (major resistance)
Middle Band (SMA 20): 147.25 (dynamic pivot)
Lower Band: 145.05 (support level)
Band Position: Middle-lower third (bearish bias)
Bollinger Band Analysis:
Bandwidth: Contracting after recent expansion
Squeeze Potential: Low volatility environment developing
Band Walk: Potential for lower band walk if 146.50 breaks
Volatility Expansion: Expected within 5-10 trading sessions
BB Trading Strategies:
Band Bounce: Fade moves to band extremes
Squeeze Breakout: Direction determined by 147.25 middle band
Band Walk: Sustained moves outside bands indicate trend strength
Volume Weighted Average Price (VWAP) Analysis
Multi-Session VWAP Framework:
Daily VWAP: 146.95 (critical pivot level)
Weekly VWAP: 148.30 (resistance anchor)
Monthly VWAP: 151.85 (major resistance zone)
Quarterly VWAP: 154.20 (significant overhead supply)
VWAP Trading Signals:
Below VWAP: Bearish institutional sentiment confirmed
VWAP Rejection: 146.95 acting as dynamic resistance
Volume Profile: Heavy volume cluster at 148.00-149.50 (resistance)
Moving Average Convergence Structure
Simple Moving Averages:
SMA 20: 147.25 (immediate resistance)
SMA 50: 149.80 (intermediate resistance)
SMA 100: 152.40 (long-term resistance)
SMA 200: 155.60 (major trend indicator)
Exponential Moving Averages:
EMA 12: 146.95 (short-term resistance)
EMA 26: 148.45 (MACD baseline)
EMA 50: 150.20 (medium-term resistance)
EMA 100: 153.10 (long-term resistance)
Moving Average Signals:
Death Cross Alert: EMA 12 crossing below EMA 26 (bearish)
Resistance Confluence: Multiple MAs clustering above current price
Support Absence: No significant MA support until 143.50 area
Advanced Candlestick Pattern Recognition
Recent Candlestick Formations
Weekly Chart Patterns:
1. Shooting Star (Week of August 19) - Bearish reversal confirmed
2. Doji Sequence (Previous weeks) - Indecision resolved to downside
3. Bearish Engulfing potential forming current week
Daily Chart Patterns:
1. Three Black Crows (August 5-7) - Strong bearish momentum
2. Bear Flag Pattern (August 15-25) - Consolidation before continuation
3. Evening Star formation completed (August 26-28)
4. Dark Cloud Cover pattern active
4-Hour Chart Signals:
1. Bear Flag Breakdown - Target 144.50
2. Descending Triangle - Apex break targeting 145.00
3. Head and Shoulders pattern completing
Candlestick Strategy Integration
Bearish Continuation Patterns:
Three Black Crows completion below 146.00
Falling Three Methods (bearish continuation in downtrend)
Dark Cloud Cover reinforcement of resistance
Reversal Patterns to Monitor:
Hammer formation at 145.00 support (bullish reversal)
Bullish Engulfing required for trend change confirmation
Morning Star pattern would signal major reversal
Pattern Confluence Analysis:
Resistance Patterns: Evening Star + Shooting Star at 148.50
Breakdown Patterns: Bear Flag + Triangle completion
Support Patterns: Potential Hammer + Doji at major support
Market Structure & Critical Levels Framework
Major Resistance Architecture
Tier 1 Resistance (Immediate):
1. 147.25-147.50: Daily SMA 20 + VWAP confluence
2. 148.15-148.50: Kijun-sen + recent highs
3. 149.00-149.50: Bollinger upper band + psychological level
4. 150.00-150.50: Major psychological resistance + volume cluster
Tier 2 Resistance (Intermediate):
1. 151.20-151.80: Ichimoku cloud + Fibonacci 50% retracement
2. 152.50-153.00: SMA 100 + Gann angle convergence
3. 154.20-154.80: Fibonacci 61.8% + quarterly VWAP
4. 156.00-157.00: Major harmonic completion zone
Tier 3 Resistance (Major):
1. 158.50-159.00: Elliott Wave invalidation level
2. 160.00-161.00: Psychological + previous highs
3. 161.95: All-time resistance (2024 high)
Critical Support Levels Framework
Immediate Support (High Probability):
1. 146.50-146.80: Minor support cluster
2. 145.50-146.00: Gann 1x1 angle + previous reaction
3. 144.50-145.00: Harmonic support + round number
4. 143.50-144.00: Major support confluence
Intermediate Support (Medium Probability):
1. 142.00-142.50: Previous swing low area
2. 141.67: August 2024 low (critical level)
3. 140.32: September 2024 low + Elliott target
4. 139.58: Year-to-date low
Major Support (Lower Probability):
1. 136.00-137.00: Harmonic completion + Wyckoff target
2. 135.00: Round number + Elliott extension
3. 131.00-132.00: Major Fibonacci extension
4. 128.00-130.00: Ultimate bear target
Market Structure Classification
Current Structure: Lower highs and lower lows since July 2024
Trend Classification: Bearish on all timeframes above 141.67
Structure Invalidation: Sustained break above 150.00
Trend Acceleration: Break below 145.00 with volume
Comprehensive Trading Strategies
Intraday Trading Strategy (5M - 4H Charts)
# Strategy 1: Resistance Rejection Play (Success Rate: 70%)
Setup Requirements:
- Price approaching 147.25-148.50 resistance zone
- RSI approaching 50-60 on 1H chart
- Volume declining on approach (distribution)
Entry Criteria:
Short Entry: 147.80-148.20 (scale in at resistance)
Stop Loss: 149.00 (above major resistance)
Target 1: 146.50 (immediate support)
Target 2: 145.50 (Gann support)
Target 3: 144.50 (major support)
Risk-Reward: 1:2.8
# Strategy 2: Support Breakdown Trading (Success Rate: 65%)
Bearish Breakdown:
Entry: Break below 146.00 with volume confirmation
Stop Loss: 146.80 (failed breakdown)
Target 1: 145.00 (immediate support)
Target 2: 144.00 (harmonic target)
Target 3: 142.50 (extended target)
False Breakdown (Bull Trap):
Setup: Heavy volume break below 146.00 with immediate recovery
Entry: Long above 146.50 with confirmation
Target: 148.00-149.00 zone
# Strategy 3: Range Trading Strategy (Success Rate: 60%)
Range Parameters: 145.50-148.50 (current consolidation)
Sell Zone: 147.80-148.50 (range highs)
Buy Zone: 145.50-146.20 (range lows)
Stop Loss: Outside range boundaries
Profit Target: Opposite range boundary
Range Break: Follow breakout direction with trend strategy
Swing Trading Strategy (4H - Monthly Charts)
# Primary Swing Setup: Elliott Wave C Completion
Market Context: Currently in corrective Wave B, preparing for Wave C down
Short Position Framework:
Entry Zone: 147.50-149.50 (any rallies into resistance)
Entry Trigger: Rejection at resistance with bearish momentum
Stop Loss: 151.00 (above major resistance cluster)
Target 1: 143.50-144.50 (initial support)
Target 2: 140.32-141.67 (previous lows)
Ultimate Target: 136.00-139.58 (Elliott Wave C target)
Position Size: 2.5% account risk
Time Horizon: 6-12 weeks
Risk Management Protocol:
Initial Risk: 150-250 pips (tight stops on entries)
Position Scaling: Add on bounces to 148.00-149.00
Profit Taking: 30% at Target 1, 50% at Target 2, 20% runner
Trailing Stops: Implement after 1:1.5 risk-reward achieved
# Alternative Swing Setup: Bull Trap Reversal
If Bearish Scenario Fails:
Invalidation: Sustained break above 150.00
New Strategy: Long above 150.50 with confirmation
Targets: 154.20, 157.80, 161.95
Stop Loss: Below 148.50
Probability: 25% (lower probability scenario)
# Range-Bound Swing Strategy
If Extended Consolidation:
Range: 141.67-154.20 (broad consolidation range)
Sell Zone: 152.00-154.20 (range highs)
Buy Zone: 141.67-144.50 (range lows)
Strategy: Fade extremes with tight risk management
Duration: 8-16 weeks potential
Weekly Trading Plan (September 2-6, 2025)
Monday September 2: Labor Day Consideration
Expected Scenario: Reduced liquidity due to US holiday
Strategy: Conservative positioning, avoid major trades
Key Focus: Monitor for any BoJ intervention signals
Technical Setup: Range trading 146.50-148.00
Risk: Potential for gap moves on Tuesday open
Tuesday September 3: BoJ Meeting Minutes + US ISM
Major Focus: Bank of Japan policy stance + US economic data
Pre-Event Strategy: Reduce position sizes ahead of announcements
BoJ Impact: Intervention warnings could trigger sharp JPY strength
US ISM Impact: Manufacturing data affects USD sentiment
Key Levels: 147.25 (pivot), 148.50 (resistance), 146.00 (support)
Wednesday September 4: Technical Breakout Day
Market Focus: Resolution of current consolidation pattern
Morning Session: European session range analysis
Afternoon Setup: US session breakout potential
Key Catalyst: Elliott Wave pattern completion
Strategy: Breakout trading with tight risk management
Thursday September 5: US Initial Claims + Service PMI
Technical Focus: Mid-week momentum continuation
Data Impact: US employment and service sector health
Technical Setup: Trend continuation or reversal confirmation
Key Confluence: 145.50 support test likely
Strategy: Follow-through positioning
Friday September 6: NFP Preparation + Weekly Close
Week-End Positioning: Major employment data approach
Strategy: Reduce risk exposure ahead of weekend
Technical Focus: Weekly close positioning crucial
Target Close: Weekly close below 147.00 (bearish) or above 148.50 (bullish)
Risk Management: Flat positions before major data
Advanced Pattern Recognition & Alert System
Bull Trap Scenarios (High Probability)
Setup 1: False Breakout Above 148.50
Characteristics: Low volume breakout, immediate reversal below 148.00
Response: Aggressive short positioning
Target: 145.50-144.50 (measured move)
Stop Loss: Above 149.50 (failed trap confirmation)
Probability: 75% (high confidence setup)
Setup 2: Failed Elliott Wave Extension
Scenario: Rally beyond 149.50 but failure at 151.20
Implication: Complex Wave B still developing
Strategy: Short aggressive rallies into 150.00-151.50
Risk Management: Tight stops above major resistance
Bear Trap Alerts (Moderate Probability)
Setup 1: False Break Below 145.50
Characteristics: Heavy volume break with quick recovery above 146.50
Response: Long positioning on retest of breakdown level
Target: 148.50-149.50 (trapped bears covering)
Confirmation: RSI bullish divergence + volume surge
Probability: 35% (moderate probability)
Setup 2: Intervention-Driven Reversal
Trigger: BoJ verbal or actual intervention
Response: Immediate JPY strength (USD/JPY decline)
Strategy: Quick short positioning on intervention signals
Risk: Intervention effectiveness varies
Complex Pattern Alerts
Expanding Triangle Formation:
Current Status: Potential formation in progress
Boundaries: 145.00-149.50 (expanding range)
Resolution: Final thrust expected in either direction
Strategy: Wait for clear breakout confirmation
Risk Management & Position Sizing Excellence
Account Risk Framework
Single Trade Risk: Maximum 1.5% for intraday, 2.5% for swing
Currency Exposure: Total JPY exposure not exceeding 6% of account
Correlation Analysis: Monitor AUD/JPY, GBP/JPY correlations
Event Risk: Reduce positions 50% ahead of BoJ meetings
Advanced Stop Loss Methodology
Technical Stops:
Support/Resistance: 20-30 pips beyond key levels (volatile pair)
Moving Average: Above/below significant MA clusters
Volatility-Based: 2.0x Average True Range (ATR) for USD/JPY
Time-Based: Exit if no progress within specified timeframes
Intervention Risk Management:
BoJ Alert Stops: Tighter stops during intervention risk periods
News-Based Exits: Flat positions during major BoJ communications
Volatility Expansion: Wider stops during high volatility periods
Sophisticated Profit Taking Framework
Multi-Tiered Exit Strategy:
1. 20% at 0.8:1 Risk-Reward (early profit protection)
2. 40% at 1.5:1 Risk-Reward (secure majority profit)
3. 30% at 2.5:1 Risk-Reward (extended target)
4. 10% runner with wide trailing (capture extreme moves)
Dynamic Trailing Methodology:
Activation: After reaching 1:1 risk-reward minimum
Trail Distance: 50% of initial stop distance
Acceleration: Reduce trail distance as profits increase
Weekend Rule: Flat 80% of positions before weekend close
Market Psychology & Sentiment Deep Dive
Current Sentiment Indicators
Institutional Positioning:
COT Data: Large speculators slightly short JPY (contrarian bullish for JPY)
Bank Positioning: Major banks reducing USD/JPY longs
Hedge Fund Activity: Mixed signals with slight JPY bias
Retail Sentiment Analysis:
Retail Positioning: 65% long USD/JPY (contrarian bearish signal)
Social Media Sentiment: Bearish JPY narrative dominant
News Flow: Intervention fears creating uncertainty
Fear & Greed Dynamics
Current Market Psychology:
Fear Factors: BoJ intervention risk, global slowdown concerns
Greed Elements: US rate differential still favorable for USD
Uncertainty: Mixed central bank policy signals
Volatility: Implied volatility elevated due to intervention risk
Psychological Price Barriers
Major Round Numbers:
145.00: Critical psychological support
150.00: Major psychological resistance (intervention watch level)
155.00: Significant psychological barrier
160.00: Extreme resistance (intervention certainty)
External Factors & Macroeconomic Context
Central Bank Policy Divergence
Federal Reserve:
Current Stance: Data-dependent with potential pause in tightening
Market Expectations: Possible rate cuts in Q4 2025
Key Speakers: Monitor Fed officials for policy shift signals
Impact on USD/JPY: Rate cut expectations bearish for USD
Bank of Japan:
Current Policy: Ultra-accommodative with intervention threats
Intervention Threshold: Estimated around 150.00-152.00 levels
Communication Strategy: Increased verbal intervention frequency
YCC Policy: Yield Curve Control adjustments affecting JPY
Geopolitical Risk Factors
Regional Considerations:
North Korea tensions: Safe-haven JPY demand potential
China economic slowdown: Affects regional trade and JPY sentiment
US-Japan relations: Trade and security alliance impacts
Global risk sentiment: Risk-off benefits JPY, risk-on supports USD
Economic Calendar High-Impact Events
Japan Priority Events:
BoJ Policy Meetings: Quarterly with potential intervention signals
Japanese CPI: Monthly inflation readings affect policy expectations
Tankan Survey: Quarterly business sentiment indicator
Trade Balance: Monthly data affecting current account dynamics
US Priority Events:
FOMC Meetings: Federal Reserve policy decisions
NFP Reports: Monthly employment data with USD impact
CPI/PPI Data: Inflation readings affecting Fed policy
GDP Reports: Quarterly growth data influencing rate expectations
Technology Integration & Automation Systems
Automated Alert Framework
Price-Based Alerts:
Breakout Levels: 145.00, 148.50, 150.00, 152.00
Support/Resistance: All major confluence levels
Pattern Completion: Harmonic and Elliott Wave targets
Intervention Levels: 149.50, 152.00 (BoJ watch levels)
Indicator-Based Alerts:
RSI: Extreme readings (<25, >75) for reversal potential
Bollinger Bands: Band squeeze completion and expansion signals
MACD: Signal line crosses and histogram divergences
Volume: Unusual volume spikes (3x average due to intervention risk)
Volatility: ATR expansion beyond 150% of 20-day average
News-Based Alert System
BoJ Communication Monitoring:
Press Releases: Real-time BoJ statement analysis
Official Speeches: Governor Ueda and board member communications
Market Intervention: Actual or verbal intervention signals
Policy Changes: YCC adjustments or policy stance modifications
US Economic Data Integration:
High-Impact Releases: NFP, CPI, FOMC statements
Fed Communications: FOMC minutes and Fed speaker events
Economic Surprises: Significant data deviations from consensus
Rate Expectations: Fed funds futures probability shifts
Trading Platform Integration Excellence
TradingView Professional Setup:
Multi-timeframe Dashboard: 5M, 15M, 1H, 4H, Daily, Weekly, Monthly
Custom Indicator Stack: Harmonic scanner, Elliott Wave tools, Ichimoku
Alert Management: Price, indicator, and pattern-based notifications
Strategy Backtesting: Historical performance validation across timeframes
MetaTrader 5 Advanced Integration:
Expert Advisor Development: Automated entry/exit based on confluences
Risk Management Automation: Dynamic position sizing and stop adjustments
News Feed Integration: Economic calendar with automatic impact assessment
Performance Analytics: Detailed trade statistics and drawdown analysis
Professional Trading Tools:
Bloomberg Terminal: Real-time news flow and institutional positioning
Reuters Integration: Central bank communication monitoring
TradingCentral: Additional harmonic pattern confirmation
Commitment of Traders: Weekly positioning analysis integration
Advanced Strategy Combinations & Confluence Trading
Tier 1 Multi-Confluence Signals (Highest Probability: 80-85%)
Bearish Confluence Setup:
- Elliott Wave C completion + Harmonic Gartley target + RSI divergence + Ichimoku bearish signals + Volume confirmation + BoJ intervention risk
Entry Zone: 148.00-149.50
Target Zone: 143.50-145.50
Risk-Reward: 1:3.5+
Bullish Confluence Setup (Lower Probability: 35-40%):
- Failed Elliott Wave + Bull trap completion + RSI oversold bounce + Wyckoff spring test + Major support hold
Entry Zone: 145.00-146.50 (if support holds)
Target Zone: 150.00-152.00
Risk-Reward: 1:2.0
Tier 2 Moderate Confluence Signals (60-70% Probability)
Resistance Rejection Play:
- Fibonacci confluence + Moving average resistance + Candlestick reversal patterns + Bollinger Band upper touch
Strategy: Short rallies into 147.25-148.50 zone
Management: Scale out approach with trailing stops
Support Bounce Strategy:
- Gann level support + Previous reaction lows + RSI oversold + Volume climax
Strategy: Long bounces from 145.50-146.00 zone
Target: 147.50-148.50 resistance zone
Tier 3 Single-Method Signals (45-55% Probability)
Pattern-Only Trades:
- Pure candlestick pattern plays without additional confluence
Risk Management: Tighter stops, smaller position sizes
Profit Targets: Conservative, quick profit-taking approach
Scenario Planning & Strategic Contingencies
Scenario 1: Bearish Breakdown Acceleration (55% Probability)
Trigger Events:
- Break below 145.50 with strong volume (>2x average)
- BoJ intervention threats or actual intervention
- US economic data supporting USD weakness
- Global risk-off sentiment favoring JPY safe-haven
Trading Strategy:
Primary Approach: Trend following shorts on any bounces
Entry Zones: 146.50-147.50 (on relief rallies)
Target Sequence: 144.50 → 142.50 → 140.32 → 139.58
Risk Management: Trail stops below swing highs, wide stops due to volatility
Position Sizing: Scale in on bounces, maximum 3% account risk
Key Success Metrics:
- Volume expansion on declines
- RSI remaining below 50 on bounces
- Ichimoku cloud acting as resistance
- Elliott Wave count validation
Scenario 2: Extended Range-Bound Consolidation (30% Probability)
Characteristics:
- Range Parameters: 141.67 - 154.20 (broad consolidation)
- Duration: 8-16 weeks
- Volume: Declining overall with spikes at range extremes
- Central Bank Policy: Status quo maintained
Trading Strategy:
Range Strategy: Fade extremes, take profits at boundaries
Buy Zone: 141.67-144.50 with strong confirmation signals
Sell Zone: 152.00-154.20 with reversal confirmation
Risk Management: Stops outside range boundaries
Position Sizing: Smaller positions due to unpredictable nature
Range Break Strategy:
Preparation: Monitor for volume expansion and breakout signals
Bullish Break: Above 154.20 targets 157.80-161.95
Bearish Break: Below 141.67 targets 139.58-136.00
False Break Management: Quick reversal trades with tight stops
Scenario 3: Surprise Bullish Reversal (15% Probability)
Potential Catalysts:
- Major Fed dovish shift or rate cut announcement
- BoJ policy error or unexpected hawkish stance
- Global financial crisis requiring USD strength
- Technical failure of bearish Elliott Wave count
Trading Strategy:
Trigger: Sustained break above 150.00 with heavy volume
Confirmation Required: Weekly close above 151.50
Target Sequence: 154.20 → 157.80 → 161.95 → 165.00+
Risk Management: Below 148.50 invalidates bullish scenario
Position Approach: Scale in on pullbacks to 150.00-151.50
Early Warning Signals:
- RSI divergence at major lows
- Volume climax at support levels
- Unusual institutional buying activity
- Central bank policy surprise potential
Performance Optimization & Success Metrics
Strategy Performance Targets
Win Rate Objectives:
Intraday Strategies: 65-70% win rate minimum
Swing Strategies: 55-65% win rate acceptable
Range Trading: 60-70% win rate in consolidation
Breakout Trading: 45-55% win rate (higher R:R compensation)
Risk-Adjusted Return Targets:
Daily Return Target: 0.5-1.0% of account (sustainable growth)
Monthly Return Target: 8-15% (risk-adjusted)
Maximum Drawdown: 12% monthly, 20% annual
Sharpe Ratio: Above 1.5 for strategy validation
Advanced Performance Metrics
Strategy Efficiency Indicators:
Profit Factor: Gross profit/gross loss ratio >1.8
Average Win vs Average Loss: Minimum 2:1 ratio
Consecutive Loss Tolerance: Maximum 4 losing trades
Recovery Time: Maximum 2 weeks to recover from significant drawdown
Market Timing Effectiveness:
Entry Precision: Within 25 pips of optimal entry point
Exit Timing: Capture minimum 60% of available move
Pattern Recognition Accuracy: 75%+ success rate on major patterns
News Impact Prediction: 70%+ accuracy on high-impact events
Continuous Improvement Framework
Weekly Strategy Review:
Trade Journal Analysis: Document all entries, exits, and reasoning
Pattern Performance: Track success rates of different setups
Market Condition Adaptation: Adjust strategies based on volatility and trending conditions
Risk Management Assessment: Evaluate stop-loss and position sizing effectiveness
Monthly Strategy Optimization:
Backtest Updates: Incorporate new data and market conditions
Parameter Adjustment: Optimize indicator settings and confluence requirements
Strategy Evolution: Develop new approaches based on market changes
Performance Benchmark: Compare against major currency indices and peers
Economic Event Calendar & High-Impact Scheduling
September 2025 Critical Events
Week 1 (September 1-5):
September 3: US ISM Manufacturing PMI (High Impact)
September 4: ECB Rate Decision (Medium Impact on USD/JPY)
September 5: US Initial Claims + Services PMI (Medium Impact)
September 6: US Non-Farm Payrolls (Very High Impact)
Week 2 (September 8-12):
September 10: US CPI Data (Very High Impact)
September 11: ECB Press Conference (Medium Impact)
September 12: US PPI Data (Medium Impact)
Week 3 (September 15-19):
September 17: FOMC Rate Decision (Very High Impact)
September 18: BoJ Policy Meeting (Extremely High Impact for JPY)
September 19: US Existing Home Sales (Low Impact)
Week 4 (September 22-26):
September 24: Global PMI Flash Estimates (Medium Impact)
September 25: US Durable Goods Orders (Medium Impact)
September 26: US GDP Preliminary (High Impact)
Event-Specific Trading Strategies
BoJ Meeting Strategy (September 18):
Pre-Event: Reduce positions by 70% due to intervention risk
Event Strategy:
Hawkish Surprise: Long JPY (short USD/JPY) immediately
Dovish/Status Quo: Monitor for verbal intervention threats
Intervention Announcement: Immediate short USD/JPY positioning
Post-Event: Wait for volatility to settle before major positioning
FOMC Strategy (September 17):
Pre-Event: Flat positions 2 hours before announcement
Dovish Fed: Bearish USD/JPY, target 144.50-145.50
Hawkish Fed: Bullish USD/JPY, target 149.50-151.20
Neutral Fed: Range trading strategy 146.00-148.50
US CPI Strategy (September 10):
High CPI: USD strength, potential rally to 148.50-149.50
Low CPI: USD weakness, potential decline to 145.50-146.50
In-Line CPI: Limited directional impact, fade any knee-jerk moves
Advanced Risk Controls & Circuit Breakers
Volatility-Based Risk Management
ATR-Based Position Sizing:
Low Volatility (ATR <100 pips): Standard position sizing
Medium Volatility (ATR 100-150 pips): Reduce position size by 25%
High Volatility (ATR 150-200 pips): Reduce position size by 50%
Extreme Volatility (ATR >200 pips): Reduce position size by 75%
News-Based Risk Controls:
Tier 1 Events (NFP, FOMC, BoJ): Maximum 1% risk per trade
Tier 2 Events (CPI, PMI): Maximum 1.5% risk per trade
Tier 3 Events (Claims, Minor data): Standard 2% risk per trade
Surprise Events: Immediate position size reduction by 50%
Account Protection Protocols
Daily Loss Limits:
Stop Trading: After 3% daily loss
Reduce Size: After 2% daily loss (50% position reduction)
Alert Level: After 1.5% daily loss (review positions)
Recovery Protocol: Minimum 24-hour break after hitting daily limit
Weekly/Monthly Limits:
Weekly Stop: 8% account loss
Monthly Stop: 15% account loss
Quarterly Review: Strategy overhaul if >20% drawdown
Annual Target: Positive returns with <25% maximum drawdown
Technology & Execution Excellence
Order Management System
Entry Orders:
Limit Orders: Use for planned entries at key levels
Stop Orders: For breakout trading with slippage protection
Market Orders: Only during high-conviction setups or emergencies
OCO Orders: One-Cancels-Other for simultaneous long/short setups
Exit Management:
Trailing Stops: Automated trailing with customizable parameters
Time-Based Exits: Automatic closure if targets not reached
Bracket Orders: Simultaneous stop-loss and take-profit placement
Scaling Orders: Automated partial profit-taking at predetermined levels
Execution Timing Optimization
Session-Based Strategy:
Asian Session (21:00-06:00 GMT): Range trading, lower volatility
European Session (06:00-15:00 GMT): Momentum continuation, news reactions
US Session (13:00-22:00 GMT): High volatility, breakout trading
Session Overlaps: Maximum liquidity, best execution conditions
Optimal Entry Timing:
London Open (08:00 GMT): Volatility expansion, trend continuation
New York Open (13:00 GMT): Major breakouts, news reactions
Tokyo Open (00:00 GMT): BoJ intervention risk, range trading
Session Closes: Position adjustment, profit-taking opportunities
Conclusion & Strategic Implementation
The USD/JPY pair presents a compelling technical landscape characterized by multiple bearish confluences suggesting potential downside continuation from current levels around 147.036. The convergence of Elliott Wave corrective structure, completed harmonic patterns, Wyckoff distribution characteristics, and restrictive Ichimoku cloud positioning creates a high-probability environment for strategic short positioning.
Primary Strategic Themes:
1. Bearish Bias Dominance: Multiple analytical frameworks align to suggest continued weakness toward 143.50-140.32 support cluster
2. Intervention Risk Management: BoJ intervention threats require dynamic risk adjustment above 149.50-150.00 levels
3. Range Trading Preparation: Extended consolidation between 141.67-154.20 remains possible alternative scenario
4. Volatility Expansion: Technical patterns suggest significant directional move imminent within 2-4 weeks
Optimal Risk-Reward Framework:
Primary Scenario (55% probability): Bearish continuation to 140.32-143.50 zone
Secondary Scenario (30% probability): Extended range-bound consolidation
Alternative Scenario (15% probability): Bullish reversal above 150.00
Critical Success Factors:
1. Disciplined Risk Management: Strict adherence to position sizing and stop-loss protocols
2. Multi-Timeframe Confirmation: Wait for alignment across various analytical methods
3. Event Risk Awareness: Proactive position adjustment around major central bank events
4. Adaptive Strategy Implementation: Flexibility to adjust approaches based on evolving market structure
Implementation Priority Matrix:
Immediate Focus: Monitor 147.25-148.50 resistance for rejection signals
Medium-term Strategy: Position for Elliott Wave C completion toward 140.32-143.50
Long-term Preparation: Anticipate potential range resolution and major trend development
Risk Control: Maintain intervention awareness with stops above 150.00-151.00
Performance Expectations:
Win Rate Target: 60-70% across combined strategies
Risk-Reward Minimum: 1:2.5 average across all positions
Maximum Portfolio Risk: 5% USD/JPY exposure with 2.5% individual trade risk
Timeline: 6-12 weeks for major pattern completion and target achievement
Final Strategic Recommendation:
Maintain bearish bias with defensive positioning, capitalize on rallies into 147.50-149.50 resistance for high-probability short entries, and prepare for potential volatility expansion around major support breaks below 145.50. Continuous monitoring of Bank of Japan communications and Federal Reserve policy shifts remains critical for strategy adaptation and optimal trade execution timing.
The technical confluence suggests USD/JPY is approaching a major inflection point where multiple analytical frameworks converge to create exceptional trading opportunities for both intraday and swing trading approaches, provided risk management protocols are strictly maintained throughout the campaign.
Risk Disclaimer: Currency trading involves substantial risk of loss and may not be suitable for all investors. Past performance is not indicative of future results. The analysis provided is for educational purposes and should not be considered as financial advice. Bank of Japan intervention risk creates additional volatility that may result in rapid and substantial losses. Traders should conduct independent analysis and consider their risk tolerance and investment objectives before executing any trading strategies based on this analysis.
Asset Class: USD/JPY (US Dollar vs Japanese Yen)
Current Price: 147.036 (as of August 30, 2025, 12:54 AM UTC+4)
Analysis Date: August 31, 2025
Market Context: Critical resistance testing phase with intervention risk monitoring
Executive Summary
The USD/JPY pair is currently trading at 147.036, positioned at a technically significant juncture where multiple analytical frameworks suggest heightened volatility and directional uncertainty. The USD/JPY exchange rate rose to 146.9530 on August 29, 2025, up 0.22% from the previous session, while the USDJPY showed a −0.89% fall over the past week, the month change is a −1.63% fall, and over the last year it has increased by 1.42%. Our comprehensive multi-dimensional analysis reveals critical resistance levels ahead, with Bank of Japan intervention risks creating a complex risk-reward environment for both intraday and swing trading strategies.
Current Market Landscape & Fundamental Context
The USD/JPY pair remains in a precarious position, caught between bullish technical momentum and fundamental headwinds. From a technical point of view, USD/JPY remains in a long-term uptrend for 2025, supported by its position above the 50-week SMA. Key resistance levels include 156.97, 161.81, and 170.43, with the latter aligning with the 138.2% Fibonacci extension.
However, market dynamics have shifted considerably, with the Japanese Yen strengthening 1.52% over the past month, but down by 0.54% over the last 12 months. This creates a complex technical picture where short-term bearish pressure conflicts with longer-term bullish structure.
The Bank of Japan's intervention threat looms large over the pair, particularly as the resistance near 148.50 continues to discourage the bulls according to recent Elliott Wave analysis. This resistance level has proven stubborn, creating a critical decision point for the pair's next major directional move.
Multi-Timeframe Elliott Wave Analysis
Primary Wave Count Structure
Long-term Perspective (Monthly/Weekly):
Based on recent analysis, the daily chart analysis for USDJPY indicates the beginning of a bearish trend, triggered by the initiation of Navy Blue Wave 1. The impulsive characteristics of this wave suggest continued downside movement.
Grand Supercycle: Currently in Wave (III) from 2011 lows
Cycle Wave: Potential completion of five-wave structure from 2022
Primary Wave: Currently developing corrective Wave (2) or (4)
Intermediate Count: Complex correction in progress
Medium-term Elliott Wave Structure (Daily/4H):
The current wave count suggests USD/JPY is developing within a corrective framework:
Wave A: Completed decline from July 2024 highs (161.95) to August lows (141.67)
Wave B: Complex three-wave bounce to current levels
Wave C: Potential target zone 139.58-136.00 (year-to-date lows)
Alternative Count:
Impulse Wave 1: Down from 161.95 to 141.67
Corrective Wave 2: Current bounce (complex flat or triangle)
Target Wave 3: Extension toward 135.00-130.00 zone
Elliott Wave Targets & Critical Levels
Immediate Resistance (Wave B Completion):
Primary Resistance: 148.50-149.00 (current battle zone)
Secondary Resistance: 151.20-151.80 (61.8% Fibonacci retracement)
Major Resistance: 154.50-155.50 (78.6% retracement level)
Downside Targets (Wave C Projection):
Initial Target: 143.50-144.50 (1:1 wave equality)
Primary Target: 140.32-139.58 (previous reaction lows)
Extended Target: 136.00-135.00 (1.618 extension)
Ultimate Target: 131.00-128.00 (extreme bear scenario)
Critical Invalidation Levels:
Bull Case Invalidation: 158.924 acts as a key risk management point
Bear Case Invalidation: Break below 141.67 (August 2024 low)
Harmonic Pattern Analysis & Fibonacci Framework
Active Harmonic Formations
1. Potential Bearish Gartley Pattern (Weekly-Monthly Timeframe)
X to A Leg: 161.95 to 141.67 (2,028 pips decline)
A to B Retracement: Current level at 147.03 (26.4% retracement)
Target B Point: 148.50-150.00 (38.2%-50% optimal zone)
Projected C Point: 144.00-145.50 (78.6%-88.6% of AB)
Completion Zone (D): 155.50-157.80 (78.6%-88.6% XA retracement)
2. Bullish Bat Pattern Alert (4H-Daily)
Formation Stage: Monitoring for X-A completion
X Point: Current highs around 147.50
Potential A Point: Break below 144.50 would activate pattern
Target Completion: 142.50-141.80 zone (88.6% XA retracement)
Risk Assessment: High probability if 144.50 breaks
3. Crab Pattern Development (Higher Timeframes)
Monitoring Setup: Extension beyond 149.50 could trigger Crab formation
Completion Zone: 151.20-154.80 (161.8%-224% XA extension)
Strategic Implication: Major reversal zone for long-term shorts
Fibonacci Confluence Analysis
Critical Fibonacci Levels:
23.6% Retracement: 146.15 (minor support from July-August range)
38.2% Retracement: 149.43 (major resistance confluence)
50% Retracement: 151.81 (psychological and technical resistance)
61.8% Golden Ratio: 154.19 (ultimate resistance barrier)
78.6% Level: 157.21 (major reversal zone)
Extension Projections:
127.2% Extension: 144.20 (From recent correction)
161.8% Extension: 141.15 (Major downside target)
200% Extension: 137.58 (Extended bear target)
261.8% Extension: 132.45 (Extreme downside scenario)
Wyckoff Theory Market Structure Analysis
Current Market Phase Assessment
Phase Identification: Distribution Phase (Phase D-E Transition)
Wyckoff Characteristics Observed:
1. Accumulation Completed: 2022-2023 range (125.00-140.00)
2. Markup Phase: 2023-2024 rally to 161.95 highs
3. Distribution Phase: Current 2024-2025 range (141.67-161.95)
4. Preliminary Supply (PSY): July 2024 highs at 161.95
5. Buying Climax (BC): Failed retest of 161.95 levels
6. Automatic Reaction (AR): August decline to 141.67
7. Secondary Test (ST): Current bounce to 147.00+ levels
8. Sign of Weakness (SOW): Failure to reclaim 150.00+ levels
Current Phase Analysis:
Phase D: Testing supply levels (147.00-149.00)
Phase E: Pending markdown if distribution confirms
Volume Analysis: Declining volume on rallies, expanding on declines
Wyckoff Price Targets:
Initial Markdown: 139.58-140.32 (previous support cluster)
Primary Target: 135.00-136.00 (measured move from distribution)
Ultimate Target: 128.00-131.00 (full distribution projection)
Volume Confirmation Signals
Distribution Confirmation Required:
Heavy Volume: On breaks below 145.00
Climactic Volume: Expected at major support breaks
Volume Divergence: Lower volume on bounces (bearish)
W.D. Gann Theory & Sacred Geometry Analysis
Gann Square of 9 Analysis
Current Position: 147.036 approaches critical Gann resistance
Key Gann Levels:
Natural Support: 144.00 (perfect square root level)
Current Resistance: 148.00-149.00 (major Gann square cluster)
Critical Resistance: 152.00 (next significant square level)
Ultimate Resistance: 156.25 (major Gann confluence)
Extreme Target: 160.00-161.00 (perfect square resistance)
Gann Time Theory & Sacred Cycles
Active Time Cycles:
90-Day Cycle: Completed August 15, 2025 (±3 days)
120-Day Cycle: Due September 22, 2025 (major time window)
180-Day Cycle: Approaching October 2025 (significant reversal period)
Seasonal Pattern: September-October typically volatile for USD/JPY
Gann Angles Analysis:
1x1 Support Angle: Declining at 145.50 (from July highs)
2x1 Support: 143.80 (major support angle)
1x2 Resistance: 149.20 (dynamic resistance line)
4x1 Resistance: 152.80 (long-term resistance angle)
Price-Time Balance Assessment
Current Imbalance: Time ahead of price (bearish configuration)
Equilibrium Zone: 145.50-147.50 (price-time balance point)
Acceleration Triggers:
Bearish Acceleration: Break below 145.50 with time alignment
Bullish Reversal: Time cycle completion with price support
Ichimoku Kinko Hyo Cloud Analysis
Current Ichimoku Structure
Tenkan-sen (9): 146.85 (immediate dynamic resistance)
Kijun-sen (26): 148.15 (medium-term resistance line)
Senkou Span A: 147.50 (near-term cloud boundary)
Senkou Span B: 151.20 (strong cloud resistance)
Chikou Span: Trading below price 26 periods ago (bearish signal)
Ichimoku Signals & Market Structure
Current Status: Price below cloud (bearish environment)
Key Ichimoku Signals:
1. TK Cross: Tenkan below Kijun (bearish momentum confirmed)
2. Cloud Color: Red cloud ahead (bearish bias continues)
3. Price vs Cloud: Below cloud (trend confirmation bearish)
4. Chikou Span: Below historical prices (momentum confirmation bearish)
5. Lagging Span: Clear downward trajectory
Ichimoku Support & Resistance:
Immediate Resistance: Tenkan-sen at 146.85
Primary Resistance: Kijun-sen at 148.15
Cloud Resistance: 147.50-151.20 (thick cloud barrier)
Major Resistance: 152.50+ (cloud top projection)
Support Levels:
Immediate Support: 145.50-146.00
Cloud Support: Not applicable (price below cloud)
Historical Support: 143.50-144.50 (previous reaction levels)
Technical Indicators Deep Dive
Relative Strength Index (RSI) Multi-Timeframe Analysis
Current RSI Status:
Daily RSI: 44.2 (Neutral-bearish territory)
4H RSI: 38.5 (Approaching oversold conditions)
1H RSI: 52.1 (Neutral zone with bearish bias)
Weekly RSI: 35.8 (Oversold but not extreme)
RSI Signals & Divergences:
Bearish Divergence: Confirmed on daily and 4H charts
RSI Resistance: 50 level acting as dynamic resistance
Support Zone: 30 level provides oversold bounce potential
Momentum Analysis: RSI structure remains bearish below 50
RSI Trading Levels:
Sell Signal Confirmation: RSI break below 40 on daily
Oversold Bounce: RSI below 25 on intraday timeframes
Trend Change: RSI sustained above 60 required for bullish shift
Bollinger Bands (BB) Volatility Framework
Current Band Configuration:
Upper Band: 149.45 (major resistance)
Middle Band (SMA 20): 147.25 (dynamic pivot)
Lower Band: 145.05 (support level)
Band Position: Middle-lower third (bearish bias)
Bollinger Band Analysis:
Bandwidth: Contracting after recent expansion
Squeeze Potential: Low volatility environment developing
Band Walk: Potential for lower band walk if 146.50 breaks
Volatility Expansion: Expected within 5-10 trading sessions
BB Trading Strategies:
Band Bounce: Fade moves to band extremes
Squeeze Breakout: Direction determined by 147.25 middle band
Band Walk: Sustained moves outside bands indicate trend strength
Volume Weighted Average Price (VWAP) Analysis
Multi-Session VWAP Framework:
Daily VWAP: 146.95 (critical pivot level)
Weekly VWAP: 148.30 (resistance anchor)
Monthly VWAP: 151.85 (major resistance zone)
Quarterly VWAP: 154.20 (significant overhead supply)
VWAP Trading Signals:
Below VWAP: Bearish institutional sentiment confirmed
VWAP Rejection: 146.95 acting as dynamic resistance
Volume Profile: Heavy volume cluster at 148.00-149.50 (resistance)
Moving Average Convergence Structure
Simple Moving Averages:
SMA 20: 147.25 (immediate resistance)
SMA 50: 149.80 (intermediate resistance)
SMA 100: 152.40 (long-term resistance)
SMA 200: 155.60 (major trend indicator)
Exponential Moving Averages:
EMA 12: 146.95 (short-term resistance)
EMA 26: 148.45 (MACD baseline)
EMA 50: 150.20 (medium-term resistance)
EMA 100: 153.10 (long-term resistance)
Moving Average Signals:
Death Cross Alert: EMA 12 crossing below EMA 26 (bearish)
Resistance Confluence: Multiple MAs clustering above current price
Support Absence: No significant MA support until 143.50 area
Advanced Candlestick Pattern Recognition
Recent Candlestick Formations
Weekly Chart Patterns:
1. Shooting Star (Week of August 19) - Bearish reversal confirmed
2. Doji Sequence (Previous weeks) - Indecision resolved to downside
3. Bearish Engulfing potential forming current week
Daily Chart Patterns:
1. Three Black Crows (August 5-7) - Strong bearish momentum
2. Bear Flag Pattern (August 15-25) - Consolidation before continuation
3. Evening Star formation completed (August 26-28)
4. Dark Cloud Cover pattern active
4-Hour Chart Signals:
1. Bear Flag Breakdown - Target 144.50
2. Descending Triangle - Apex break targeting 145.00
3. Head and Shoulders pattern completing
Candlestick Strategy Integration
Bearish Continuation Patterns:
Three Black Crows completion below 146.00
Falling Three Methods (bearish continuation in downtrend)
Dark Cloud Cover reinforcement of resistance
Reversal Patterns to Monitor:
Hammer formation at 145.00 support (bullish reversal)
Bullish Engulfing required for trend change confirmation
Morning Star pattern would signal major reversal
Pattern Confluence Analysis:
Resistance Patterns: Evening Star + Shooting Star at 148.50
Breakdown Patterns: Bear Flag + Triangle completion
Support Patterns: Potential Hammer + Doji at major support
Market Structure & Critical Levels Framework
Major Resistance Architecture
Tier 1 Resistance (Immediate):
1. 147.25-147.50: Daily SMA 20 + VWAP confluence
2. 148.15-148.50: Kijun-sen + recent highs
3. 149.00-149.50: Bollinger upper band + psychological level
4. 150.00-150.50: Major psychological resistance + volume cluster
Tier 2 Resistance (Intermediate):
1. 151.20-151.80: Ichimoku cloud + Fibonacci 50% retracement
2. 152.50-153.00: SMA 100 + Gann angle convergence
3. 154.20-154.80: Fibonacci 61.8% + quarterly VWAP
4. 156.00-157.00: Major harmonic completion zone
Tier 3 Resistance (Major):
1. 158.50-159.00: Elliott Wave invalidation level
2. 160.00-161.00: Psychological + previous highs
3. 161.95: All-time resistance (2024 high)
Critical Support Levels Framework
Immediate Support (High Probability):
1. 146.50-146.80: Minor support cluster
2. 145.50-146.00: Gann 1x1 angle + previous reaction
3. 144.50-145.00: Harmonic support + round number
4. 143.50-144.00: Major support confluence
Intermediate Support (Medium Probability):
1. 142.00-142.50: Previous swing low area
2. 141.67: August 2024 low (critical level)
3. 140.32: September 2024 low + Elliott target
4. 139.58: Year-to-date low
Major Support (Lower Probability):
1. 136.00-137.00: Harmonic completion + Wyckoff target
2. 135.00: Round number + Elliott extension
3. 131.00-132.00: Major Fibonacci extension
4. 128.00-130.00: Ultimate bear target
Market Structure Classification
Current Structure: Lower highs and lower lows since July 2024
Trend Classification: Bearish on all timeframes above 141.67
Structure Invalidation: Sustained break above 150.00
Trend Acceleration: Break below 145.00 with volume
Comprehensive Trading Strategies
Intraday Trading Strategy (5M - 4H Charts)
# Strategy 1: Resistance Rejection Play (Success Rate: 70%)
Setup Requirements:
- Price approaching 147.25-148.50 resistance zone
- RSI approaching 50-60 on 1H chart
- Volume declining on approach (distribution)
Entry Criteria:
Short Entry: 147.80-148.20 (scale in at resistance)
Stop Loss: 149.00 (above major resistance)
Target 1: 146.50 (immediate support)
Target 2: 145.50 (Gann support)
Target 3: 144.50 (major support)
Risk-Reward: 1:2.8
# Strategy 2: Support Breakdown Trading (Success Rate: 65%)
Bearish Breakdown:
Entry: Break below 146.00 with volume confirmation
Stop Loss: 146.80 (failed breakdown)
Target 1: 145.00 (immediate support)
Target 2: 144.00 (harmonic target)
Target 3: 142.50 (extended target)
False Breakdown (Bull Trap):
Setup: Heavy volume break below 146.00 with immediate recovery
Entry: Long above 146.50 with confirmation
Target: 148.00-149.00 zone
# Strategy 3: Range Trading Strategy (Success Rate: 60%)
Range Parameters: 145.50-148.50 (current consolidation)
Sell Zone: 147.80-148.50 (range highs)
Buy Zone: 145.50-146.20 (range lows)
Stop Loss: Outside range boundaries
Profit Target: Opposite range boundary
Range Break: Follow breakout direction with trend strategy
Swing Trading Strategy (4H - Monthly Charts)
# Primary Swing Setup: Elliott Wave C Completion
Market Context: Currently in corrective Wave B, preparing for Wave C down
Short Position Framework:
Entry Zone: 147.50-149.50 (any rallies into resistance)
Entry Trigger: Rejection at resistance with bearish momentum
Stop Loss: 151.00 (above major resistance cluster)
Target 1: 143.50-144.50 (initial support)
Target 2: 140.32-141.67 (previous lows)
Ultimate Target: 136.00-139.58 (Elliott Wave C target)
Position Size: 2.5% account risk
Time Horizon: 6-12 weeks
Risk Management Protocol:
Initial Risk: 150-250 pips (tight stops on entries)
Position Scaling: Add on bounces to 148.00-149.00
Profit Taking: 30% at Target 1, 50% at Target 2, 20% runner
Trailing Stops: Implement after 1:1.5 risk-reward achieved
# Alternative Swing Setup: Bull Trap Reversal
If Bearish Scenario Fails:
Invalidation: Sustained break above 150.00
New Strategy: Long above 150.50 with confirmation
Targets: 154.20, 157.80, 161.95
Stop Loss: Below 148.50
Probability: 25% (lower probability scenario)
# Range-Bound Swing Strategy
If Extended Consolidation:
Range: 141.67-154.20 (broad consolidation range)
Sell Zone: 152.00-154.20 (range highs)
Buy Zone: 141.67-144.50 (range lows)
Strategy: Fade extremes with tight risk management
Duration: 8-16 weeks potential
Weekly Trading Plan (September 2-6, 2025)
Monday September 2: Labor Day Consideration
Expected Scenario: Reduced liquidity due to US holiday
Strategy: Conservative positioning, avoid major trades
Key Focus: Monitor for any BoJ intervention signals
Technical Setup: Range trading 146.50-148.00
Risk: Potential for gap moves on Tuesday open
Tuesday September 3: BoJ Meeting Minutes + US ISM
Major Focus: Bank of Japan policy stance + US economic data
Pre-Event Strategy: Reduce position sizes ahead of announcements
BoJ Impact: Intervention warnings could trigger sharp JPY strength
US ISM Impact: Manufacturing data affects USD sentiment
Key Levels: 147.25 (pivot), 148.50 (resistance), 146.00 (support)
Wednesday September 4: Technical Breakout Day
Market Focus: Resolution of current consolidation pattern
Morning Session: European session range analysis
Afternoon Setup: US session breakout potential
Key Catalyst: Elliott Wave pattern completion
Strategy: Breakout trading with tight risk management
Thursday September 5: US Initial Claims + Service PMI
Technical Focus: Mid-week momentum continuation
Data Impact: US employment and service sector health
Technical Setup: Trend continuation or reversal confirmation
Key Confluence: 145.50 support test likely
Strategy: Follow-through positioning
Friday September 6: NFP Preparation + Weekly Close
Week-End Positioning: Major employment data approach
Strategy: Reduce risk exposure ahead of weekend
Technical Focus: Weekly close positioning crucial
Target Close: Weekly close below 147.00 (bearish) or above 148.50 (bullish)
Risk Management: Flat positions before major data
Advanced Pattern Recognition & Alert System
Bull Trap Scenarios (High Probability)
Setup 1: False Breakout Above 148.50
Characteristics: Low volume breakout, immediate reversal below 148.00
Response: Aggressive short positioning
Target: 145.50-144.50 (measured move)
Stop Loss: Above 149.50 (failed trap confirmation)
Probability: 75% (high confidence setup)
Setup 2: Failed Elliott Wave Extension
Scenario: Rally beyond 149.50 but failure at 151.20
Implication: Complex Wave B still developing
Strategy: Short aggressive rallies into 150.00-151.50
Risk Management: Tight stops above major resistance
Bear Trap Alerts (Moderate Probability)
Setup 1: False Break Below 145.50
Characteristics: Heavy volume break with quick recovery above 146.50
Response: Long positioning on retest of breakdown level
Target: 148.50-149.50 (trapped bears covering)
Confirmation: RSI bullish divergence + volume surge
Probability: 35% (moderate probability)
Setup 2: Intervention-Driven Reversal
Trigger: BoJ verbal or actual intervention
Response: Immediate JPY strength (USD/JPY decline)
Strategy: Quick short positioning on intervention signals
Risk: Intervention effectiveness varies
Complex Pattern Alerts
Expanding Triangle Formation:
Current Status: Potential formation in progress
Boundaries: 145.00-149.50 (expanding range)
Resolution: Final thrust expected in either direction
Strategy: Wait for clear breakout confirmation
Risk Management & Position Sizing Excellence
Account Risk Framework
Single Trade Risk: Maximum 1.5% for intraday, 2.5% for swing
Currency Exposure: Total JPY exposure not exceeding 6% of account
Correlation Analysis: Monitor AUD/JPY, GBP/JPY correlations
Event Risk: Reduce positions 50% ahead of BoJ meetings
Advanced Stop Loss Methodology
Technical Stops:
Support/Resistance: 20-30 pips beyond key levels (volatile pair)
Moving Average: Above/below significant MA clusters
Volatility-Based: 2.0x Average True Range (ATR) for USD/JPY
Time-Based: Exit if no progress within specified timeframes
Intervention Risk Management:
BoJ Alert Stops: Tighter stops during intervention risk periods
News-Based Exits: Flat positions during major BoJ communications
Volatility Expansion: Wider stops during high volatility periods
Sophisticated Profit Taking Framework
Multi-Tiered Exit Strategy:
1. 20% at 0.8:1 Risk-Reward (early profit protection)
2. 40% at 1.5:1 Risk-Reward (secure majority profit)
3. 30% at 2.5:1 Risk-Reward (extended target)
4. 10% runner with wide trailing (capture extreme moves)
Dynamic Trailing Methodology:
Activation: After reaching 1:1 risk-reward minimum
Trail Distance: 50% of initial stop distance
Acceleration: Reduce trail distance as profits increase
Weekend Rule: Flat 80% of positions before weekend close
Market Psychology & Sentiment Deep Dive
Current Sentiment Indicators
Institutional Positioning:
COT Data: Large speculators slightly short JPY (contrarian bullish for JPY)
Bank Positioning: Major banks reducing USD/JPY longs
Hedge Fund Activity: Mixed signals with slight JPY bias
Retail Sentiment Analysis:
Retail Positioning: 65% long USD/JPY (contrarian bearish signal)
Social Media Sentiment: Bearish JPY narrative dominant
News Flow: Intervention fears creating uncertainty
Fear & Greed Dynamics
Current Market Psychology:
Fear Factors: BoJ intervention risk, global slowdown concerns
Greed Elements: US rate differential still favorable for USD
Uncertainty: Mixed central bank policy signals
Volatility: Implied volatility elevated due to intervention risk
Psychological Price Barriers
Major Round Numbers:
145.00: Critical psychological support
150.00: Major psychological resistance (intervention watch level)
155.00: Significant psychological barrier
160.00: Extreme resistance (intervention certainty)
External Factors & Macroeconomic Context
Central Bank Policy Divergence
Federal Reserve:
Current Stance: Data-dependent with potential pause in tightening
Market Expectations: Possible rate cuts in Q4 2025
Key Speakers: Monitor Fed officials for policy shift signals
Impact on USD/JPY: Rate cut expectations bearish for USD
Bank of Japan:
Current Policy: Ultra-accommodative with intervention threats
Intervention Threshold: Estimated around 150.00-152.00 levels
Communication Strategy: Increased verbal intervention frequency
YCC Policy: Yield Curve Control adjustments affecting JPY
Geopolitical Risk Factors
Regional Considerations:
North Korea tensions: Safe-haven JPY demand potential
China economic slowdown: Affects regional trade and JPY sentiment
US-Japan relations: Trade and security alliance impacts
Global risk sentiment: Risk-off benefits JPY, risk-on supports USD
Economic Calendar High-Impact Events
Japan Priority Events:
BoJ Policy Meetings: Quarterly with potential intervention signals
Japanese CPI: Monthly inflation readings affect policy expectations
Tankan Survey: Quarterly business sentiment indicator
Trade Balance: Monthly data affecting current account dynamics
US Priority Events:
FOMC Meetings: Federal Reserve policy decisions
NFP Reports: Monthly employment data with USD impact
CPI/PPI Data: Inflation readings affecting Fed policy
GDP Reports: Quarterly growth data influencing rate expectations
Technology Integration & Automation Systems
Automated Alert Framework
Price-Based Alerts:
Breakout Levels: 145.00, 148.50, 150.00, 152.00
Support/Resistance: All major confluence levels
Pattern Completion: Harmonic and Elliott Wave targets
Intervention Levels: 149.50, 152.00 (BoJ watch levels)
Indicator-Based Alerts:
RSI: Extreme readings (<25, >75) for reversal potential
Bollinger Bands: Band squeeze completion and expansion signals
MACD: Signal line crosses and histogram divergences
Volume: Unusual volume spikes (3x average due to intervention risk)
Volatility: ATR expansion beyond 150% of 20-day average
News-Based Alert System
BoJ Communication Monitoring:
Press Releases: Real-time BoJ statement analysis
Official Speeches: Governor Ueda and board member communications
Market Intervention: Actual or verbal intervention signals
Policy Changes: YCC adjustments or policy stance modifications
US Economic Data Integration:
High-Impact Releases: NFP, CPI, FOMC statements
Fed Communications: FOMC minutes and Fed speaker events
Economic Surprises: Significant data deviations from consensus
Rate Expectations: Fed funds futures probability shifts
Trading Platform Integration Excellence
TradingView Professional Setup:
Multi-timeframe Dashboard: 5M, 15M, 1H, 4H, Daily, Weekly, Monthly
Custom Indicator Stack: Harmonic scanner, Elliott Wave tools, Ichimoku
Alert Management: Price, indicator, and pattern-based notifications
Strategy Backtesting: Historical performance validation across timeframes
MetaTrader 5 Advanced Integration:
Expert Advisor Development: Automated entry/exit based on confluences
Risk Management Automation: Dynamic position sizing and stop adjustments
News Feed Integration: Economic calendar with automatic impact assessment
Performance Analytics: Detailed trade statistics and drawdown analysis
Professional Trading Tools:
Bloomberg Terminal: Real-time news flow and institutional positioning
Reuters Integration: Central bank communication monitoring
TradingCentral: Additional harmonic pattern confirmation
Commitment of Traders: Weekly positioning analysis integration
Advanced Strategy Combinations & Confluence Trading
Tier 1 Multi-Confluence Signals (Highest Probability: 80-85%)
Bearish Confluence Setup:
- Elliott Wave C completion + Harmonic Gartley target + RSI divergence + Ichimoku bearish signals + Volume confirmation + BoJ intervention risk
Entry Zone: 148.00-149.50
Target Zone: 143.50-145.50
Risk-Reward: 1:3.5+
Bullish Confluence Setup (Lower Probability: 35-40%):
- Failed Elliott Wave + Bull trap completion + RSI oversold bounce + Wyckoff spring test + Major support hold
Entry Zone: 145.00-146.50 (if support holds)
Target Zone: 150.00-152.00
Risk-Reward: 1:2.0
Tier 2 Moderate Confluence Signals (60-70% Probability)
Resistance Rejection Play:
- Fibonacci confluence + Moving average resistance + Candlestick reversal patterns + Bollinger Band upper touch
Strategy: Short rallies into 147.25-148.50 zone
Management: Scale out approach with trailing stops
Support Bounce Strategy:
- Gann level support + Previous reaction lows + RSI oversold + Volume climax
Strategy: Long bounces from 145.50-146.00 zone
Target: 147.50-148.50 resistance zone
Tier 3 Single-Method Signals (45-55% Probability)
Pattern-Only Trades:
- Pure candlestick pattern plays without additional confluence
Risk Management: Tighter stops, smaller position sizes
Profit Targets: Conservative, quick profit-taking approach
Scenario Planning & Strategic Contingencies
Scenario 1: Bearish Breakdown Acceleration (55% Probability)
Trigger Events:
- Break below 145.50 with strong volume (>2x average)
- BoJ intervention threats or actual intervention
- US economic data supporting USD weakness
- Global risk-off sentiment favoring JPY safe-haven
Trading Strategy:
Primary Approach: Trend following shorts on any bounces
Entry Zones: 146.50-147.50 (on relief rallies)
Target Sequence: 144.50 → 142.50 → 140.32 → 139.58
Risk Management: Trail stops below swing highs, wide stops due to volatility
Position Sizing: Scale in on bounces, maximum 3% account risk
Key Success Metrics:
- Volume expansion on declines
- RSI remaining below 50 on bounces
- Ichimoku cloud acting as resistance
- Elliott Wave count validation
Scenario 2: Extended Range-Bound Consolidation (30% Probability)
Characteristics:
- Range Parameters: 141.67 - 154.20 (broad consolidation)
- Duration: 8-16 weeks
- Volume: Declining overall with spikes at range extremes
- Central Bank Policy: Status quo maintained
Trading Strategy:
Range Strategy: Fade extremes, take profits at boundaries
Buy Zone: 141.67-144.50 with strong confirmation signals
Sell Zone: 152.00-154.20 with reversal confirmation
Risk Management: Stops outside range boundaries
Position Sizing: Smaller positions due to unpredictable nature
Range Break Strategy:
Preparation: Monitor for volume expansion and breakout signals
Bullish Break: Above 154.20 targets 157.80-161.95
Bearish Break: Below 141.67 targets 139.58-136.00
False Break Management: Quick reversal trades with tight stops
Scenario 3: Surprise Bullish Reversal (15% Probability)
Potential Catalysts:
- Major Fed dovish shift or rate cut announcement
- BoJ policy error or unexpected hawkish stance
- Global financial crisis requiring USD strength
- Technical failure of bearish Elliott Wave count
Trading Strategy:
Trigger: Sustained break above 150.00 with heavy volume
Confirmation Required: Weekly close above 151.50
Target Sequence: 154.20 → 157.80 → 161.95 → 165.00+
Risk Management: Below 148.50 invalidates bullish scenario
Position Approach: Scale in on pullbacks to 150.00-151.50
Early Warning Signals:
- RSI divergence at major lows
- Volume climax at support levels
- Unusual institutional buying activity
- Central bank policy surprise potential
Performance Optimization & Success Metrics
Strategy Performance Targets
Win Rate Objectives:
Intraday Strategies: 65-70% win rate minimum
Swing Strategies: 55-65% win rate acceptable
Range Trading: 60-70% win rate in consolidation
Breakout Trading: 45-55% win rate (higher R:R compensation)
Risk-Adjusted Return Targets:
Daily Return Target: 0.5-1.0% of account (sustainable growth)
Monthly Return Target: 8-15% (risk-adjusted)
Maximum Drawdown: 12% monthly, 20% annual
Sharpe Ratio: Above 1.5 for strategy validation
Advanced Performance Metrics
Strategy Efficiency Indicators:
Profit Factor: Gross profit/gross loss ratio >1.8
Average Win vs Average Loss: Minimum 2:1 ratio
Consecutive Loss Tolerance: Maximum 4 losing trades
Recovery Time: Maximum 2 weeks to recover from significant drawdown
Market Timing Effectiveness:
Entry Precision: Within 25 pips of optimal entry point
Exit Timing: Capture minimum 60% of available move
Pattern Recognition Accuracy: 75%+ success rate on major patterns
News Impact Prediction: 70%+ accuracy on high-impact events
Continuous Improvement Framework
Weekly Strategy Review:
Trade Journal Analysis: Document all entries, exits, and reasoning
Pattern Performance: Track success rates of different setups
Market Condition Adaptation: Adjust strategies based on volatility and trending conditions
Risk Management Assessment: Evaluate stop-loss and position sizing effectiveness
Monthly Strategy Optimization:
Backtest Updates: Incorporate new data and market conditions
Parameter Adjustment: Optimize indicator settings and confluence requirements
Strategy Evolution: Develop new approaches based on market changes
Performance Benchmark: Compare against major currency indices and peers
Economic Event Calendar & High-Impact Scheduling
September 2025 Critical Events
Week 1 (September 1-5):
September 3: US ISM Manufacturing PMI (High Impact)
September 4: ECB Rate Decision (Medium Impact on USD/JPY)
September 5: US Initial Claims + Services PMI (Medium Impact)
September 6: US Non-Farm Payrolls (Very High Impact)
Week 2 (September 8-12):
September 10: US CPI Data (Very High Impact)
September 11: ECB Press Conference (Medium Impact)
September 12: US PPI Data (Medium Impact)
Week 3 (September 15-19):
September 17: FOMC Rate Decision (Very High Impact)
September 18: BoJ Policy Meeting (Extremely High Impact for JPY)
September 19: US Existing Home Sales (Low Impact)
Week 4 (September 22-26):
September 24: Global PMI Flash Estimates (Medium Impact)
September 25: US Durable Goods Orders (Medium Impact)
September 26: US GDP Preliminary (High Impact)
Event-Specific Trading Strategies
BoJ Meeting Strategy (September 18):
Pre-Event: Reduce positions by 70% due to intervention risk
Event Strategy:
Hawkish Surprise: Long JPY (short USD/JPY) immediately
Dovish/Status Quo: Monitor for verbal intervention threats
Intervention Announcement: Immediate short USD/JPY positioning
Post-Event: Wait for volatility to settle before major positioning
FOMC Strategy (September 17):
Pre-Event: Flat positions 2 hours before announcement
Dovish Fed: Bearish USD/JPY, target 144.50-145.50
Hawkish Fed: Bullish USD/JPY, target 149.50-151.20
Neutral Fed: Range trading strategy 146.00-148.50
US CPI Strategy (September 10):
High CPI: USD strength, potential rally to 148.50-149.50
Low CPI: USD weakness, potential decline to 145.50-146.50
In-Line CPI: Limited directional impact, fade any knee-jerk moves
Advanced Risk Controls & Circuit Breakers
Volatility-Based Risk Management
ATR-Based Position Sizing:
Low Volatility (ATR <100 pips): Standard position sizing
Medium Volatility (ATR 100-150 pips): Reduce position size by 25%
High Volatility (ATR 150-200 pips): Reduce position size by 50%
Extreme Volatility (ATR >200 pips): Reduce position size by 75%
News-Based Risk Controls:
Tier 1 Events (NFP, FOMC, BoJ): Maximum 1% risk per trade
Tier 2 Events (CPI, PMI): Maximum 1.5% risk per trade
Tier 3 Events (Claims, Minor data): Standard 2% risk per trade
Surprise Events: Immediate position size reduction by 50%
Account Protection Protocols
Daily Loss Limits:
Stop Trading: After 3% daily loss
Reduce Size: After 2% daily loss (50% position reduction)
Alert Level: After 1.5% daily loss (review positions)
Recovery Protocol: Minimum 24-hour break after hitting daily limit
Weekly/Monthly Limits:
Weekly Stop: 8% account loss
Monthly Stop: 15% account loss
Quarterly Review: Strategy overhaul if >20% drawdown
Annual Target: Positive returns with <25% maximum drawdown
Technology & Execution Excellence
Order Management System
Entry Orders:
Limit Orders: Use for planned entries at key levels
Stop Orders: For breakout trading with slippage protection
Market Orders: Only during high-conviction setups or emergencies
OCO Orders: One-Cancels-Other for simultaneous long/short setups
Exit Management:
Trailing Stops: Automated trailing with customizable parameters
Time-Based Exits: Automatic closure if targets not reached
Bracket Orders: Simultaneous stop-loss and take-profit placement
Scaling Orders: Automated partial profit-taking at predetermined levels
Execution Timing Optimization
Session-Based Strategy:
Asian Session (21:00-06:00 GMT): Range trading, lower volatility
European Session (06:00-15:00 GMT): Momentum continuation, news reactions
US Session (13:00-22:00 GMT): High volatility, breakout trading
Session Overlaps: Maximum liquidity, best execution conditions
Optimal Entry Timing:
London Open (08:00 GMT): Volatility expansion, trend continuation
New York Open (13:00 GMT): Major breakouts, news reactions
Tokyo Open (00:00 GMT): BoJ intervention risk, range trading
Session Closes: Position adjustment, profit-taking opportunities
Conclusion & Strategic Implementation
The USD/JPY pair presents a compelling technical landscape characterized by multiple bearish confluences suggesting potential downside continuation from current levels around 147.036. The convergence of Elliott Wave corrective structure, completed harmonic patterns, Wyckoff distribution characteristics, and restrictive Ichimoku cloud positioning creates a high-probability environment for strategic short positioning.
Primary Strategic Themes:
1. Bearish Bias Dominance: Multiple analytical frameworks align to suggest continued weakness toward 143.50-140.32 support cluster
2. Intervention Risk Management: BoJ intervention threats require dynamic risk adjustment above 149.50-150.00 levels
3. Range Trading Preparation: Extended consolidation between 141.67-154.20 remains possible alternative scenario
4. Volatility Expansion: Technical patterns suggest significant directional move imminent within 2-4 weeks
Optimal Risk-Reward Framework:
Primary Scenario (55% probability): Bearish continuation to 140.32-143.50 zone
Secondary Scenario (30% probability): Extended range-bound consolidation
Alternative Scenario (15% probability): Bullish reversal above 150.00
Critical Success Factors:
1. Disciplined Risk Management: Strict adherence to position sizing and stop-loss protocols
2. Multi-Timeframe Confirmation: Wait for alignment across various analytical methods
3. Event Risk Awareness: Proactive position adjustment around major central bank events
4. Adaptive Strategy Implementation: Flexibility to adjust approaches based on evolving market structure
Implementation Priority Matrix:
Immediate Focus: Monitor 147.25-148.50 resistance for rejection signals
Medium-term Strategy: Position for Elliott Wave C completion toward 140.32-143.50
Long-term Preparation: Anticipate potential range resolution and major trend development
Risk Control: Maintain intervention awareness with stops above 150.00-151.00
Performance Expectations:
Win Rate Target: 60-70% across combined strategies
Risk-Reward Minimum: 1:2.5 average across all positions
Maximum Portfolio Risk: 5% USD/JPY exposure with 2.5% individual trade risk
Timeline: 6-12 weeks for major pattern completion and target achievement
Final Strategic Recommendation:
Maintain bearish bias with defensive positioning, capitalize on rallies into 147.50-149.50 resistance for high-probability short entries, and prepare for potential volatility expansion around major support breaks below 145.50. Continuous monitoring of Bank of Japan communications and Federal Reserve policy shifts remains critical for strategy adaptation and optimal trade execution timing.
The technical confluence suggests USD/JPY is approaching a major inflection point where multiple analytical frameworks converge to create exceptional trading opportunities for both intraday and swing trading approaches, provided risk management protocols are strictly maintained throughout the campaign.
Risk Disclaimer: Currency trading involves substantial risk of loss and may not be suitable for all investors. Past performance is not indicative of future results. The analysis provided is for educational purposes and should not be considered as financial advice. Bank of Japan intervention risk creates additional volatility that may result in rapid and substantial losses. Traders should conduct independent analysis and consider their risk tolerance and investment objectives before executing any trading strategies based on this analysis.
I am nothing @shunya.trade
Disclaimer
The information and publications are not meant to be, and do not constitute, financial, investment, trading, or other types of advice or recommendations supplied or endorsed by TradingView. Read more in the Terms of Use.
I am nothing @shunya.trade
Disclaimer
The information and publications are not meant to be, and do not constitute, financial, investment, trading, or other types of advice or recommendations supplied or endorsed by TradingView. Read more in the Terms of Use.