USDT Dominance (USDT.D) – Daily Timeframe Analysis
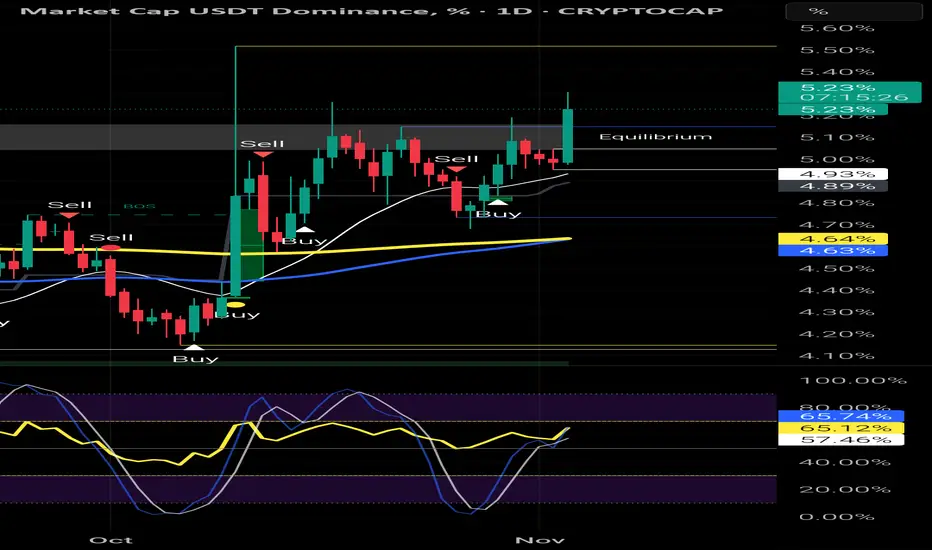
Current Value: 5.23%
Trend: Bullish breakout – Risk-off sentiment increasing
Technical Overview
USDT dominance has broken above the equilibrium zone (~5.00%), signaling capital flow into stablecoins — typically a bearish signal for BTC and the broader crypto market.
The strong bullish candle closing above both the 50 EMA (white) and 200 EMA (yellow) confirms the risk aversion among traders.
This aligns with the recent BTC/USDT drop toward the 106,500 USDT area, showing that money is rotating out of volatile assets (like BTC) into USDT.
Key Levels
Resistance Zone: 5.30% – 5.40% (recent highs / potential supply area)
Support Zone: 4.90% – 5.00% (former resistance turned support)
Major Support: 4.60% (EMA confluence + structure base)
Indicators
The Stochastic RSI is rising but not yet overbought (≈65%), suggesting there’s room for further upside in dominance.
Momentum favors USDT, meaning cryptocurrency prices may continue facing pressure until dominance peaks.
Market Implications
Rising USDT dominance → Bearish for BTC, ETH, and alts.
If USDT.D reaches 5.40% or higher, expect BTC to test the 104,000 – 102,000 USDT zone.
A rejection near 5.40% with a return below 5.00% could signal a relief rally for BTC.
Summary
USDT dominance is showing strong bullish momentum, reinforcing the current risk-off sentiment in the crypto market.
As long as dominance holds above 5.00%, expect continued downward pressure on BTC and altcoins.
Watch closely for exhaustion signals around 5.35% – 5.40% — that could be the first clue of a potential BTC rebound
Disclaimer
The information and publications are not meant to be, and do not constitute, financial, investment, trading, or other types of advice or recommendations supplied or endorsed by TradingView. Read more in the Terms of Use.
Disclaimer
The information and publications are not meant to be, and do not constitute, financial, investment, trading, or other types of advice or recommendations supplied or endorsed by TradingView. Read more in the Terms of Use.