Technical View – Usha Martin Ltd (Daily Chart)
Trend Identification:
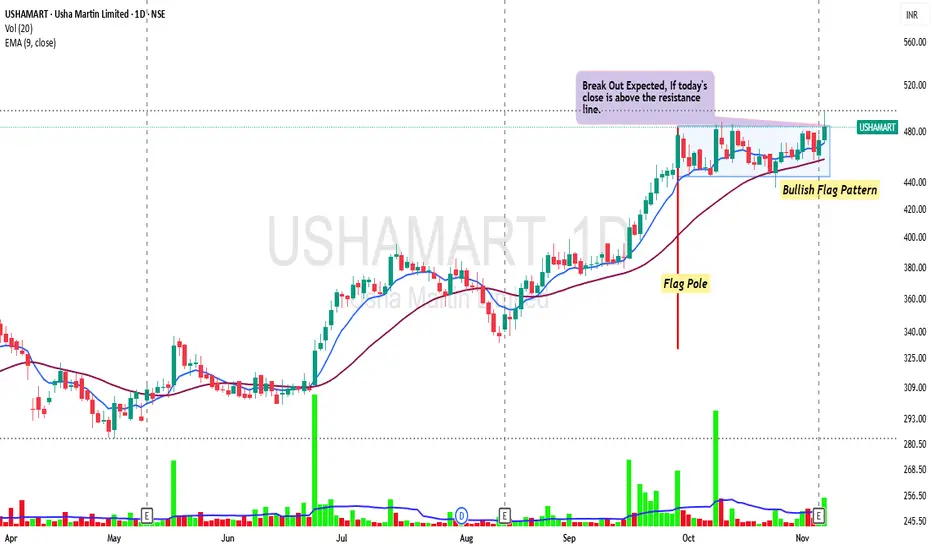
• The stock has been in a strong uptrend since July 2025, moving from around ₹330 to ₹490.
• Prices are consistently trading above the 9-day and 21-day EMAs, confirming bullish momentum.
Pattern Observation:
• After a sharp rally, the stock has entered a sideways consolidation phase between ₹450 and ₹490.
• This resembles a Flag Pattern, which usually forms as a pause in an existing uptrend before continuation.
Volume Analysis:
• Volume decreased during the consolidation phase, which is typical in a flag formation.
• A spike in volume near the upper boundary could confirm a breakout.
Indicator Analysis (EMA & RSI):
• EMA (9) is trending upward, showing continued buying interest.
• RSI is hovering around 60, indicating strength but not overbought.
Breakout Confirmation:
• A close above ₹495–₹500 with volume would confirm a bullish breakout from the flag pattern.
• Post-breakout targets could be around ₹580 (first target) and ₹650 (second target).
Support Zone:
• Immediate support lies near ₹455–₹460, where the lower boundary of the flag pattern is formed.
Disclaimer:
This analysis is for educational purposes only and not a buy/sell recommendation. Please do your own research or consult a financial advisor before investing.
Trend Identification:
• The stock has been in a strong uptrend since July 2025, moving from around ₹330 to ₹490.
• Prices are consistently trading above the 9-day and 21-day EMAs, confirming bullish momentum.
Pattern Observation:
• After a sharp rally, the stock has entered a sideways consolidation phase between ₹450 and ₹490.
• This resembles a Flag Pattern, which usually forms as a pause in an existing uptrend before continuation.
Volume Analysis:
• Volume decreased during the consolidation phase, which is typical in a flag formation.
• A spike in volume near the upper boundary could confirm a breakout.
Indicator Analysis (EMA & RSI):
• EMA (9) is trending upward, showing continued buying interest.
• RSI is hovering around 60, indicating strength but not overbought.
Breakout Confirmation:
• A close above ₹495–₹500 with volume would confirm a bullish breakout from the flag pattern.
• Post-breakout targets could be around ₹580 (first target) and ₹650 (second target).
Support Zone:
• Immediate support lies near ₹455–₹460, where the lower boundary of the flag pattern is formed.
Disclaimer:
This analysis is for educational purposes only and not a buy/sell recommendation. Please do your own research or consult a financial advisor before investing.
Disclaimer
The information and publications are not meant to be, and do not constitute, financial, investment, trading, or other types of advice or recommendations supplied or endorsed by TradingView. Read more in the Terms of Use.
Disclaimer
The information and publications are not meant to be, and do not constitute, financial, investment, trading, or other types of advice or recommendations supplied or endorsed by TradingView. Read more in the Terms of Use.