Bearish Outlook for Oil Prices: Fundamental and Technical Analysis
Fundamental Factors: Supply-Demand Mismatch
The slow global economic recovery, coupled with uncertainties such as trade frictions and tariff threats, has severely constrained economic growth. Although manufacturing in emerging economies has expanded, overall industrial production activity remains low, leading to limited growth in crude oil demand. Meanwhile, the rapid development and widespread adoption of new energy technologies are accelerating the transformation of the energy consumption structure. The popularization of electric vehicles and a significant increase in renewable energy installed capacity have continuously squeezed traditional fuel demand, drastically limiting the growth space for crude oil demand. In a scenario where supply increases but demand fails to rise synchronously, oil prices lack upward momentum and are more prone to a downward trend—this serves as a key basis for short-selling.
Technical Signals: Bearish Patterns Confirmed
1.Monthly Chart Pattern:The crude oil monthly chart has formed a descending triangle pattern and broken through its lower boundary, a technical formation typically regarded as a strong bearish signal. This indicates a high probability of a sustained downward oscillation in oil prices in the coming period.
2.Moving Average Trend:Short-term moving averages are gradually pressing down on long-term moving averages, forming a bearish alignment (short-term MA < medium-term MA < long-term MA). This pattern reinforces the dominance of bearish momentum.
3.MACD Indicator:The MACD line is trending below the zero axis, and the bearish momentum bars are gradually lengthening, signaling that bearish forces in the market are intensifying.
4.Relative Strength Index (RSI):The RSI value remains below 50, indicating that the market is in an overall weak state, with selling pressure outweighing buying interest. This further confirms the technical rationale for short positions.
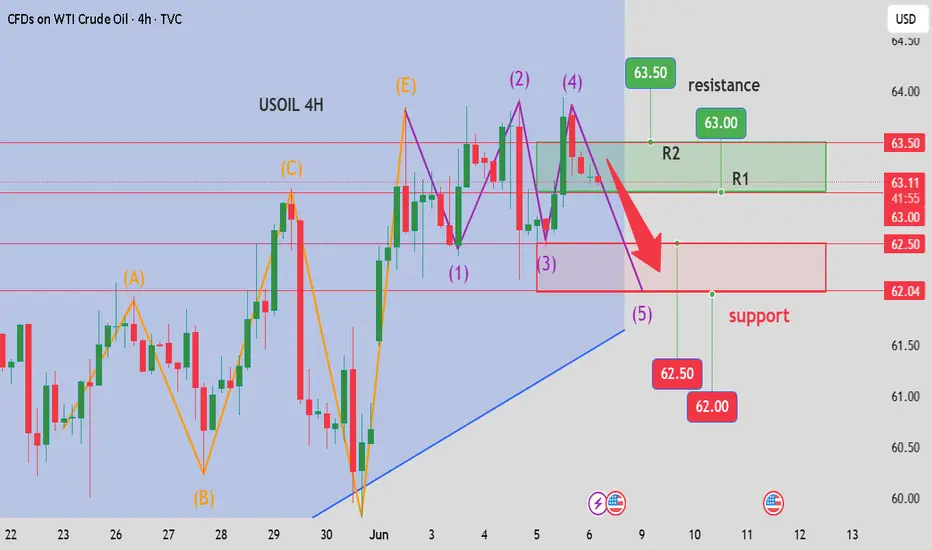
USOIL Today's Trading Strategy Hope this helps you
USOIL SELL@63.5~63
SL:64
TP:62.5~62
Fundamental Factors: Supply-Demand Mismatch
The slow global economic recovery, coupled with uncertainties such as trade frictions and tariff threats, has severely constrained economic growth. Although manufacturing in emerging economies has expanded, overall industrial production activity remains low, leading to limited growth in crude oil demand. Meanwhile, the rapid development and widespread adoption of new energy technologies are accelerating the transformation of the energy consumption structure. The popularization of electric vehicles and a significant increase in renewable energy installed capacity have continuously squeezed traditional fuel demand, drastically limiting the growth space for crude oil demand. In a scenario where supply increases but demand fails to rise synchronously, oil prices lack upward momentum and are more prone to a downward trend—this serves as a key basis for short-selling.
Technical Signals: Bearish Patterns Confirmed
1.Monthly Chart Pattern:The crude oil monthly chart has formed a descending triangle pattern and broken through its lower boundary, a technical formation typically regarded as a strong bearish signal. This indicates a high probability of a sustained downward oscillation in oil prices in the coming period.
2.Moving Average Trend:Short-term moving averages are gradually pressing down on long-term moving averages, forming a bearish alignment (short-term MA < medium-term MA < long-term MA). This pattern reinforces the dominance of bearish momentum.
3.MACD Indicator:The MACD line is trending below the zero axis, and the bearish momentum bars are gradually lengthening, signaling that bearish forces in the market are intensifying.
4.Relative Strength Index (RSI):The RSI value remains below 50, indicating that the market is in an overall weak state, with selling pressure outweighing buying interest. This further confirms the technical rationale for short positions.
USOIL Today's Trading Strategy Hope this helps you
USOIL SELL@63.5~63
SL:64
TP:62.5~62
Disclaimer
The information and publications are not meant to be, and do not constitute, financial, investment, trading, or other types of advice or recommendations supplied or endorsed by TradingView. Read more in the Terms of Use.
Disclaimer
The information and publications are not meant to be, and do not constitute, financial, investment, trading, or other types of advice or recommendations supplied or endorsed by TradingView. Read more in the Terms of Use.