On the daily timeframe, USOIL is in a clear downtrend.
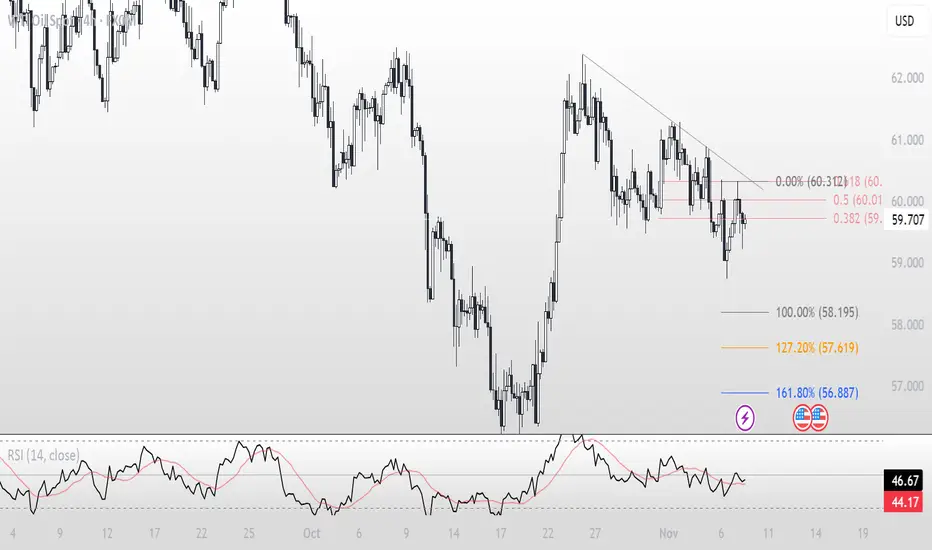
On the 4H timeframe, a bearish pattern has formed after breaking the previous low, followed by a corrective move up to the Fibonacci golden zone.
Bearish candles appeared in that area, indicating a possible continuation of the downtrend toward the downside targets.
Targets are shown on the chart — based on Fibonacci extension levels and a double top pattern.
Do you agree with this bearish setup?
Disclaimer
The information and publications are not meant to be, and do not constitute, financial, investment, trading, or other types of advice or recommendations supplied or endorsed by TradingView. Read more in the Terms of Use.
Disclaimer
The information and publications are not meant to be, and do not constitute, financial, investment, trading, or other types of advice or recommendations supplied or endorsed by TradingView. Read more in the Terms of Use.