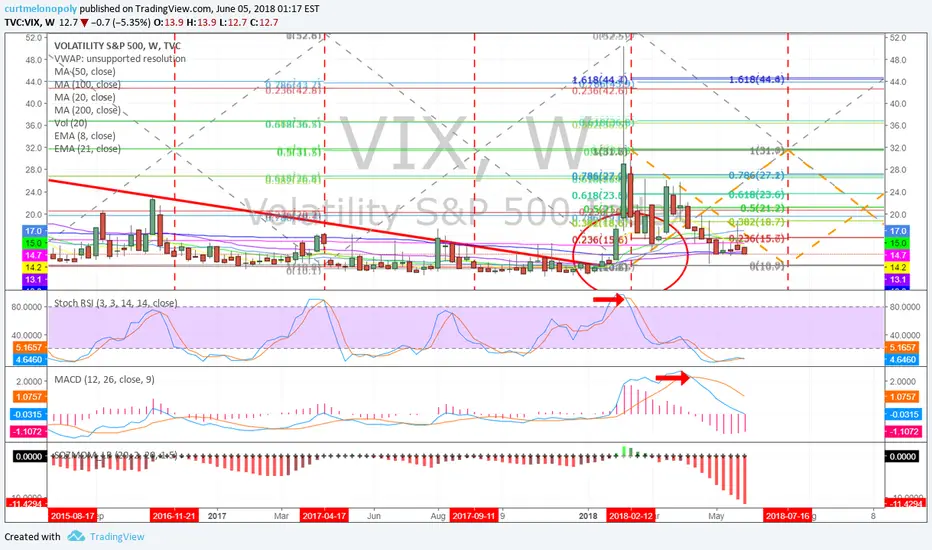
Volatility Index (VIX). Weekly chart suggests mid July time cycle peak could bring long side RR advantage soon. 216 AM June 5  VIX #chart #symmetry
Founder: EPIC Agentic AI | World's Best Autonomous Trading Software
dashboard.epicaitrader.com | epicaihub.io
Trading CL_F, NQ_F, BTC, ETH, SOL, TAO, SUI, XRP, Stock Basket
dashboard.epicaitrader.com | epicaihub.io
Trading CL_F, NQ_F, BTC, ETH, SOL, TAO, SUI, XRP, Stock Basket
Disclaimer
The information and publications are not meant to be, and do not constitute, financial, investment, trading, or other types of advice or recommendations supplied or endorsed by TradingView. Read more in the Terms of Use.