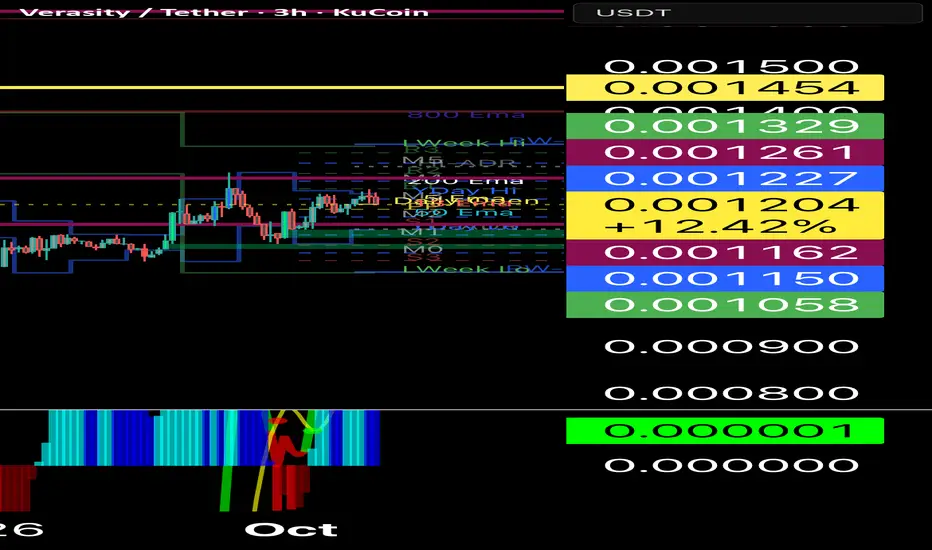
As of October 2, 2025, Verasity (
#### Overall Chart Structure and Technical Setup
On the daily and weekly timeframes (VRA/USDT and VRA/BTC pairs),
Technical indicators are mixed but leaning neutral to sell overall:
- **Oscillators (RSI, Stochastic, MACD):** Neutral, with recent sharp upside breaks in momentum indicators suggesting early bullish divergence. RSI (14) likely hovers around 40-50, not oversold but poised for a push above 50 on a breakout.
- **Moving Averages (MAs):** Strong sell signal currently, but
- **Other (CCI, PPO, Bull/Bear Power):** Show buy signals and hidden bullish divergences, supporting reversal potential.
The weekly chart shows a reversal candle with a bullish close, potentially ending the bearish cycle that's lasted over 1,100 days (nearly 3x the 2021 bull run duration). Against BTC,
#### Bullish Scenario
In a bullish case,
1. **Short-Term Breakout (1-4 Weeks):** Price consolidates in a demand zone around $0.0011-$0.0014, then breaks above $0.0015 (near EMA200/previous resistance). This could confirm a 5-wave Elliott impulse or harmonic completion, targeting 20-30% gains to $0.0018-$0.0020. Expect RSI to cross 60 and MACD histogram to flip positive for confirmation.
2. **Medium-Term Rally (1-3 Months):** If volume spikes and it clears $0.0020 (Fib 0.618 from recent highs), momentum could accelerate to $0.0025-$0.0035, a 100-200% move from current levels. This aligns with updated tokenomics acting as a catalyst, potentially mirroring the "surprise" upside seen in past cycles.
3. **Long-Term Bullish Wave (2025 Outlook):** Breaking $0.0082 confirms the end of the correction, targeting $0.025 (initial wave extension) or higher to $0.08 via harmonic patterns—yielding 2,000%+ upside. Optimistic forecasts see $0.0285 by year-end or even $0.0644 in a full altseason, though more conservative models cap at $0.0035 max. Risks include further unlocks (86.6 billion tokens still locked) dampening gains.
Key Levels to Watch
- **Support Levels:**
- Immediate: $0.00118 (24h low) – Critical hold for bullish invalidation.
- Major: $0.0010-$0.0012 – Multi-year bottom; breach could lead to retest of $0.0008 or lower.
- **Resistance Levels:**
- Near-Term: $0.0013-$0.0015 – Recent highs and EMA cluster; breakout here sparks short-term pump.
- Intermediate: $0.0020 – Fib resistance; clearing this opens $0.0025.
- Long-Term: $0.0082 – Key confirmation for bull market resumption.
Risks and Considerations
While the setup favors a bullish reversal if support holds,
Disclaimer
The information and publications are not meant to be, and do not constitute, financial, investment, trading, or other types of advice or recommendations supplied or endorsed by TradingView. Read more in the Terms of Use.
Disclaimer
The information and publications are not meant to be, and do not constitute, financial, investment, trading, or other types of advice or recommendations supplied or endorsed by TradingView. Read more in the Terms of Use.