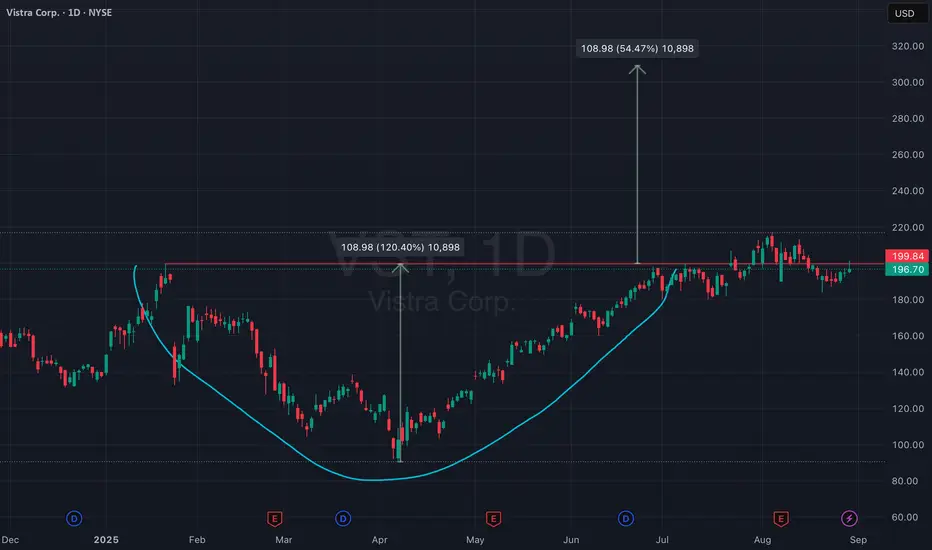
Vistra Corp. (VST) is forming a classic Cup and Handle pattern on the daily chart. The cup formation has developed over several months, with a clear resistance zone around $200 now being tested again.
A confirmed breakout above $200 could trigger the next leg up. Based on the measured move from the cup depth, the projected target sits around $310, offering a potential upside of +54% from the breakout point.
Key Levels:
• Breakout Entry: Above $200
• Target: $310
• Stop Loss: Below $185 (handle support)
This pattern signals a continuation of bullish momentum, especially if the breakout occurs on high volume.
Disclaimer
The information and publications are not meant to be, and do not constitute, financial, investment, trading, or other types of advice or recommendations supplied or endorsed by TradingView. Read more in the Terms of Use.
Disclaimer
The information and publications are not meant to be, and do not constitute, financial, investment, trading, or other types of advice or recommendations supplied or endorsed by TradingView. Read more in the Terms of Use.