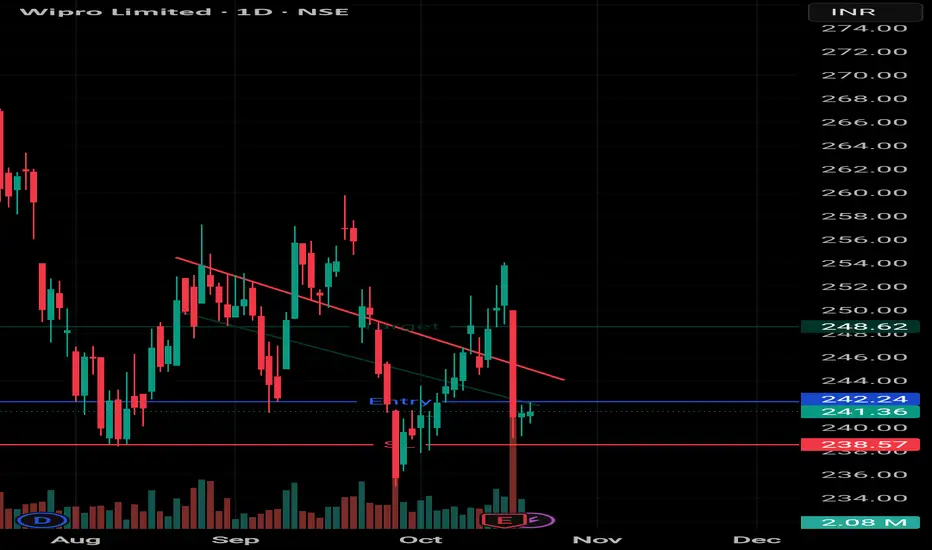
The latest price chart highlights a Falling Wedge pattern, a classic bullish formation that often signals the downtrend is losing strength and a breakout to the upside could be near. The stock has been consolidating within the wedge, and a breakout above the resistance line could confirm a strong upward move.
Disclaimer
The information and publications are not meant to be, and do not constitute, financial, investment, trading, or other types of advice or recommendations supplied or endorsed by TradingView. Read more in the Terms of Use.
Disclaimer
The information and publications are not meant to be, and do not constitute, financial, investment, trading, or other types of advice or recommendations supplied or endorsed by TradingView. Read more in the Terms of Use.