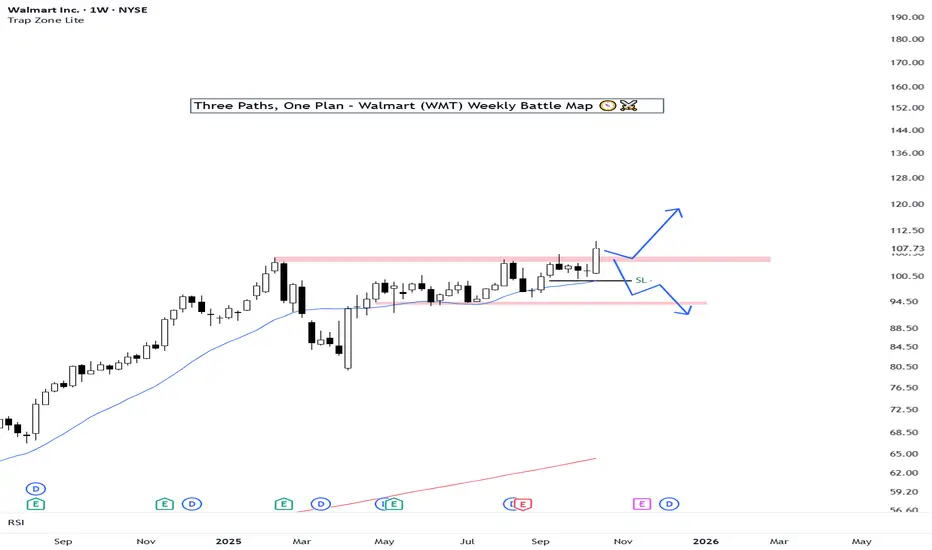
Walmart just broke to new all-time highs after building a strong base since February. This is a major technical moment — a clean structure that gives us three possible scenarios for the upcoming weeks:
🟢 Scenario 1 – Strong Breakout
Price keeps pushing higher with wide candles, confirming strength.
Plan: Stay long. Add on a clean retest of the pink zone if a color change confirms continuation.
Stop-Loss: Below the green line (~$101).
Target: $120–$125.
🟡 Scenario 2 – False Breakout / Loss of Momentum
If the next few candles stay small and the breakout fades, momentum dries up.
Plan: Reduce exposure or sell into a rebound to manage damage.
Defense Zone: $104–$105.
🔴 Scenario 3 – Stop & Reversal
If next week’s candle completely erases the breakout bar with a violent move, that triggers a reversal short.
Condition: Full candle wipeout with a close below the breakout body.
Target: Lower base of the range around $93 ±.
🎯 Final Take
As long as price holds above the pink zone ($105–$107), bias remains bullish.
Only a strong rejection and weekly close below $101 would confirm a reversal toward $93.
Shinobi Trading Lab – Indicators • Stats • Discipline
👉 Patreon: patreon.com/ShinobiTradingLab
👉 Patreon: patreon.com/ShinobiTradingLab
Disclaimer
The information and publications are not meant to be, and do not constitute, financial, investment, trading, or other types of advice or recommendations supplied or endorsed by TradingView. Read more in the Terms of Use.