This breakdown explains four recurring entry triggers that appear consistently across real market structure.
These are not indicators and not prediction tools. They are observable behaviors driven by liquidity, positioning, and trader psychology.
Each trigger is rooted in why price moves, not what price might do next.
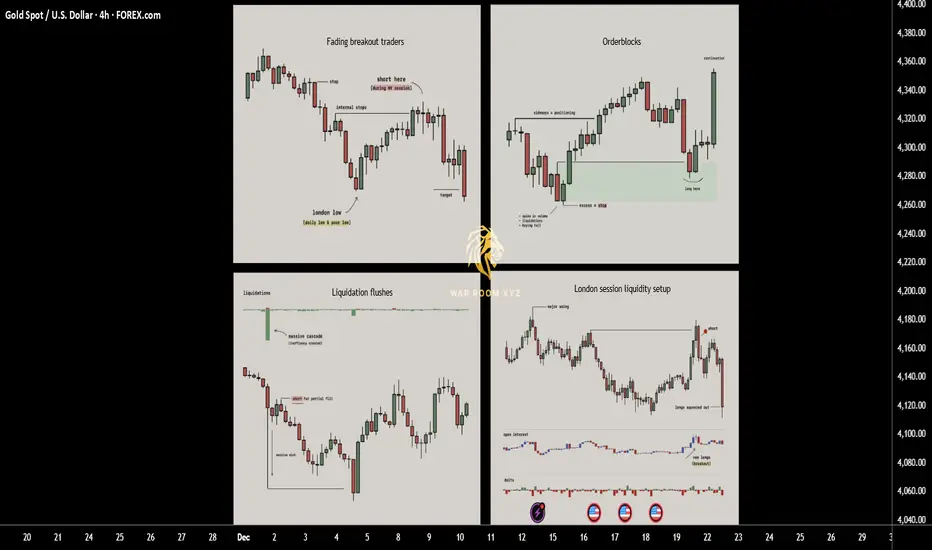
1. Fading breakout traders (Failed Momentum / Trap Model)
When price breaks a key level and open interest jumps, breakout traders rush in expecting continuation. If price quickly snaps back, those new traders become trapped and their exits fuel a move in the opposite direction. This creates one of the cleanest reversal triggers since you are trading directly against failed momentum.
►What usually happens
Markets frequently approach obvious highs, lows, or range boundaries where:
•Retail breakout traders anticipate continuation
•Algorithms and short-term momentum systems enter aggressively
•Open interest or volume often expands rapidly
At this moment, new positions are created late, directly into resistance or support.
►The key failure
If price:
•Breaks a key level
•Fails to hold acceptance beyond it
•Quickly closes back inside the prior range
Then the breakout has failed structurally.
This means:
•Buyers who entered above resistance are now trapped
•Sellers who entered below support are trapped
•Their exits (stops + panic closes) become fuel for the opposite move
►Why this works
Markets move efficiently when traders are positioned correctly.
They move violently when traders are positioned incorrectly.
A failed breakout converts hope-based positions into forced exits.
►Educational takeaway
You are not trading the level,
you are trading the failure of belief at the level.
This is why failed breakouts often produce:
•Fast reversals
•Clean directional candles
•Strong continuation after rejection
2. Liquidation flushes (Forced Exit & Rebalance Model)
Sharp liquidation events create long wicks and temporary price inefficiencies. Markets tend to rebalance after these shocks as liquidity returns, which is why these wicks often get filled quickly. This setup works well in volatile phases and near exhaustion points where forced selling or buying pushes price too far.
►What a liquidation flush is
A liquidation flush occurs when:
•Price moves aggressively in one direction
•Overleveraged positions are forcibly closed
•Stops and liquidations cascade simultaneously
This often creates:
•Long wicks
•One-sided impulsive candles
•Temporary price inefficiencies
Importantly, this move is not driven by new conviction, but by forced exits.
►What happens after
Once forced liquidations are complete:
•Selling or buying pressure rapidly decreases
•Liquidity returns to the market
•Price frequently retraces part or all of the wick
This retracement is not random
it is the market rebalancing after stress.
►Where flushes matter most
Liquidation flushes are most meaningful when they occur:
•Near prior highs/lows
•At range extremes
•After extended directional moves
•During high-volatility sessions
►Educational takeaway
A liquidation wick does not mean “strong trend”.
It often means the move is temporarily exhausted.
You are not trading momentum,
you are trading the absence of remaining pressure.
3. Orderblocks
Orderblocks are zones where previous heavy participation occurred, usually during sideways movements before a strong move away. When price revisits these levels, the same participants often defend the area, creating reliable reaction points. Clean pivots with no messy wicks are the strongest since they signal clear institutional activity.
►What an orderblock represents
Orderblocks are areas where:
•Large participants accumulated or distributed positions
•Price moved sideways briefly
•A strong directional move followed immediately after
This sideways phase exists because large players cannot enter all at once without moving price against themselves.
►Why orderblocks matter
•When price returns to these zones:
•Previous participants may still be active
•Unfilled orders may remain
•Defensive reactions are more likely than random continuation
Clean orderblocks typically show:
•Tight consolidation
•Minimal wicks
•Strong departure afterward
Messy structures often indicate mixed participation and weaker reactions.
►How orderblocks are used
Orderblocks are reaction zones, not signals.
They provide:
•Logical areas to expect interest
•Defined risk zones
•Context for entry triggers like wicks or failed breaks
►Educational takeaway
Orderblocks work because institutions remember their prices, even if retail traders forget them.
You are trading where participation previously mattered, not arbitrary support or resistance.
4. London session liquidity setup
London frequently sets the daily low or high early in the session. Later in the day price often returns to sweep internal liquidity around that level before continuing the trend. This repeatable behavior offers structured entries based on predictable liquidity grabs tied to session mechanics.
►Why London matters
The London session is:
•One of the highest liquidity windows globally
•Often responsible for setting the initial daily structure
•Heavily watched by institutions and algorithms
In many markets, London establishes:
•The daily high
•The daily low
Or a key internal liquidity level early in the session
►The repeatable behavior
Later in the day (often London continuation or New York):
•Price returns to that London high or low
•Sweeps internal liquidity around it
•Rejects after stops are collected
•Continues in the higher-timeframe direction
This is not coincidence,
it is session-based liquidity engineering.
►Why it works
Institutions prefer:
•Liquidity-rich entries
•Known pools of resting stops
•Session transitions for execution
London levels provide exactly that.
►Educational takeaway
Sessions are not just time zones,
they are liquidity cycles.
Understanding when liquidity is created is just as important as where.
How These Triggers Fit Together
These models are not standalone strategies.
They are contextual tools.
Very often:
•A London sweep causes a liquidation wick
•A failed breakout forms at an orderblock
•A liquidation flush completes a failed momentum move
The strongest setups occur when multiple triggers overlap, but each can stand alone as a learning framework.
Why These Triggers Work Long-Term
They work because they are based on:
• Trader positioning
• Forced behavior (stops, liquidations)
• Institutional execution constraints
• Repeating session mechanics
They do not rely on:
•Indicator crossovers
•Lagging calculations
•Pattern prediction
Price moves because someone is forced to act.
These triggers show where and why that happens.
These 4 triggers work because they exploit trapped traders, forced liquidations and consistent liquidity patterns rather than relying on indicators. Keep them simple, wait for clean context and let the setups come to you.
Note
These concepts are:
•Descriptive, not predictive
•Contextual, not mechanical
•Dependent on execution skill and risk management
The goal is not to trade more,
it is to wait for situations where the market gives you an advantage.
I have made a script which might help identify all 4 triggers.
https://www.tradingview.com/script/8MojiGwT-Liquidity-Entry-Triggers-4-Model-System-WarRoomXYZ/
Disclaimer
The script is provided for educational and informational purposes only.
It does not constitute financial advice, investment advice, or a recommendation to buy or sell any instrument.
The script does not execute trades, manage risk, or replace the need for trader discretion. Market behavior can change quickly, and past behavior detected by the script does not ensure similar future outcomes.
Users should test the script on demo or simulation environments before applying it to live markets and must maintain full responsibility for their own risk management, position sizing, and trade execution.
Trading involves risk, and losses can exceed deposits. By using the script, you acknowledge that you understand and accept all associated risks.
These are not indicators and not prediction tools. They are observable behaviors driven by liquidity, positioning, and trader psychology.
Each trigger is rooted in why price moves, not what price might do next.
1. Fading breakout traders (Failed Momentum / Trap Model)
When price breaks a key level and open interest jumps, breakout traders rush in expecting continuation. If price quickly snaps back, those new traders become trapped and their exits fuel a move in the opposite direction. This creates one of the cleanest reversal triggers since you are trading directly against failed momentum.
►What usually happens
Markets frequently approach obvious highs, lows, or range boundaries where:
•Retail breakout traders anticipate continuation
•Algorithms and short-term momentum systems enter aggressively
•Open interest or volume often expands rapidly
At this moment, new positions are created late, directly into resistance or support.
►The key failure
If price:
•Breaks a key level
•Fails to hold acceptance beyond it
•Quickly closes back inside the prior range
Then the breakout has failed structurally.
This means:
•Buyers who entered above resistance are now trapped
•Sellers who entered below support are trapped
•Their exits (stops + panic closes) become fuel for the opposite move
►Why this works
Markets move efficiently when traders are positioned correctly.
They move violently when traders are positioned incorrectly.
A failed breakout converts hope-based positions into forced exits.
►Educational takeaway
You are not trading the level,
you are trading the failure of belief at the level.
This is why failed breakouts often produce:
•Fast reversals
•Clean directional candles
•Strong continuation after rejection
2. Liquidation flushes (Forced Exit & Rebalance Model)
Sharp liquidation events create long wicks and temporary price inefficiencies. Markets tend to rebalance after these shocks as liquidity returns, which is why these wicks often get filled quickly. This setup works well in volatile phases and near exhaustion points where forced selling or buying pushes price too far.
►What a liquidation flush is
A liquidation flush occurs when:
•Price moves aggressively in one direction
•Overleveraged positions are forcibly closed
•Stops and liquidations cascade simultaneously
This often creates:
•Long wicks
•One-sided impulsive candles
•Temporary price inefficiencies
Importantly, this move is not driven by new conviction, but by forced exits.
►What happens after
Once forced liquidations are complete:
•Selling or buying pressure rapidly decreases
•Liquidity returns to the market
•Price frequently retraces part or all of the wick
This retracement is not random
it is the market rebalancing after stress.
►Where flushes matter most
Liquidation flushes are most meaningful when they occur:
•Near prior highs/lows
•At range extremes
•After extended directional moves
•During high-volatility sessions
►Educational takeaway
A liquidation wick does not mean “strong trend”.
It often means the move is temporarily exhausted.
You are not trading momentum,
you are trading the absence of remaining pressure.
3. Orderblocks
Orderblocks are zones where previous heavy participation occurred, usually during sideways movements before a strong move away. When price revisits these levels, the same participants often defend the area, creating reliable reaction points. Clean pivots with no messy wicks are the strongest since they signal clear institutional activity.
►What an orderblock represents
Orderblocks are areas where:
•Large participants accumulated or distributed positions
•Price moved sideways briefly
•A strong directional move followed immediately after
This sideways phase exists because large players cannot enter all at once without moving price against themselves.
►Why orderblocks matter
•When price returns to these zones:
•Previous participants may still be active
•Unfilled orders may remain
•Defensive reactions are more likely than random continuation
Clean orderblocks typically show:
•Tight consolidation
•Minimal wicks
•Strong departure afterward
Messy structures often indicate mixed participation and weaker reactions.
►How orderblocks are used
Orderblocks are reaction zones, not signals.
They provide:
•Logical areas to expect interest
•Defined risk zones
•Context for entry triggers like wicks or failed breaks
►Educational takeaway
Orderblocks work because institutions remember their prices, even if retail traders forget them.
You are trading where participation previously mattered, not arbitrary support or resistance.
4. London session liquidity setup
London frequently sets the daily low or high early in the session. Later in the day price often returns to sweep internal liquidity around that level before continuing the trend. This repeatable behavior offers structured entries based on predictable liquidity grabs tied to session mechanics.
►Why London matters
The London session is:
•One of the highest liquidity windows globally
•Often responsible for setting the initial daily structure
•Heavily watched by institutions and algorithms
In many markets, London establishes:
•The daily high
•The daily low
Or a key internal liquidity level early in the session
►The repeatable behavior
Later in the day (often London continuation or New York):
•Price returns to that London high or low
•Sweeps internal liquidity around it
•Rejects after stops are collected
•Continues in the higher-timeframe direction
This is not coincidence,
it is session-based liquidity engineering.
►Why it works
Institutions prefer:
•Liquidity-rich entries
•Known pools of resting stops
•Session transitions for execution
London levels provide exactly that.
►Educational takeaway
Sessions are not just time zones,
they are liquidity cycles.
Understanding when liquidity is created is just as important as where.
How These Triggers Fit Together
These models are not standalone strategies.
They are contextual tools.
Very often:
•A London sweep causes a liquidation wick
•A failed breakout forms at an orderblock
•A liquidation flush completes a failed momentum move
The strongest setups occur when multiple triggers overlap, but each can stand alone as a learning framework.
Why These Triggers Work Long-Term
They work because they are based on:
• Trader positioning
• Forced behavior (stops, liquidations)
• Institutional execution constraints
• Repeating session mechanics
They do not rely on:
•Indicator crossovers
•Lagging calculations
•Pattern prediction
Price moves because someone is forced to act.
These triggers show where and why that happens.
These 4 triggers work because they exploit trapped traders, forced liquidations and consistent liquidity patterns rather than relying on indicators. Keep them simple, wait for clean context and let the setups come to you.
Note
These concepts are:
•Descriptive, not predictive
•Contextual, not mechanical
•Dependent on execution skill and risk management
The goal is not to trade more,
it is to wait for situations where the market gives you an advantage.
I have made a script which might help identify all 4 triggers.
https://www.tradingview.com/script/8MojiGwT-Liquidity-Entry-Triggers-4-Model-System-WarRoomXYZ/
Disclaimer
The script is provided for educational and informational purposes only.
It does not constitute financial advice, investment advice, or a recommendation to buy or sell any instrument.
The script does not execute trades, manage risk, or replace the need for trader discretion. Market behavior can change quickly, and past behavior detected by the script does not ensure similar future outcomes.
Users should test the script on demo or simulation environments before applying it to live markets and must maintain full responsibility for their own risk management, position sizing, and trade execution.
Trading involves risk, and losses can exceed deposits. By using the script, you acknowledge that you understand and accept all associated risks.
⚔️ Markets reward discipline, not hope.
WarRoomXYZ trades liquidity, structure, and timing with predefined risk and zero emotion.
If you chase price, you are the liquidity.
Prepare. Execute. Survive.
t.me/warroomxyz
WarRoomXYZ trades liquidity, structure, and timing with predefined risk and zero emotion.
If you chase price, you are the liquidity.
Prepare. Execute. Survive.
t.me/warroomxyz
Disclaimer
The information and publications are not meant to be, and do not constitute, financial, investment, trading, or other types of advice or recommendations supplied or endorsed by TradingView. Read more in the Terms of Use.