✅ From the 4-hour chart, gold experienced a strong rebound yesterday, releasing some short-term bullish momentum. However, the price encountered significant resistance near 4132 (previous high + upper Bollinger Band).
The latest candle shows a large bearish candle with a long upper wick, which is a classic signal of bulls failing to break higher and profit-taking pressure intensifying.
MA5 and MA10 have started to turn downward, indicating weakening short-term momentum.
MA20 (around 4089) still provides partial support, but it has already been broken through quickly.
The upper Bollinger Band (around 4130) remains a strong resistance level, with price quickly falling below the mid-band after the spike.
The lower wick touched 4055, suggesting that short-term buying interest exists in this area.
The short-term rebound structure has been damaged, and the 4-hour timeframe has entered a corrective phase turning weaker again.
If gold breaks below 4058–4050, bearish momentum will strengthen further.
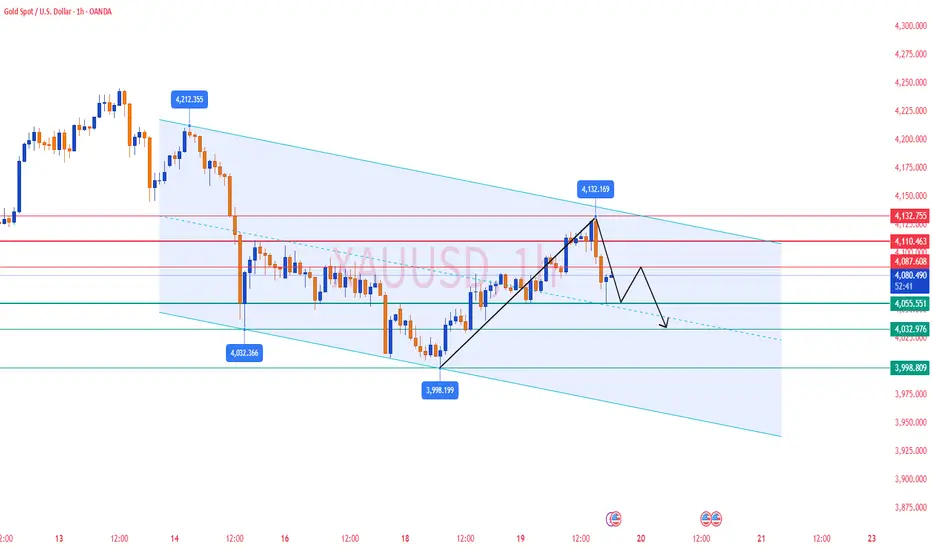
✅ On the 1-hour chart, gold formed a short-term high at 4132, followed by a sharp sell-off.
Two consecutive large bearish candles broke below MA5 / MA10 / MA20 / MA60, forming a classic one-sided reversal signal.
The bullish structure is completely broken, and moving averages have shifted back into a bearish alignment.
Key support lies at 4050–4049, a strong confluence support zone. Breaking below this area will open further downside potential.
The current small rebound is weak and only a technical correction, showing that bears still dominate the short-term price action.
The rebound only reached below MA20 (around 4085), showing that selling pressure above remains strong.
Short-term structure is bearish, and any weak rebound is unlikely to break above 4085–4090. After the rebound, price is still likely to retest the 4050 area.
🔴 Resistance Levels:4085–4090 / 4100–4110 / 4125–4132
🟢 Support Levels:4058–4050 / 4030 / 3998
✅ Trading Strategy Reference
🔰 Strategy 1: Short at 4085–4090 (Main Idea)
If gold rebounds to 4085–4090 and shows resistance:
Light short positions
Stop-loss: 4098
Targets: 4060 / 4050
👉 Current trend is bearish; selling rebounds is the main logic.
🔰 Strategy 2: Short again at strong resistance (Aggressive Short)
If gold rebounds to 4100–4110:
Medium-sized short positions
Stop-loss: 4118
Targets: 4065 / 4050
👉 This area is strong resistance; short-term breakout probability is low.
🔰 Strategy 3: Breakout shorts below 4050 (Trend-following)
If price breaks 4050:
Bearish momentum will accelerate
Targets: 4030 / 4000
👉 4050 is the key level determining whether bears will continue the downward move.
📌 Summary
4H rebound was rejected; structure turning weaker
1H shows a sharp breakdown; bears dominate short-term price action
4085–4090 is the main zone for selling rebounds
4050 is the most important support today—breaking it will open deeper downside
The latest candle shows a large bearish candle with a long upper wick, which is a classic signal of bulls failing to break higher and profit-taking pressure intensifying.
MA5 and MA10 have started to turn downward, indicating weakening short-term momentum.
MA20 (around 4089) still provides partial support, but it has already been broken through quickly.
The upper Bollinger Band (around 4130) remains a strong resistance level, with price quickly falling below the mid-band after the spike.
The lower wick touched 4055, suggesting that short-term buying interest exists in this area.
The short-term rebound structure has been damaged, and the 4-hour timeframe has entered a corrective phase turning weaker again.
If gold breaks below 4058–4050, bearish momentum will strengthen further.
✅ On the 1-hour chart, gold formed a short-term high at 4132, followed by a sharp sell-off.
Two consecutive large bearish candles broke below MA5 / MA10 / MA20 / MA60, forming a classic one-sided reversal signal.
The bullish structure is completely broken, and moving averages have shifted back into a bearish alignment.
Key support lies at 4050–4049, a strong confluence support zone. Breaking below this area will open further downside potential.
The current small rebound is weak and only a technical correction, showing that bears still dominate the short-term price action.
The rebound only reached below MA20 (around 4085), showing that selling pressure above remains strong.
Short-term structure is bearish, and any weak rebound is unlikely to break above 4085–4090. After the rebound, price is still likely to retest the 4050 area.
🔴 Resistance Levels:4085–4090 / 4100–4110 / 4125–4132
🟢 Support Levels:4058–4050 / 4030 / 3998
✅ Trading Strategy Reference
🔰 Strategy 1: Short at 4085–4090 (Main Idea)
If gold rebounds to 4085–4090 and shows resistance:
Light short positions
Stop-loss: 4098
Targets: 4060 / 4050
👉 Current trend is bearish; selling rebounds is the main logic.
🔰 Strategy 2: Short again at strong resistance (Aggressive Short)
If gold rebounds to 4100–4110:
Medium-sized short positions
Stop-loss: 4118
Targets: 4065 / 4050
👉 This area is strong resistance; short-term breakout probability is low.
🔰 Strategy 3: Breakout shorts below 4050 (Trend-following)
If price breaks 4050:
Bearish momentum will accelerate
Targets: 4030 / 4000
👉 4050 is the key level determining whether bears will continue the downward move.
📌 Summary
4H rebound was rejected; structure turning weaker
1H shows a sharp breakdown; bears dominate short-term price action
4085–4090 is the main zone for selling rebounds
4050 is the most important support today—breaking it will open deeper downside
✅ 𝐃𝐚𝐢𝐥𝐲 𝟐-𝟒 𝐓𝐫𝐚𝐝𝐢𝐧𝐠 𝐒𝐢𝐠𝐧𝐚𝐥𝐬 🔥
✅ 𝐇𝐢𝐠𝐡 𝐀𝐜𝐜𝐮𝐫𝐚𝐜𝐲 𝟗𝟎%-𝟗𝟓% 🔥
✅ 𝐌𝐨𝐧𝐭𝐡𝐥𝐲 𝐏𝐫𝐨𝐟𝐢𝐭 𝟑𝟓𝟎𝟎 𝐏𝐈𝐏𝐒 🔥
💎 𝐏𝐫𝐨𝐟𝐞𝐬𝐬𝐢𝐨𝐧𝐚𝐥 𝐅𝐫𝐞𝐞 𝐆𝐫𝐨𝐮𝐩:t.me/+YgFaky2XQ7ViYWE9
✅ 𝐇𝐢𝐠𝐡 𝐀𝐜𝐜𝐮𝐫𝐚𝐜𝐲 𝟗𝟎%-𝟗𝟓% 🔥
✅ 𝐌𝐨𝐧𝐭𝐡𝐥𝐲 𝐏𝐫𝐨𝐟𝐢𝐭 𝟑𝟓𝟎𝟎 𝐏𝐈𝐏𝐒 🔥
💎 𝐏𝐫𝐨𝐟𝐞𝐬𝐬𝐢𝐨𝐧𝐚𝐥 𝐅𝐫𝐞𝐞 𝐆𝐫𝐨𝐮𝐩:t.me/+YgFaky2XQ7ViYWE9
Disclaimer
The information and publications are not meant to be, and do not constitute, financial, investment, trading, or other types of advice or recommendations supplied or endorsed by TradingView. Read more in the Terms of Use.