Technical Analysis: Resonant Supports + Stabilized Patterns, Clear Rebound Signals
(I) Key Price Levels & Structural Supports
$4,080 boasts three layers of technical support simultaneously: first, the critical support of the 20-day moving average, which has successfully stabilized after multiple tests; second, the 38.2% Fibonacci retracement level of the August-October uptrend, falling within a reasonable pullback range after a strong rally; third, the lower edge of the previous $4,100-$4,130 consolidation platform, where market trading is dense with robust buying absorption. The strong support below is $4,050 (the middle band of the daily Bollinger Bands), and in extreme cases, it may pull back to the $4,000 psychological level. Overall, the pullback space is limited, with the upside risk-reward ratio superior to the downside.
--------------------------------------------------------------------------------
(II) Volume & Indicator Verification
During the gold price pullback from $4,140 to $4,080, trading volume continued to shrink. The 1-hour volume dropped by more than 50% compared to the rally period, indicating limited selling pressure and a healthy technical pullback.The daily RSI indicator remains in the neutral-to-strong range of 50, not entering the oversold zone. The MACD lines are still above the zero axis, and although the red bars have contracted, no death cross has formed, maintaining the intact long-term upward structure.On the weekly chart, the MACD red bars are moderately expanding, and the RSI shows no bearish divergence—confirming that the medium-to-long-term uptrend remains unchanged, with the short-term pullback merely a correction within the trend.
--------------------------------------------------------------------------------
(III) Distribution of Resistance Levels
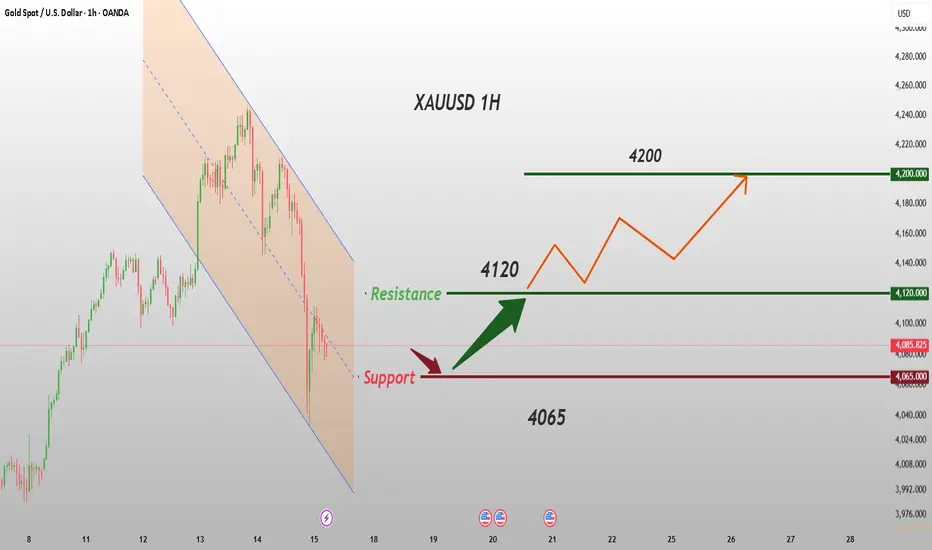
The first resistance above is $4,130 (the upper edge of the previous consolidation platform + 23.6% Fibonacci retracement level). The second resistance is the $4,180-$4,200 range (psychological level + upper track of the ascending channel). A breakthrough above $4,130 will open up a smooth upward space.
Next week's gold trading strategy
buy:4065-4075
tp:4085-4100-4120
sl:4055
(I) Key Price Levels & Structural Supports
$4,080 boasts three layers of technical support simultaneously: first, the critical support of the 20-day moving average, which has successfully stabilized after multiple tests; second, the 38.2% Fibonacci retracement level of the August-October uptrend, falling within a reasonable pullback range after a strong rally; third, the lower edge of the previous $4,100-$4,130 consolidation platform, where market trading is dense with robust buying absorption. The strong support below is $4,050 (the middle band of the daily Bollinger Bands), and in extreme cases, it may pull back to the $4,000 psychological level. Overall, the pullback space is limited, with the upside risk-reward ratio superior to the downside.
--------------------------------------------------------------------------------
(II) Volume & Indicator Verification
During the gold price pullback from $4,140 to $4,080, trading volume continued to shrink. The 1-hour volume dropped by more than 50% compared to the rally period, indicating limited selling pressure and a healthy technical pullback.The daily RSI indicator remains in the neutral-to-strong range of 50, not entering the oversold zone. The MACD lines are still above the zero axis, and although the red bars have contracted, no death cross has formed, maintaining the intact long-term upward structure.On the weekly chart, the MACD red bars are moderately expanding, and the RSI shows no bearish divergence—confirming that the medium-to-long-term uptrend remains unchanged, with the short-term pullback merely a correction within the trend.
--------------------------------------------------------------------------------
(III) Distribution of Resistance Levels
The first resistance above is $4,130 (the upper edge of the previous consolidation platform + 23.6% Fibonacci retracement level). The second resistance is the $4,180-$4,200 range (psychological level + upper track of the ascending channel). A breakthrough above $4,130 will open up a smooth upward space.
Next week's gold trading strategy
buy:4065-4075
tp:4085-4100-4120
sl:4055
Disclaimer
The information and publications are not meant to be, and do not constitute, financial, investment, trading, or other types of advice or recommendations supplied or endorsed by TradingView. Read more in the Terms of Use.
Disclaimer
The information and publications are not meant to be, and do not constitute, financial, investment, trading, or other types of advice or recommendations supplied or endorsed by TradingView. Read more in the Terms of Use.