In this tutorial, I explain how to use chart patterns in a structured and high-probability way, focusing on confirmation, market logic, and clean execution.
WHAT IS A CHART PATTERN?
A chart pattern is a visual representation of price behavior that forms due to market psychology, supply and demand, and repeated trader reactions.
Chart patterns help identify potential continuations or reversals when confirmed correctly.
CHART PATTERNS COVERED IN THIS TUTORIAL
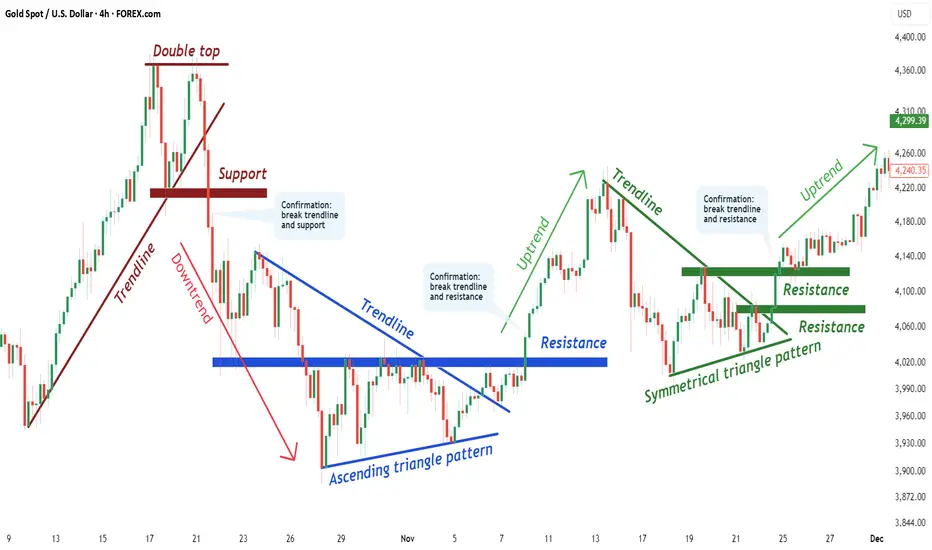
1.) Double Top
2.) Ascending Triangle Pattern
3.) Symmetrical Triangle Pattern
WHAT IS A DOUBLE TOP?
A Double Top is a bearish reversal pattern formed after an uptrend.
Price fails to break a resistance level twice, signaling buyer exhaustion and a potential shift in control from buyers to sellers.
WHAT IS AN ASCENDING TRIANGLE PATTERN?
An Ascending Triangle is a bullish continuation pattern characterized by higher lows pressing against a flat resistance level.
It reflects increasing buyer strength and often leads to a breakout once resistance is broken with confirmation.
WHAT IS A SYMMETRICAL TRIANGLE PATTERN?
A Symmetrical Triangle represents consolidation, where higher lows and lower highs compress price action.
The breakout direction defines the next impulsive move once volatility expands.
GENERAL STEP-BY-STEP PROCESS
1.) Identify the chart pattern on the chart
(Unconfirmed structure forming)
2.) Draw the key trendlines and neckline
(Support and resistance define structure validity)
3.) Wait for a break of BOTH the trendline and the neckline
(This confirms the chart pattern)
4.) Move to a lower timeframe and look for an entry
(Trade in the direction of the confirmed breakout using clean price action)
If you want PART 2, leave a like and a comment.
Follow for high-quality trading education and clean technical logic.
DISCLAIMER
This content is for educational purposes only and does not constitute financial advice.
Trading involves risk. Always conduct your own analysis.
I am not responsible for any decisions or losses based on this material.
WHAT IS A CHART PATTERN?
A chart pattern is a visual representation of price behavior that forms due to market psychology, supply and demand, and repeated trader reactions.
Chart patterns help identify potential continuations or reversals when confirmed correctly.
CHART PATTERNS COVERED IN THIS TUTORIAL
1.) Double Top
2.) Ascending Triangle Pattern
3.) Symmetrical Triangle Pattern
WHAT IS A DOUBLE TOP?
A Double Top is a bearish reversal pattern formed after an uptrend.
Price fails to break a resistance level twice, signaling buyer exhaustion and a potential shift in control from buyers to sellers.
WHAT IS AN ASCENDING TRIANGLE PATTERN?
An Ascending Triangle is a bullish continuation pattern characterized by higher lows pressing against a flat resistance level.
It reflects increasing buyer strength and often leads to a breakout once resistance is broken with confirmation.
WHAT IS A SYMMETRICAL TRIANGLE PATTERN?
A Symmetrical Triangle represents consolidation, where higher lows and lower highs compress price action.
The breakout direction defines the next impulsive move once volatility expands.
GENERAL STEP-BY-STEP PROCESS
1.) Identify the chart pattern on the chart
(Unconfirmed structure forming)
2.) Draw the key trendlines and neckline
(Support and resistance define structure validity)
3.) Wait for a break of BOTH the trendline and the neckline
(This confirms the chart pattern)
4.) Move to a lower timeframe and look for an entry
(Trade in the direction of the confirmed breakout using clean price action)
If you want PART 2, leave a like and a comment.
Follow for high-quality trading education and clean technical logic.
DISCLAIMER
This content is for educational purposes only and does not constitute financial advice.
Trading involves risk. Always conduct your own analysis.
I am not responsible for any decisions or losses based on this material.
Related publications
Disclaimer
The information and publications are not meant to be, and do not constitute, financial, investment, trading, or other types of advice or recommendations supplied or endorsed by TradingView. Read more in the Terms of Use.
Related publications
Disclaimer
The information and publications are not meant to be, and do not constitute, financial, investment, trading, or other types of advice or recommendations supplied or endorsed by TradingView. Read more in the Terms of Use.