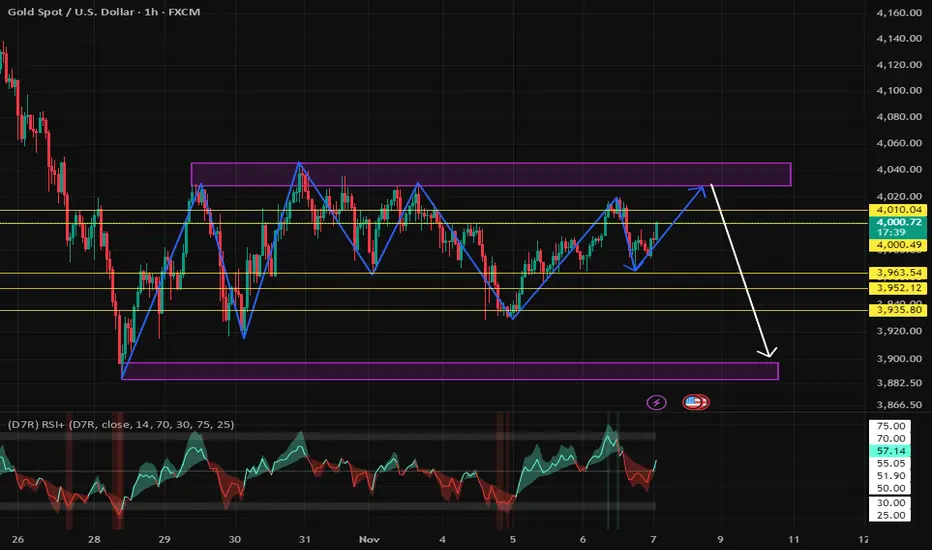
Gold has been trading within a range for eight trading days. On the daily chart, the 10-day and 7-day moving averages are flat, and the RSI indicator is adjusting towards the midline. On the 4-hour and 1-hour charts, the Bollinger Bands are narrowing, with the price hovering around the middle band. Currently, the short-term moving averages are turning downwards, and the MACD indicator is showing a death cross signal, but it's getting closer to the zero line, so a continuation of the sideways movement cannot be ruled out.
The large-scale daily range is locked at 4050-3900. Without breaking out of this range, a clear trend is unlikely. My current view is that a break above 4050 is insufficient for a bullish outlook, while a break below 3900 would indicate a significant decline. Both bulls and bears lack sustained momentum. We have consistently emphasized that gold is currently in a consolidation phase. Don't assume a major bullish surge or trend reversal just because there's a rebound. It's still in a sideways consolidation phase, and the overall center of gravity is still shifting downwards! The trading strategy is to buy low and sell high!
Key Levels:
First Support: 3963, Second Support: 3952, Third Support: 3936
First Resistance: 4000, Second Resistance: 4010, Third Resistance: 4028
Gold Trading Strategy:
Buy: 3960-3965, SL: 3950, TP: 3980-3990;
Sell: 4035-4040, SL: 4050, TP: 4020-4010;
More Analysis →
More free daily updates of signals and analysis
✅Gold Trading Knowledge Camp
💥Welcome to my Telegram channel: t.me/JungoldAnalyst
✅Gold Trading Knowledge Camp
💥Welcome to my Telegram channel: t.me/JungoldAnalyst
Disclaimer
The information and publications are not meant to be, and do not constitute, financial, investment, trading, or other types of advice or recommendations supplied or endorsed by TradingView. Read more in the Terms of Use.
