Gold Market In-Depth Analysis | Driven by risk aversion and expectations of rate cuts, gold prices aim for $4,000 🚀
Core Market Overview 📈
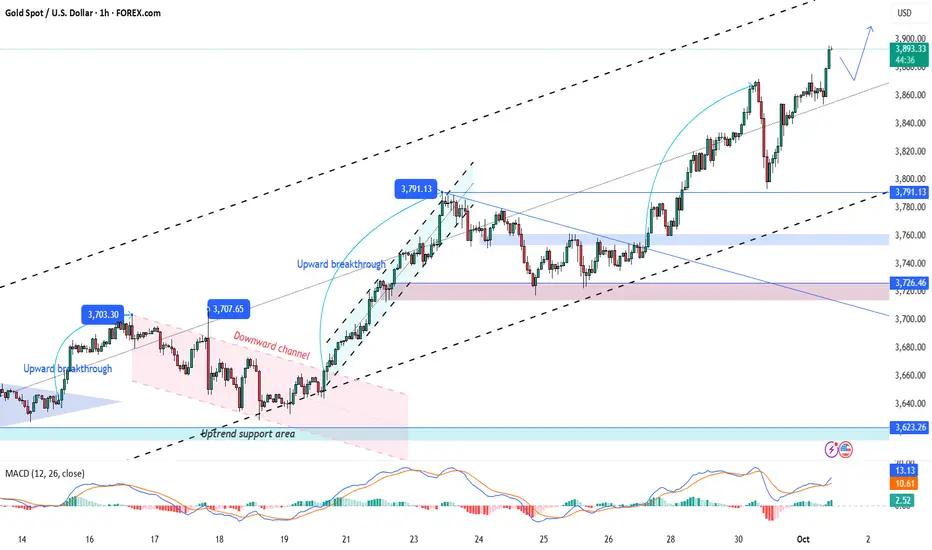
Spot gold continued its strong performance on Wednesday (October 1st), hitting a new all-time high near $3,900 and holding steady around $3,890 during the European session. Since the beginning of 2025, the price has risen by over 45%, with double-digit gains in September alone, demonstrating a rare upward trend in recent years. 💹
Fundamentals in-depth Analysis 🔍
1. 🛡️ Safe-haven demand continues to build
Geopolitical risks: The Russia-Ukraine conflict has escalated again, and tensions remain high in the Middle East and Eastern Europe.
US Government Shutdown Crisis: The Republican spending bill has stalled in the Senate, raising the risk of a partial government shutdown in early October. Historical data shows that shutdowns last an average of eight days (with a maximum of 35 days). If the deadlock persists, it will drag down GDP and dampen business investment.
2. 💰 Monetary Policy Expectations Support
High Probability of Rate Cuts: CME interest rate futures indicate a near 95% probability of an October rate cut and over 75% probability of another December rate cut.
Economic Data Signals: JOLTS job vacancies fell to 7.22 million (below expectations), initial jobless claims rose, and signs of a slowing labor market reinforce the case for easing.
US Dollar and Interest Rate Environment: The US dollar index fell below key moving averages for four consecutive days, while long-term real interest rates remained low, reducing the cost of holding gold.
3. 🏦 Solid Structural Buying
Central bank gold purchases and ETF inflows provide underlying support. Market concerns about US Treasury risks and inflationary stickiness are driving continued allocations to gold.
Technical analysis from multiple dimensions 📊
1. Trend structure ↗️
The daily line is running strongly along the upper track of the Bollinger Band, forming a standard rising channel (upper track 3906/middle track 3647/lower track 3389);
The previous key pressure of 3750 turned into support after breaking through, becoming the primary line of defense for short-term correction.
2. Indicator signal 🎯
MACD: The fast and slow lines maintain a golden cross (98.15/86.69), but the narrowing of the bar indicates weakening momentum;
RSI (14): The reading of 82.41 enters the severe overbought zone, and short-term adjustment pressure accumulates;
Bollinger Band: The sharp expansion of the bandwidth reflects the surge in volatility. The price is far away from the middle track and needs to be vigilant of technical repair.
3. Key Levels 🎚️
Resistance: 3906 (Upper Bollinger Band) → 3945 (Fibonacci Extension) → 4000 (Psychological Level);
Support: 3750 (Breakout Conversion Level) → 3647 (Middle Bollinger Band) → 3389 (Lower Bollinger Band).
Market Sentiment and Capital Flows 🌊
Sentiment Indicators: The Fear and Greed Index indicates the market is in "greed" territory, while rising option implied volatility reflects surging hedging demand. 😰➡️😎
Capital Flows: Quantitative strategies are triggering trend-following buying, but high volume suggests a growing divergence between bulls and bears.
Risk Warning: Any negative data (such as a strong jobs report or geopolitical easing) within the extremely overbought market could trigger profit-taking. ⚠️
Market Outlook and Strategic Recommendations 🧭
1. Scenario Analysis 🔮
Upside Breakout: If it holds above 3906, the subsequent target is the 3945-4020 area. 🚀
Technical Pullback: If the 3750 support level falls, a test of the 3647 mid-range is possible. A deeper pullback requires attention to the 3389 support level. 📉
2. Trading Strategy ⚔️
Trend Following: Long positions on pullbacks remain the primary strategy until the bullish trend is broken, with a focus on the validity of the 3750 support level.
Risk Management Tips: Set strict stop-loss orders and be wary of the risk of a resonant pullback caused by an overbought RSI and a top divergence in the MACD. 🛡️
Summary 💎
Gold remains strong, driven by a triple threat of safe-haven demand, expectations of rate cuts, and a weakening US dollar. However, technical overbought signals suggest the possibility of increased short-term volatility. Investors are advised to pay attention to key data such as non-farm payrolls and CPI, while seizing opportunities for phased layout in structural market conditions, and always put risk control first! ⚡
Core Market Overview 📈
Spot gold continued its strong performance on Wednesday (October 1st), hitting a new all-time high near $3,900 and holding steady around $3,890 during the European session. Since the beginning of 2025, the price has risen by over 45%, with double-digit gains in September alone, demonstrating a rare upward trend in recent years. 💹
Fundamentals in-depth Analysis 🔍
1. 🛡️ Safe-haven demand continues to build
Geopolitical risks: The Russia-Ukraine conflict has escalated again, and tensions remain high in the Middle East and Eastern Europe.
US Government Shutdown Crisis: The Republican spending bill has stalled in the Senate, raising the risk of a partial government shutdown in early October. Historical data shows that shutdowns last an average of eight days (with a maximum of 35 days). If the deadlock persists, it will drag down GDP and dampen business investment.
2. 💰 Monetary Policy Expectations Support
High Probability of Rate Cuts: CME interest rate futures indicate a near 95% probability of an October rate cut and over 75% probability of another December rate cut.
Economic Data Signals: JOLTS job vacancies fell to 7.22 million (below expectations), initial jobless claims rose, and signs of a slowing labor market reinforce the case for easing.
US Dollar and Interest Rate Environment: The US dollar index fell below key moving averages for four consecutive days, while long-term real interest rates remained low, reducing the cost of holding gold.
3. 🏦 Solid Structural Buying
Central bank gold purchases and ETF inflows provide underlying support. Market concerns about US Treasury risks and inflationary stickiness are driving continued allocations to gold.
Technical analysis from multiple dimensions 📊
1. Trend structure ↗️
The daily line is running strongly along the upper track of the Bollinger Band, forming a standard rising channel (upper track 3906/middle track 3647/lower track 3389);
The previous key pressure of 3750 turned into support after breaking through, becoming the primary line of defense for short-term correction.
2. Indicator signal 🎯
MACD: The fast and slow lines maintain a golden cross (98.15/86.69), but the narrowing of the bar indicates weakening momentum;
RSI (14): The reading of 82.41 enters the severe overbought zone, and short-term adjustment pressure accumulates;
Bollinger Band: The sharp expansion of the bandwidth reflects the surge in volatility. The price is far away from the middle track and needs to be vigilant of technical repair.
3. Key Levels 🎚️
Resistance: 3906 (Upper Bollinger Band) → 3945 (Fibonacci Extension) → 4000 (Psychological Level);
Support: 3750 (Breakout Conversion Level) → 3647 (Middle Bollinger Band) → 3389 (Lower Bollinger Band).
Market Sentiment and Capital Flows 🌊
Sentiment Indicators: The Fear and Greed Index indicates the market is in "greed" territory, while rising option implied volatility reflects surging hedging demand. 😰➡️😎
Capital Flows: Quantitative strategies are triggering trend-following buying, but high volume suggests a growing divergence between bulls and bears.
Risk Warning: Any negative data (such as a strong jobs report or geopolitical easing) within the extremely overbought market could trigger profit-taking. ⚠️
Market Outlook and Strategic Recommendations 🧭
1. Scenario Analysis 🔮
Upside Breakout: If it holds above 3906, the subsequent target is the 3945-4020 area. 🚀
Technical Pullback: If the 3750 support level falls, a test of the 3647 mid-range is possible. A deeper pullback requires attention to the 3389 support level. 📉
2. Trading Strategy ⚔️
Trend Following: Long positions on pullbacks remain the primary strategy until the bullish trend is broken, with a focus on the validity of the 3750 support level.
Risk Management Tips: Set strict stop-loss orders and be wary of the risk of a resonant pullback caused by an overbought RSI and a top divergence in the MACD. 🛡️
Summary 💎
Gold remains strong, driven by a triple threat of safe-haven demand, expectations of rate cuts, and a weakening US dollar. However, technical overbought signals suggest the possibility of increased short-term volatility. Investors are advised to pay attention to key data such as non-farm payrolls and CPI, while seizing opportunities for phased layout in structural market conditions, and always put risk control first! ⚡
Trade active
Gold is approaching the $3,900 mark; buy low and be cautious about chasing higher!
Affected by the US government shutdown crisis, gold bulls have regained momentum, pushing the price towards $3,895, just a stone's throw away from the psychologically important $3,900 mark. Currently, prices are consolidating from their highs. Be wary of short-term fluctuations in this strong market and avoid blindly chasing higher prices.
Technical Analysis
4-Hour Chart: Consecutive high-level fluctuations, overall strength maintained
Key Support Zones:
🛡️ Short-term support: 3854-3868
🛡️ Core support: 3814-3825
🛡️ Key defensive zone: 3800-3808
Trading Strategy
🎯 Main strategy: Buy on dips, deploy in batches
First position: 3865-3870
Add to position: 3850-3858
Stop-loss: Below 3845
Target: 3885-3890 → 3900🎯
Risk Management Tips
⚠️ While bullish momentum is strong, there's no need to call a top, but excessive chasing of highs is advised.
⚠️ Strictly adhere to stop-loss orders and monitor the effectiveness of support in the 3800-3808 area.
⚡ If 3845 falls, the short-term structure will weaken, necessitating a reassessment of entry timing.
Adhering to the principle of "follow the trend, not against it; pullbacks present opportunities," we should participate prudently in this upward trend!
Trade closed: target reached
[Gold Strategy Accurately Delivered | Two Rounds of Long Trades with Perfect Profit Takes, Proving the Power of Following the Trend!]
Today, we pinpointed the gold short squeeze! 📈 Using the "buy on dips" strategy, we achieved perfect profit take-offs on both trades:
✅ First Round Long: Entered at 3870, exited at 3878, pocketing an 8-point profit;
✅ Second Round Long: Entered at 3860, promptly took profit at 3870, pocketing another 10 points of profit.
The gold price trend closely aligned with our morning analysis—it retreated and consolidated under pressure from the previous high of 3895, then rebounded precisely at the 3860-3870 support zone. Our entire process was under control! 🎯
Reviewing the logic behind this round of trading:
🛡️ Keep a close eye on the risk-averse sentiment surrounding the government shutdown
📊 Rely on key 4-hour technical support
⚡ Strictly adhere to risk management and avoid chasing high prices
Markets never cease, opportunities never cease! Follow us to continuously identify high-probability swing signals. Like and comment "Follow" to share the joy of trading! 🔥
Disclaimer
The information and publications are not meant to be, and do not constitute, financial, investment, trading, or other types of advice or recommendations supplied or endorsed by TradingView. Read more in the Terms of Use.
Disclaimer
The information and publications are not meant to be, and do not constitute, financial, investment, trading, or other types of advice or recommendations supplied or endorsed by TradingView. Read more in the Terms of Use.