Gold's decline intensifies, approaching key support; a battle be
Gold's decline intensifies, approaching key support; a battle between bulls and bears amid internal Fed disagreements! 🦅
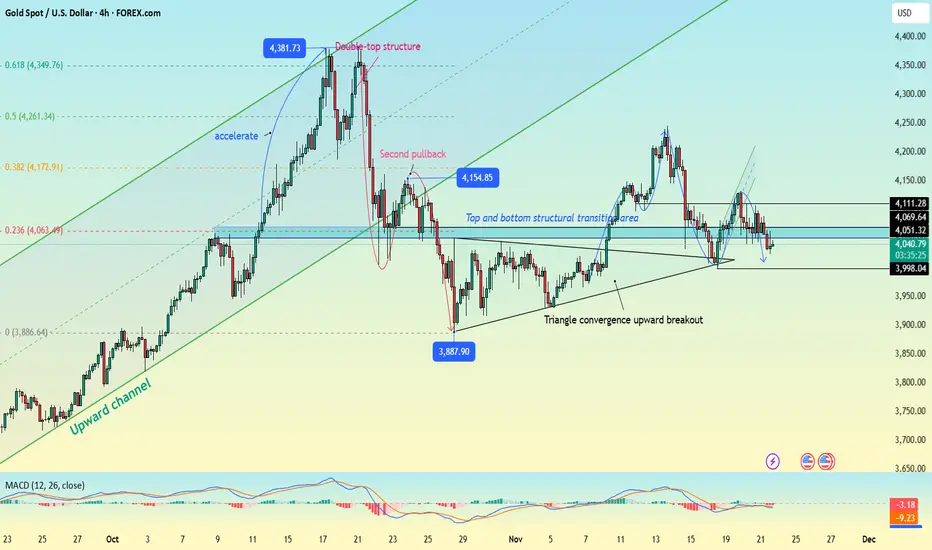
Market Recap: On Friday (November 21), spot gold continued its decline in European trading, currently trading around $4048 per ounce, a drop of nearly $30 on the day! Gold prices remain under pressure below $4100, mainly due to rising market expectations that the Federal Reserve will maintain a hawkish stance, suppressing the attractiveness of gold as a non-yielding asset. Although yesterday's non-farm payroll data appeared better than expected, details revealed a weak labor market, only briefly boosting gold prices. Subsequently, US stocks surged and then retreated, and Asian stock markets plummeted, dragging gold down as well. The market is currently debating whether gold will recover its valuation along with equity assets, or whether it will regain its upward momentum as a "mistakenly sold-off" safe-haven asset. The answer still requires guidance from both technical and data analysis. 📉📈
Fundamental Focus:
1️⃣ Fed Policy Divergence Emerges:
The minutes of the October FOMC meeting showed significant disagreement among members regarding whether to cut interest rates in December. Two committee members even voted against the rate cut: one advocated a 50 basis point cut, while the other advocated holding rates steady. All members reiterated their commitment to achieving the dual mandate of "full employment + 2% inflation," but expressed concern that consecutive rate cuts could push up long-term inflation expectations, negating previous anti-inflation gains. Powell had previously emphasized that a December rate cut was "not a done deal," and the policy path remained uncertain.
2️⃣ Market Sentiment and Opportunity Cost
The fluctuating expectations of a rate cut directly increase the opportunity cost of holding gold, putting downward pressure on gold prices. While increased volatility in global stock markets should theoretically boost safe-haven demand, gold is currently more driven by real interest rates and the US dollar, leading to increased short-term correlation with risk assets.
Technical Analysis
🔍 Trend Judgment: Bears Prevail, Consolidation Awaits Breakout
Gold prices began a correction from $4381, rebounding to around $4130 this week before encountering resistance again, confirming that the rebound is not a reversal.
Currently fluctuating between $4000 and $4100, but the structure is bearish. A break below $4000 would likely lead to further declines towards the $3980-$3950 and even $3915 support levels.
Key resistance lies in the $4100-$4110 area. Only a strong breakout above this range can alleviate downward pressure and test the upper edge of the triangle consolidation pattern.
🎯 Trading Strategy: Sell on rallies, be cautious about attempting to catch a rebound.
Short Positions: Sell in batches at $4070-$4075, stop loss at $8, target $4040-$4020, break below to $4000.
Long Positions: Consider a small long position at $4000-$4005, stop loss at $8, target $4030-$4050.
(Note: Specific entry points may vary depending on real-time market fluctuations. Discussions and updates are welcome!)
Trade active
【Gold Breaks Through Channel Resistance in US Session, Short Position Strategy Available】⚡️
Market Dynamics: Gold surged strongly during the US session, officially breaking through the upper rail of the descending channel on the hourly chart, indicating a subtle change in the short-term structure. The current price is trading in the 4060-4085 range, with 4050-4060 being the key support level for the day, while a new round of resistance has formed around 4085.
Technical Analysis
🔹 The overall structure remains in a sideways consolidation pattern, but short-term momentum is shifting towards a bullish counterattack.
🔹 The channel breakout suggests weakening short-term downward momentum, but the effectiveness of the 4085 resistance level needs to be monitored.
🔹 If it holds above 4085, it may test the psychological resistance level of 4100.
Trading Strategy
🎯 Short Position at Current Price
Entry Area: 4070-4075
Stop Loss: 4090 (Strict Risk Control)
Target Steps: 4055 → 4040 → 4030
Key Logic
A pullback for confirmation is needed after the channel breakout.
The area below 4085 remains a valid resistance zone.
The overall oscillating pattern remains unchanged, suitable for range trading.
Risk Warning
⚠️ If it strongly breaks through and holds above 4090, be wary of the possibility of the short position becoming invalid.
⚠️ Increased volatility during the US session; it is recommended to trade with light positions and strict stop losses.
A team with over 10 years of experience
📌Signals based on SMC+ICT |
📌 87% accuracy rate in Gold trading |
Want to join our VIP signal service?:t.me/+8oIXkN7hfGM1MGM0
One-on-one guidance:t.me/Ron_Trading_Master
📌Signals based on SMC+ICT |
📌 87% accuracy rate in Gold trading |
Want to join our VIP signal service?:t.me/+8oIXkN7hfGM1MGM0
One-on-one guidance:t.me/Ron_Trading_Master
Disclaimer
The information and publications are not meant to be, and do not constitute, financial, investment, trading, or other types of advice or recommendations supplied or endorsed by TradingView. Read more in the Terms of Use.