Gold Market Analysis: Gold Prices Rise and Fall Ahead of US JOLTS Data, Entering a Volatile Pattern
Market Overview 🌍 On Tuesday (December 9th) in late Asian trading, the US dollar index held steady around 99.10, while spot gold prices suddenly fell sharply from their intraday high of nearly $4200/oz📉, currently trading around $4171/oz, exhibiting a typical rise and fall pattern. The market focus for today shifts to the US labor market data to be released later in the day, especially the JOLTS job openings report, which is closely watched by the Federal Reserve. This data will be a key variable influencing short-term gold price movements 🔑
Fundamental Drivers 📈
1️⃣ Key Data Preview ⏳ The US Bureau of Labor Statistics will release the October Job Openings and Labor Turnover Survey (JOLTS). The market expectation is 7.199 million, continuing the moderate downward trend from previous data. Since reaching a record high of 12.18 million in March 2022, JOLTS job openings have mostly trended downwards, reflecting a gradual balancing of the labor market.
📊 Data Impact Analysis:
⬇️ If the actual data is lower than expected, it may strengthen market expectations of an earlier Fed shift, putting downward pressure on the dollar and boosting gold. 🚀
⬆️ If the data is higher than expected, it may support the continued strength of the dollar, putting downward pressure on gold prices. ⚖️
2️⃣ Macroeconomic Policy Background 🏦
💡 Fed Interest Rate Decision Imminent: The Fed's final interest rate decision of 2025 will be held early Thursday morning. The market generally expects interest rates to remain unchanged, but the focus will be on the hints about the future policy path in the post-meeting statement. Current market expectations for the first rate cut have been postponed from March to May, a process that directly affects the dollar's trajectory and gold pricing.
🌐 Geopolitical Support: The ongoing geopolitical tensions, including the Russia-Ukraine conflict and the situation in the Middle East, continue to provide safe-haven support for gold🛡️, limiting its downside potential.
Technical Analysis 📉
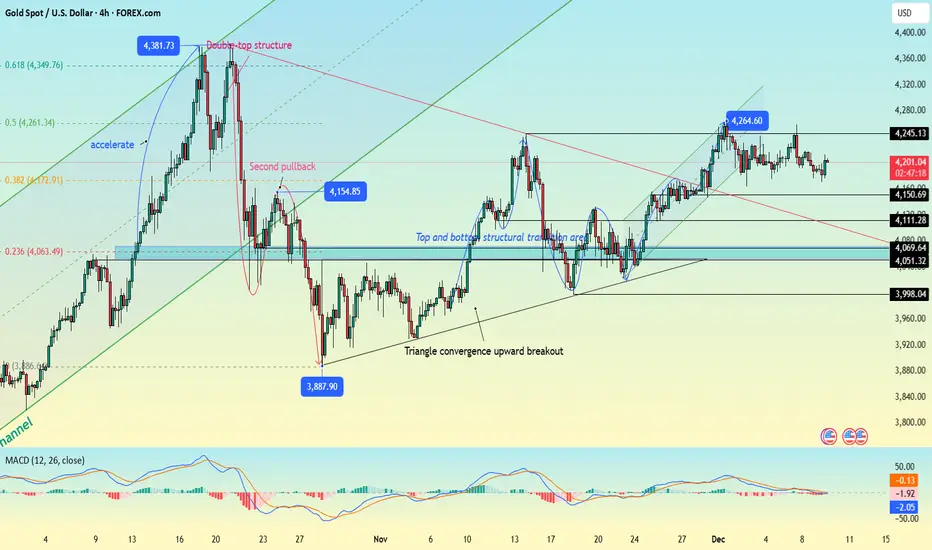
📅 Daily Chart Pattern: Gold is currently in a range-bound trading pattern, without a clear breakout direction. Key Price Levels Analysis:
🛑 Resistance Levels:
$4230/oz: Key short-term resistance level; a breakout could trigger a new round of gains 🚪
$4245-$4255/oz: Resistance area formed by connecting previous downtrend highs; significant resistance on the daily chart ⛰️
🛡️ Support Levels:
$4180-$4190/oz: Key short-term support area 🛡️
$4175/oz: Neckline of a double bottom pattern
$4163/oz: Previous low support
$4150/oz: Important psychological level 💭
⚡ Short-Term Trend Analysis: Gold prices rebounded quickly to around $4200 after touching support near $4170, indicating strong buying support below 💪. The current market characteristics are consistent with the typical consolidation pattern before interest rate decisions—the market tends to maintain range-bound trading before major events, and historical data shows that gold prices often rise to some extent before the announcement of the decision. 🔍 Technical Analysis: Gold is currently trading within the 4170-4230 range in the short term. The failure to continue the downward trend after breaking the double bottom at 4175, instead rebounding quickly, suggests insufficient downward momentum. Considering historical price action patterns before the Fed decision, the current pullback may be a false breakout 🎣.
Trading Strategy Recommendations 💼
🎯 Trading Approach
Main Strategy: Primarily buy on dips, secondarily sell on rallies 🔄
Core Logic: Market sentiment is cautious ahead of the interest rate decision, but historical patterns support buying on dips 📜
⚙️ Specific Strategy Layout
🟢 Long Position Strategy:
📍 Entry Area: Enter in batches around $4190-$4195/oz
📊 Position Management: Recommended total position size not to exceed 20%
🚫 Stop-Loss Setting: Below $4180/oz
🎯 Target Price:
First Target: $4210-$4220/oz
Second Target: $4230/oz (Upside potential to $4245-$4255 after a breakout) 🔝
🔴 Short Position Strategy:
📍 Entry Timing: Consider shorting in batches with light positions when the price rebounds to the $4218-$4200/oz range.
🚫 Stop-Loss: Above $4226/oz
🎯 Target Price: $4210-$4200/oz, break above to $4190 ⬇️
👁️ Key Observation Points
🔓 Validity of the $4230 Breakout: If the price breaks through this level effectively, it can be considered a short-term strengthening signal, and you can consider adding to your long positions. 🚀
💪 Support Strength at $4175: If this level is tested again and held, it will strengthen the judgment of a range-bound pattern.
⛰️ Key Resistance at $4255: This area is a crucial watershed for determining whether a daily-level rebound can begin. 🌊
⚠️ Risk Warning and Trading Discipline
📅 Data Risk: JOLTS data tonight may cause significant volatility. It is recommended to reduce positions appropriately before the data release. ⚡
🎭 Event Risk: The Fed's interest rate decision on Thursday is the core event of the week, and the market may make a directional choice before and after the decision. 🏁
💰 Position Management: Strictly control positions within the recommended range and avoid over-leveraging. ⚖️
🛡️ Stop-Loss Discipline: Always set stop-loss orders and never hold losing positions, especially in volatile markets before major events. 🚨
📝 Summary: Gold is currently in a typical consolidation phase before the interest rate decision. Technically, the 4170-4230 range-bound pattern is intact, while fundamentals are influenced by both US economic data and Fed policy expectations. Trading is recommended to be range-bound, focusing on buying opportunities on pullbacks, while also paying attention to trend opportunities arising from breakouts at key price levels. Investors should closely monitor the JOLTS data tonight, as this data may set the tone for market sentiment before the decision. 🎯
Market Overview 🌍 On Tuesday (December 9th) in late Asian trading, the US dollar index held steady around 99.10, while spot gold prices suddenly fell sharply from their intraday high of nearly $4200/oz📉, currently trading around $4171/oz, exhibiting a typical rise and fall pattern. The market focus for today shifts to the US labor market data to be released later in the day, especially the JOLTS job openings report, which is closely watched by the Federal Reserve. This data will be a key variable influencing short-term gold price movements 🔑
Fundamental Drivers 📈
1️⃣ Key Data Preview ⏳ The US Bureau of Labor Statistics will release the October Job Openings and Labor Turnover Survey (JOLTS). The market expectation is 7.199 million, continuing the moderate downward trend from previous data. Since reaching a record high of 12.18 million in March 2022, JOLTS job openings have mostly trended downwards, reflecting a gradual balancing of the labor market.
📊 Data Impact Analysis:
⬇️ If the actual data is lower than expected, it may strengthen market expectations of an earlier Fed shift, putting downward pressure on the dollar and boosting gold. 🚀
⬆️ If the data is higher than expected, it may support the continued strength of the dollar, putting downward pressure on gold prices. ⚖️
2️⃣ Macroeconomic Policy Background 🏦
💡 Fed Interest Rate Decision Imminent: The Fed's final interest rate decision of 2025 will be held early Thursday morning. The market generally expects interest rates to remain unchanged, but the focus will be on the hints about the future policy path in the post-meeting statement. Current market expectations for the first rate cut have been postponed from March to May, a process that directly affects the dollar's trajectory and gold pricing.
🌐 Geopolitical Support: The ongoing geopolitical tensions, including the Russia-Ukraine conflict and the situation in the Middle East, continue to provide safe-haven support for gold🛡️, limiting its downside potential.
Technical Analysis 📉
📅 Daily Chart Pattern: Gold is currently in a range-bound trading pattern, without a clear breakout direction. Key Price Levels Analysis:
🛑 Resistance Levels:
$4230/oz: Key short-term resistance level; a breakout could trigger a new round of gains 🚪
$4245-$4255/oz: Resistance area formed by connecting previous downtrend highs; significant resistance on the daily chart ⛰️
🛡️ Support Levels:
$4180-$4190/oz: Key short-term support area 🛡️
$4175/oz: Neckline of a double bottom pattern
$4163/oz: Previous low support
$4150/oz: Important psychological level 💭
⚡ Short-Term Trend Analysis: Gold prices rebounded quickly to around $4200 after touching support near $4170, indicating strong buying support below 💪. The current market characteristics are consistent with the typical consolidation pattern before interest rate decisions—the market tends to maintain range-bound trading before major events, and historical data shows that gold prices often rise to some extent before the announcement of the decision. 🔍 Technical Analysis: Gold is currently trading within the 4170-4230 range in the short term. The failure to continue the downward trend after breaking the double bottom at 4175, instead rebounding quickly, suggests insufficient downward momentum. Considering historical price action patterns before the Fed decision, the current pullback may be a false breakout 🎣.
Trading Strategy Recommendations 💼
🎯 Trading Approach
Main Strategy: Primarily buy on dips, secondarily sell on rallies 🔄
Core Logic: Market sentiment is cautious ahead of the interest rate decision, but historical patterns support buying on dips 📜
⚙️ Specific Strategy Layout
🟢 Long Position Strategy:
📍 Entry Area: Enter in batches around $4190-$4195/oz
📊 Position Management: Recommended total position size not to exceed 20%
🚫 Stop-Loss Setting: Below $4180/oz
🎯 Target Price:
First Target: $4210-$4220/oz
Second Target: $4230/oz (Upside potential to $4245-$4255 after a breakout) 🔝
🔴 Short Position Strategy:
📍 Entry Timing: Consider shorting in batches with light positions when the price rebounds to the $4218-$4200/oz range.
🚫 Stop-Loss: Above $4226/oz
🎯 Target Price: $4210-$4200/oz, break above to $4190 ⬇️
👁️ Key Observation Points
🔓 Validity of the $4230 Breakout: If the price breaks through this level effectively, it can be considered a short-term strengthening signal, and you can consider adding to your long positions. 🚀
💪 Support Strength at $4175: If this level is tested again and held, it will strengthen the judgment of a range-bound pattern.
⛰️ Key Resistance at $4255: This area is a crucial watershed for determining whether a daily-level rebound can begin. 🌊
⚠️ Risk Warning and Trading Discipline
📅 Data Risk: JOLTS data tonight may cause significant volatility. It is recommended to reduce positions appropriately before the data release. ⚡
🎭 Event Risk: The Fed's interest rate decision on Thursday is the core event of the week, and the market may make a directional choice before and after the decision. 🏁
💰 Position Management: Strictly control positions within the recommended range and avoid over-leveraging. ⚖️
🛡️ Stop-Loss Discipline: Always set stop-loss orders and never hold losing positions, especially in volatile markets before major events. 🚨
📝 Summary: Gold is currently in a typical consolidation phase before the interest rate decision. Technically, the 4170-4230 range-bound pattern is intact, while fundamentals are influenced by both US economic data and Fed policy expectations. Trading is recommended to be range-bound, focusing on buying opportunities on pullbacks, while also paying attention to trend opportunities arising from breakouts at key price levels. Investors should closely monitor the JOLTS data tonight, as this data may set the tone for market sentiment before the decision. 🎯
Trade active
Gold Strategy Analysis: Breakout and Pullback Confirmation, Focus on Key Resistance Zone 📉
📊 Current Trend Observation
Gold's hourly chart has completed a triangle consolidation and broken down, rebounding steadily from the low of 4170 during the European session 🔄
Currently, the price is facing resistance in the 4215-4220 area, forming a key short-term resistance 🚧
If the price effectively breaks through this resistance zone, the trend will continue its sideways consolidation, with a potential test of the 4250 level 🎯
If it encounters resistance and falls back, it may retest the previous low support area.
⚡ Key Short-Term Signals
After a short-term surge, the price has entered a narrow consolidation phase. The key support level to watch is 4195 💡
If this level is effectively broken, the short-term trend of gold will shift from strong to weak, potentially initiating a new round of decline. 📉
Conversely, if the price can hold above this support level, the overall trend will remain one of slightly bullish consolidation.
🎯 Trading Strategy Recommendations
1. Short Position Placement
Entry Area: Lightly short in the 4215-4210 area
Stop Loss Setting: Above 4225 (Stop loss if key resistance is broken) 🛑
Downside Targets:
First Target: 4195 (Short-term support)
Second Target: 4180 (Previous consolidation platform)
Third Target: 4160 (Theoretical target for triangle breakout) 📊
2. Risk Management Points
Keep position size within 10-15%, maintaining flexibility.
If the price strongly breaks through 4225, immediately exit the short position to avoid holding a losing position against the trend ⚠️
During the downtrend, pay attention to the support level at 4195; consider partially reducing positions to lock in profits.
3. Alternative Observations
If the price breaks directly above the 4220 resistance level, consider a small long position after a pullback to around 4210 and subsequent stabilization.
If a clear support signal appears around 4195, a short-term long position for a rebound could be considered.
📈 Technical Summary
A pullback after a breakout from a triangle pattern is a classic technical formation.
The 4215-4220 area is a convergence zone of multiple resistance levels.
The 4195 support level determines short-term strength or weakness.
4225 is the intraday support/resistance level; a break below this level requires adjusting the bearish strategy.
Risk Warning: Data releases are scheduled for tonight; please manage your position size and strictly adhere to stop-loss orders. Market conditions are constantly changing; it is recommended to adjust your strategy flexibly based on real-time price action. 💰⚡
Disclaimer
The information and publications are not meant to be, and do not constitute, financial, investment, trading, or other types of advice or recommendations supplied or endorsed by TradingView. Read more in the Terms of Use.
Disclaimer
The information and publications are not meant to be, and do not constitute, financial, investment, trading, or other types of advice or recommendations supplied or endorsed by TradingView. Read more in the Terms of Use.