🟩 What Is a Symmetrical Triangle?
A symmetrical triangle pattern is a continuation pattern that typically forms when the market enters a phase of consolidation and price compression.
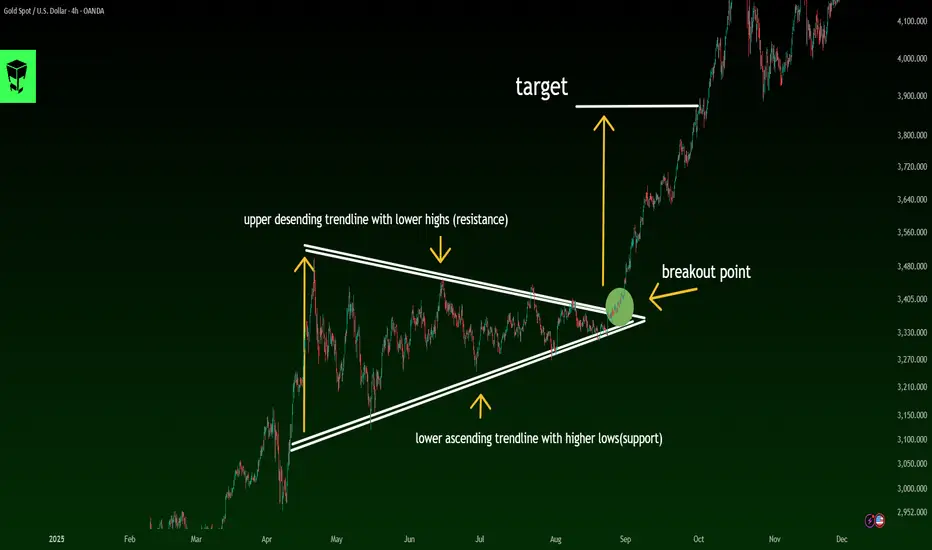
In this pattern, price moves between two converging trendlines—one descending and one ascending.
Upper trendline: Lower Highs
Lower trendline: Higher Lows
These two lines converge toward each other, forming a balanced, center-aligned triangle.
🟨 Key Characteristics of a Symmetrical Triangle
✔️ Two converging trendlines (one sloping down, one sloping up)
✔️ Gradual decrease in trading volume
✔️ Price moves toward the apex of the triangle
✔️ Breakouts usually follow the prior trend
✔️ It is primarily a continuation pattern, though occasional reversals can happen
🟦 How to Identify a Symmetrical Triangle
To confirm a valid symmetrical triangle, check the following:
🔹 1. At least two touches on resistance and two on support
You must see lower highs and higher lows.
🔹 2. Both trendlines must slope inward
Unlike ascending or descending triangles, both lines are angled.
🔹 3. Price must contract toward the apex
Smaller swings = market compression.
🔹 4. Volume should gradually decline
Until the breakout occurs.
🟧 Professional Entry Strategies
📌 Method 1: Entering After the Breakout (Conservative Entry)
Wait for a candle to close outside the triangle
Volume should increase as confirmation
Stop-loss below the last swing or below the trendline
📌 Method 2: Entering After a Pullback (Low-Risk Entry)
Wait for a retest of the broken trendline
Use candlestick triggers (Pin Bar, Engulfing, Break & Retest)
Much smaller stop-loss + a better risk-to-reward ratio
📌 Method 3: Volume + Breakout + Positioning
For advanced traders, Volume Spread Analysis (VSA) is the strongest confirmation tool for breakouts.
🔶 Setting Take-Profit Targets
Standard Method:
📐 Target = Height of the triangle base
(measured from the widest part of the pattern)
Professional methods:
✔️ Target 1: Market Structure
Based on supply/demand zones
✔️ Target 2: Fibonacci Extensions
1.618 is often the most reliable target
✔️ Target 3: Multi-Timeframe Alignment
Check breakout levels in higher timeframes for added confidence
🔶 Fake Breakouts in Symmetrical Triangles
Fake breakouts are extremely common in this pattern.
Signs of a fake breakout:
❌ Low volume
❌ Long-wick candles
❌ Quick rejection back into the triangle
❌ Breakout occurs too close to the apex
❌ Lack of momentum
Fake breakouts often lead to a strong move in the opposite direction.
🔶 Pattern Behavior in Different Market Conditions
🟢 In an uptrend:
80% of the time it breaks upward → continuation
🔴 In a downtrend:
About 65% of the time it breaks downward → continuation
⚪️ In a ranging market:
Direction of breakout is uncertain → extra caution required
🔶 Common Mistakes Traders Make
🚫 Entering before the breakout
🚫 Confusing the pattern with ascending/descending triangles
🚫 Trusting breakouts without volume confirmation
🚫 Setting stops too close
🚫 Ignoring market psychology and momentum
🔷 Final Professional Summary
A symmetrical triangle indicates:
The market is in a compression phase
Lower Highs + Higher Lows
Price is preparing for a strong explosive move
Breakouts usually follow the prior trend
Valid breakouts require volume + candle close outside
Targets follow the triangle height or Fibonacci extensions
Fake breakouts are common → caution is essential
A symmetrical triangle pattern is a continuation pattern that typically forms when the market enters a phase of consolidation and price compression.
In this pattern, price moves between two converging trendlines—one descending and one ascending.
Upper trendline: Lower Highs
Lower trendline: Higher Lows
These two lines converge toward each other, forming a balanced, center-aligned triangle.
🟨 Key Characteristics of a Symmetrical Triangle
✔️ Two converging trendlines (one sloping down, one sloping up)
✔️ Gradual decrease in trading volume
✔️ Price moves toward the apex of the triangle
✔️ Breakouts usually follow the prior trend
✔️ It is primarily a continuation pattern, though occasional reversals can happen
🟦 How to Identify a Symmetrical Triangle
To confirm a valid symmetrical triangle, check the following:
🔹 1. At least two touches on resistance and two on support
You must see lower highs and higher lows.
🔹 2. Both trendlines must slope inward
Unlike ascending or descending triangles, both lines are angled.
🔹 3. Price must contract toward the apex
Smaller swings = market compression.
🔹 4. Volume should gradually decline
Until the breakout occurs.
🟧 Professional Entry Strategies
📌 Method 1: Entering After the Breakout (Conservative Entry)
Wait for a candle to close outside the triangle
Volume should increase as confirmation
Stop-loss below the last swing or below the trendline
📌 Method 2: Entering After a Pullback (Low-Risk Entry)
Wait for a retest of the broken trendline
Use candlestick triggers (Pin Bar, Engulfing, Break & Retest)
Much smaller stop-loss + a better risk-to-reward ratio
📌 Method 3: Volume + Breakout + Positioning
For advanced traders, Volume Spread Analysis (VSA) is the strongest confirmation tool for breakouts.
🔶 Setting Take-Profit Targets
Standard Method:
📐 Target = Height of the triangle base
(measured from the widest part of the pattern)
Professional methods:
✔️ Target 1: Market Structure
Based on supply/demand zones
✔️ Target 2: Fibonacci Extensions
1.618 is often the most reliable target
✔️ Target 3: Multi-Timeframe Alignment
Check breakout levels in higher timeframes for added confidence
🔶 Fake Breakouts in Symmetrical Triangles
Fake breakouts are extremely common in this pattern.
Signs of a fake breakout:
❌ Low volume
❌ Long-wick candles
❌ Quick rejection back into the triangle
❌ Breakout occurs too close to the apex
❌ Lack of momentum
Fake breakouts often lead to a strong move in the opposite direction.
🔶 Pattern Behavior in Different Market Conditions
🟢 In an uptrend:
80% of the time it breaks upward → continuation
🔴 In a downtrend:
About 65% of the time it breaks downward → continuation
⚪️ In a ranging market:
Direction of breakout is uncertain → extra caution required
🔶 Common Mistakes Traders Make
🚫 Entering before the breakout
🚫 Confusing the pattern with ascending/descending triangles
🚫 Trusting breakouts without volume confirmation
🚫 Setting stops too close
🚫 Ignoring market psychology and momentum
🔷 Final Professional Summary
A symmetrical triangle indicates:
The market is in a compression phase
Lower Highs + Higher Lows
Price is preparing for a strong explosive move
Breakouts usually follow the prior trend
Valid breakouts require volume + candle close outside
Targets follow the triangle height or Fibonacci extensions
Fake breakouts are common → caution is essential
Disclaimer
The information and publications are not meant to be, and do not constitute, financial, investment, trading, or other types of advice or recommendations supplied or endorsed by TradingView. Read more in the Terms of Use.
Disclaimer
The information and publications are not meant to be, and do not constitute, financial, investment, trading, or other types of advice or recommendations supplied or endorsed by TradingView. Read more in the Terms of Use.