Master Support & Resistance Levels – The Most Powerful Tool in Technical Analysis 📈🔥
Support and Resistance (S&R) are the foundation of price action.
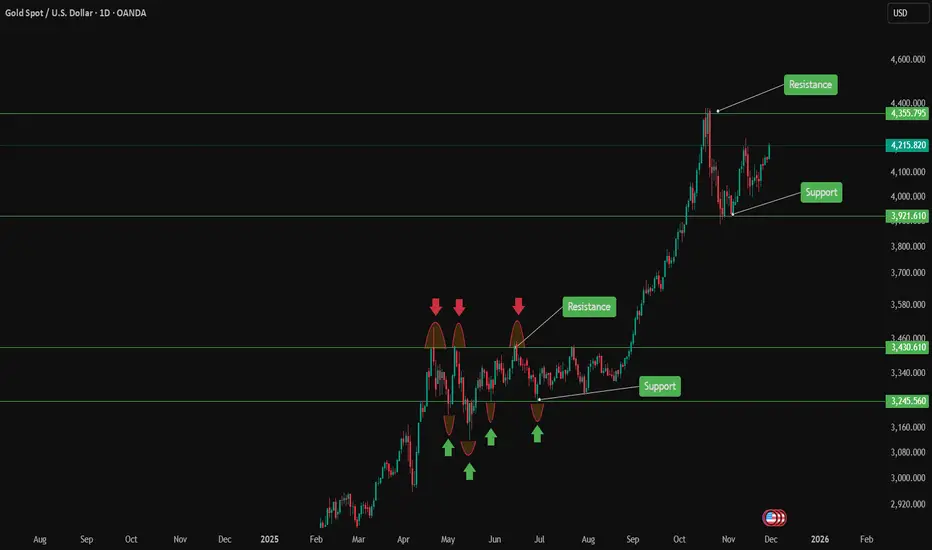
Support = where price tends to stop falling (buyers step in) 🛡️
Resistance = where price tends to stop rising (sellers take control) ⚔️
These levels are not always exact, but when used correctly they give you high-probability entries and exits in Forex, Crypto, and Stocks.
How to Find Strong S&R Levels:
1-Look left → Previous swing highs & lows
The more times price has touched and bounced, the stronger the level becomes.
2-Round numbers & psychological levels
Examples: $50,000 BTC, 1.2000 EUR/USD, $200 AAPL – traders love these!
3-Use TradingView tools
2Role Reversal – The Magic Trick ✨
This is where the big moves start!
Real Examples Right Now:
Bitcoin → $100,000 break support → now strong resistance
Pro Tips:
Start drawing your S&R levels today and watch your win rate improve instantly.
Which market are you trading right now? Drop your favorite S&R level in the comments! 👇
Support and Resistance (S&R) are the foundation of price action.
Support = where price tends to stop falling (buyers step in) 🛡️
Resistance = where price tends to stop rising (sellers take control) ⚔️
These levels are not always exact, but when used correctly they give you high-probability entries and exits in Forex, Crypto, and Stocks.
How to Find Strong S&R Levels:
1-Look left → Previous swing highs & lows
The more times price has touched and bounced, the stronger the level becomes.
2-Round numbers & psychological levels
Examples: $50,000 BTC, 1.2000 EUR/USD, $200 AAPL – traders love these!
3-Use TradingView tools
- Horizontal Line
- Fibonacci Retracement (38.2%, 50%, 61.8%)
- Volume Profile (High-volume nodes often act as S&R)
2Role Reversal – The Magic Trick ✨
- Broken resistance → becomes new support
- Broken support → becomes new resistance
This is where the big moves start!
Real Examples Right Now:
Bitcoin → $100,000 break support → now strong resistance
Pro Tips:
- Always check multiple timeframes (Daily + 4H give the strongest levels)
- Combine with RSI or volume for confirmation
- Place stop-loss just below support / above resistance
- When a level breaks with high volume → jump on the breakout!
Start drawing your S&R levels today and watch your win rate improve instantly.
Which market are you trading right now? Drop your favorite S&R level in the comments! 👇
Related publications
Disclaimer
The information and publications are not meant to be, and do not constitute, financial, investment, trading, or other types of advice or recommendations supplied or endorsed by TradingView. Read more in the Terms of Use.
Related publications
Disclaimer
The information and publications are not meant to be, and do not constitute, financial, investment, trading, or other types of advice or recommendations supplied or endorsed by TradingView. Read more in the Terms of Use.