I believe that it is possible to beat the market through a consistent and unemotional approach. This is primarily achieved through preparing instead of reacting. Click here to learn more about how I use the indicators below and Click here to get my complete trading strategy! Please be advised that I swing trade and will often hold onto a position for > 1 month. What you do with your $ is your business, what I do with my $ is my business.
My recent Bitcoin Bubble Comparison - 3 Day Chart led to the following calls: < $5,750 by 11/15/2018 & my prediction for the bottom is $2,718 by 1/20/19 | My Bitcoin Bubble Comparison - Monthly Chart closely mirrored my price and time targets | Calling for $35 ETH before the end of 2018.
Previous analysis: I then exited my long at a nominal loss and opened a short at a much worse price. May seem like bad trading but it actually brings up some important topics
that I haven’t talked enough about: position sizing, risk:reward and hedging.
Position: Short ETHBTC from 0.03109 | Short LTCBTC from 0.00752 | Short EOS:BTC from 0.0008057 | Short BCHBTC from 0.04628
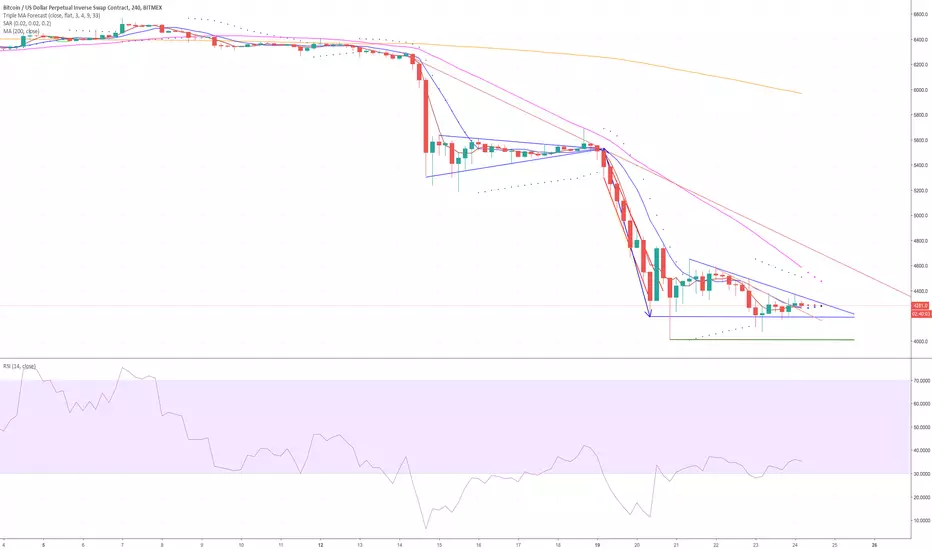
Patterns: Bear pennant / flag
Horizontal support and resistance: R: $4,371 | S: $4,200
BTCUSDSHORTS: Pulling into golden cross, expecting a hard bounce around 26,200
Funding Rates: Longs pay shorts 0.01%
Short term trend (4 day MA): Currently being tested
Medium term trend (9 day MA): Was very surprised when we appeared to be breaking down before retesting 9 MA. Now it looks like we should.
Long term trend ( 34 day MA): Rolling over and will be in line with resistance cluster at > $5,750
Overall trend: Bear
Volume: nothing noteworthy that I am seeing
FIB’s: (Start at $1,000 and connect to ATH’) 0.886 = $3,164 | 0.786 = $5,805
Candlestick analysis: I cannot ever remember seeing a 4 candle sequence like we have over the past four days. High volume hammer, following by a bullish spinning top (very high liklihood of leading to a bounce) and then a bearish inside bar and a breakdown of horizontal support that didn’t retest the bottom of the wick from the original hammer. A lot of words to draw no conclusions, however the pattern recognition part of my brain finds it very interesting.
Ichimoku Cloud: 1h cloud is thick from $4,400 - $4,850.
TD’ Sequential: Red 8 (most important indicator to me right now)
Visible Range: If we breakdown $4,000 then there should be significant support at $3,750. If we breakdown that area then I would expect a fall to $3,100
Price action: 24h: +3.07% | 2w: -32.29% | 1m: -32.77%
Bollinger Bands: Closed inside daily band
Trendline: 4h bear trendline is at $4,760, however the 33 MA is at $4,588 (was recently above trendline). Parabolic SAR’s are also moving in more tightly at $4,500 (When SAR’s get inside my MA’s then I view them as more likely to get broken)
Daily Trend: (Using 1h 33 MA to identify daily trend) Bearish
Fractals: Down: $4,000 | Up: $5,692
RSI: Rekt
Stochastic: Daily stoch looks bearish af’ with the recross + divergence
Summary: The most important indicator to me right now is the TD’ Sequential being on a red 8. Failure to breakdown $4,000 horizontal support after breaking down the 4h bear pennant shows many signs of a trap.
Furthermore I was really expecting a retest of the 8 day MA before selling off further. Now it is looking like the price action from yesterday whipsawed me out of my long and into a short at exactly the wrong time.
However that is okay. When you markets are moving you have to act fast. Sometimes you get whipsawed. Each position I took had a > 5:1 risk:reward ratio. Furthermore each position had a much greater than 20% chance of success (based on my subjective estimation).
I ended up adjusting my stop loss to $128.5 right before it would have triggered due to shorter TF’s before very overbought at resistance. This is something that I am extremely weary of, however it is a small position and as I gain experience I like adding small dashes of discretion.
I re calculated the risk and adjusting the stop had acceptable implications on my risk:reward considerations.
There are a lot of bullish indicators right now, however the bear pennant / flag is still in tact and there is a lot of bearish momentum. When all things appear equal it is usually a very good idea to bet on the trend / momentum. This post is market as a short but would not suggest opening a short unless we get another close below the bear pennant / flag.
My recent Bitcoin Bubble Comparison - 3 Day Chart led to the following calls: < $5,750 by 11/15/2018 & my prediction for the bottom is $2,718 by 1/20/19 | My Bitcoin Bubble Comparison - Monthly Chart closely mirrored my price and time targets | Calling for $35 ETH before the end of 2018.
Previous analysis: I then exited my long at a nominal loss and opened a short at a much worse price. May seem like bad trading but it actually brings up some important topics
that I haven’t talked enough about: position sizing, risk:reward and hedging.
Position: Short ETHBTC from 0.03109 | Short LTCBTC from 0.00752 | Short EOS:BTC from 0.0008057 | Short BCHBTC from 0.04628
Patterns: Bear pennant / flag
Horizontal support and resistance: R: $4,371 | S: $4,200
BTCUSDSHORTS: Pulling into golden cross, expecting a hard bounce around 26,200
Funding Rates: Longs pay shorts 0.01%
Short term trend (4 day MA): Currently being tested
Medium term trend (9 day MA): Was very surprised when we appeared to be breaking down before retesting 9 MA. Now it looks like we should.
Long term trend ( 34 day MA): Rolling over and will be in line with resistance cluster at > $5,750
Overall trend: Bear
Volume: nothing noteworthy that I am seeing
FIB’s: (Start at $1,000 and connect to ATH’) 0.886 = $3,164 | 0.786 = $5,805
Candlestick analysis: I cannot ever remember seeing a 4 candle sequence like we have over the past four days. High volume hammer, following by a bullish spinning top (very high liklihood of leading to a bounce) and then a bearish inside bar and a breakdown of horizontal support that didn’t retest the bottom of the wick from the original hammer. A lot of words to draw no conclusions, however the pattern recognition part of my brain finds it very interesting.
Ichimoku Cloud: 1h cloud is thick from $4,400 - $4,850.
TD’ Sequential: Red 8 (most important indicator to me right now)
Visible Range: If we breakdown $4,000 then there should be significant support at $3,750. If we breakdown that area then I would expect a fall to $3,100
Price action: 24h: +3.07% | 2w: -32.29% | 1m: -32.77%
Bollinger Bands: Closed inside daily band
Trendline: 4h bear trendline is at $4,760, however the 33 MA is at $4,588 (was recently above trendline). Parabolic SAR’s are also moving in more tightly at $4,500 (When SAR’s get inside my MA’s then I view them as more likely to get broken)
Daily Trend: (Using 1h 33 MA to identify daily trend) Bearish
Fractals: Down: $4,000 | Up: $5,692
RSI: Rekt
Stochastic: Daily stoch looks bearish af’ with the recross + divergence
Summary: The most important indicator to me right now is the TD’ Sequential being on a red 8. Failure to breakdown $4,000 horizontal support after breaking down the 4h bear pennant shows many signs of a trap.
Furthermore I was really expecting a retest of the 8 day MA before selling off further. Now it is looking like the price action from yesterday whipsawed me out of my long and into a short at exactly the wrong time.
However that is okay. When you markets are moving you have to act fast. Sometimes you get whipsawed. Each position I took had a > 5:1 risk:reward ratio. Furthermore each position had a much greater than 20% chance of success (based on my subjective estimation).
I ended up adjusting my stop loss to $128.5 right before it would have triggered due to shorter TF’s before very overbought at resistance. This is something that I am extremely weary of, however it is a small position and as I gain experience I like adding small dashes of discretion.
I re calculated the risk and adjusting the stop had acceptable implications on my risk:reward considerations.
There are a lot of bullish indicators right now, however the bear pennant / flag is still in tact and there is a lot of bearish momentum. When all things appear equal it is usually a very good idea to bet on the trend / momentum. This post is market as a short but would not suggest opening a short unless we get another close below the bear pennant / flag.
emasar Indicator is available for purchase at alphanalysis.io/product/emasar/
Disclaimer
The information and publications are not meant to be, and do not constitute, financial, investment, trading, or other types of advice or recommendations supplied or endorsed by TradingView. Read more in the Terms of Use.