I believe that it is possible to beat the market through a consistent and unemotional approach. This is primarily achieved through preparing instead of reacting. Click here to learn more about how I use the indicators below and Click here to get my complete trading strategy! Please be advised that I swing trade and will often hold onto a position for > 1 month. What you do with your $ is your business, what I do with my $ is my business.
My recent Bitcoin Bubble Comparison - 3 Day Chart led to the following calls: < $5,750 by 11/15/2018 & my prediction for the bottom is $2,718 by 1/20/19 | My Bitcoin Bubble Comparison - Monthly Chart closely mirrored my price and time targets | Calling for $35 ETH before the end of 2018.
Previous analysis: “I was expecting a strong bounce yesterday to take us into a resistance cluster at $5,200, mainly due to the bullish marubozu on the 4h followed by the high volume hammer. I am not particularly happy with the price action since then.”
Position: Long spot BTC from $4,225 | Short ETHBTC from 0.03109 | Short LTCBTC from 0.00752 | Short EOS:BTC from 0.0008057
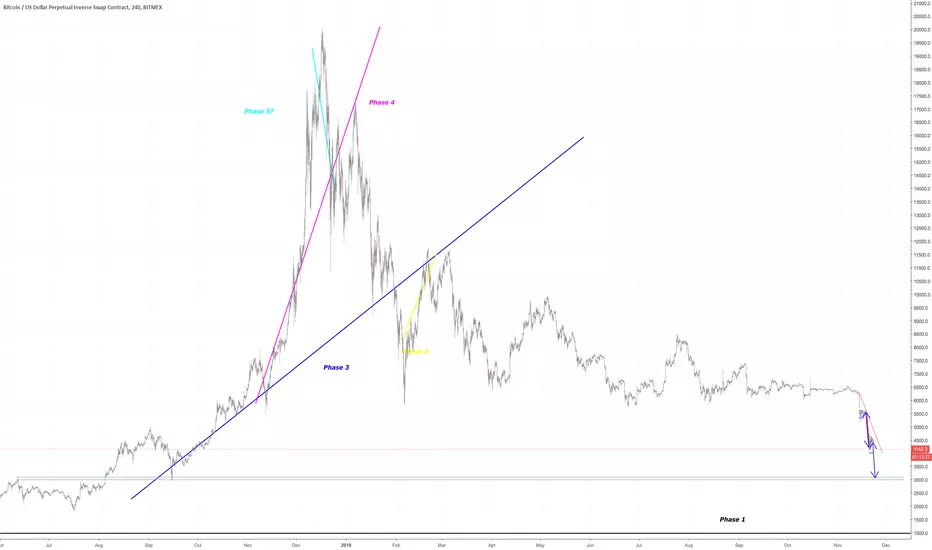
Patterns: Bear pennant $3,101 target
Horizontal support and resistance: Support at $4,200 should turn into resistance | $4,000 is key support
BTCUSDSHORTS: Trending up nicely and still room to go before major resistance
Funding Rates: Shorts pay longs 0.0463%
Short term trend (4 day MA): Closed below, now entire candle is below
Medium term trend (9 day MA): Very surprised that we did not retest 9 MA in the last 24 - 48 hours
Long term trend ( 34 day MA): Turning over
Overall trend: Bear
Volume: The volume is significant on the pennant breakdown
FIB’s: Start at $1,000 and connect to ATH’ and 0.886 = $3,164
Candlestick analysis: 4h looks like 3 black crows to me | Weekly is shaping up to be a marubozu
Ichimoku Cloud: Haven’t even retested 1h cloud
TD’ Sequential: Binance is showing a r2 < r1 after a completed setup. Bitmex is showing a r7 | Weekly r2 < r1
Visible Range: If we breakdown $4,000 then there should be significant support at $3,750. If we breakdown that area then I would expect a fall to $3,100
Price action: 24h: -8.6% | 2w: -34.95% | 1m: -34.95%
Bollinger Bands: Failed to closed inside the daily band, now appears to be getting stuck to the bottom
Trendline: Failed to retest the 8 day MA and also failed to retest 4h trendline. Is capitulation coming?
Daily Trend: Bear
Fractals: Down printed at $4,000. If that breaks, the next down fractal is at $3,559 however I do not expect that to hold due to the gap in the volume profile.
RSI: Since we have not gotten a divergence we can still make another leg down even though we are this oversold.
Stochastic: Recrossed bearish, very bad sign for bulls
Summary: Over the last couple days I have been buying spot BTC’ and longing ETH:USD while also shorting alts against BTC’. I then exited my long at a nominal loss and opened a short at a much worse price. May seem like bad trading but it actually brings up some important topics
that I haven’t talked enough about: position sizing, risk:reward and hedging.
Position Size: There is very big a difference between taking a large position and taking a small position. Each should be done when the circumstance calls for it. For example: great risk:reward and betting with the trend.
Risk:Reward: If retail business is “location, location, location” then I believe trading is risk:reward, risk:reward, risk:reward. If you are able to find positions with a 5:1 ratio, or better, then you don’t have to be right very often to crush any market.
Hedging: I do not do nearly as much of this as I should / could and it is something I intent to get better at. However sometimes there are trades that appear to be profitable by themselves as well as being a form of a hedge.
Do to what is outlined above I have been taking out large shorts on alts and I simply could not pass up buying the horizontal support of BTC’ and ETH’. I even tried signing up for a new exchange to leverage trade LTC:USD.
I was quick to get out after breaking down support and after seeing further action I liked (ETH’ appears to be breaking down horizontal support with a large gap in volume profile, whereas that is not the case for BTC’).
Happy Thanksgiving I love you all!
My recent Bitcoin Bubble Comparison - 3 Day Chart led to the following calls: < $5,750 by 11/15/2018 & my prediction for the bottom is $2,718 by 1/20/19 | My Bitcoin Bubble Comparison - Monthly Chart closely mirrored my price and time targets | Calling for $35 ETH before the end of 2018.
Previous analysis: “I was expecting a strong bounce yesterday to take us into a resistance cluster at $5,200, mainly due to the bullish marubozu on the 4h followed by the high volume hammer. I am not particularly happy with the price action since then.”
Position: Long spot BTC from $4,225 | Short ETHBTC from 0.03109 | Short LTCBTC from 0.00752 | Short EOS:BTC from 0.0008057
Patterns: Bear pennant $3,101 target
Horizontal support and resistance: Support at $4,200 should turn into resistance | $4,000 is key support
BTCUSDSHORTS: Trending up nicely and still room to go before major resistance
Funding Rates: Shorts pay longs 0.0463%
Short term trend (4 day MA): Closed below, now entire candle is below
Medium term trend (9 day MA): Very surprised that we did not retest 9 MA in the last 24 - 48 hours
Long term trend ( 34 day MA): Turning over
Overall trend: Bear
Volume: The volume is significant on the pennant breakdown
FIB’s: Start at $1,000 and connect to ATH’ and 0.886 = $3,164
Candlestick analysis: 4h looks like 3 black crows to me | Weekly is shaping up to be a marubozu
Ichimoku Cloud: Haven’t even retested 1h cloud
TD’ Sequential: Binance is showing a r2 < r1 after a completed setup. Bitmex is showing a r7 | Weekly r2 < r1
Visible Range: If we breakdown $4,000 then there should be significant support at $3,750. If we breakdown that area then I would expect a fall to $3,100
Price action: 24h: -8.6% | 2w: -34.95% | 1m: -34.95%
Bollinger Bands: Failed to closed inside the daily band, now appears to be getting stuck to the bottom
Trendline: Failed to retest the 8 day MA and also failed to retest 4h trendline. Is capitulation coming?
Daily Trend: Bear
Fractals: Down printed at $4,000. If that breaks, the next down fractal is at $3,559 however I do not expect that to hold due to the gap in the volume profile.
RSI: Since we have not gotten a divergence we can still make another leg down even though we are this oversold.
Stochastic: Recrossed bearish, very bad sign for bulls
Summary: Over the last couple days I have been buying spot BTC’ and longing ETH:USD while also shorting alts against BTC’. I then exited my long at a nominal loss and opened a short at a much worse price. May seem like bad trading but it actually brings up some important topics
that I haven’t talked enough about: position sizing, risk:reward and hedging.
Position Size: There is very big a difference between taking a large position and taking a small position. Each should be done when the circumstance calls for it. For example: great risk:reward and betting with the trend.
Risk:Reward: If retail business is “location, location, location” then I believe trading is risk:reward, risk:reward, risk:reward. If you are able to find positions with a 5:1 ratio, or better, then you don’t have to be right very often to crush any market.
Hedging: I do not do nearly as much of this as I should / could and it is something I intent to get better at. However sometimes there are trades that appear to be profitable by themselves as well as being a form of a hedge.
Do to what is outlined above I have been taking out large shorts on alts and I simply could not pass up buying the horizontal support of BTC’ and ETH’. I even tried signing up for a new exchange to leverage trade LTC:USD.
I was quick to get out after breaking down support and after seeing further action I liked (ETH’ appears to be breaking down horizontal support with a large gap in volume profile, whereas that is not the case for BTC’).
Happy Thanksgiving I love you all!
Note
This is starting to wreak of a fake breakdown. I am setting my stop loss at $126 and watching closely to see where we close. I have only entered a small position, and was planning on a medium - large. Now I feel much differently.
When markets move fast you have to be able to move fast as well as long as that is what your trading strategy calls for. Personally I am very comfortable taking paper-cut wounds when it appears highly likely that a big move is coming.
emasar Indicator is available for purchase at alphanalysis.io/product/emasar/
Disclaimer
The information and publications are not meant to be, and do not constitute, financial, investment, trading, or other types of advice or recommendations supplied or endorsed by TradingView. Read more in the Terms of Use.