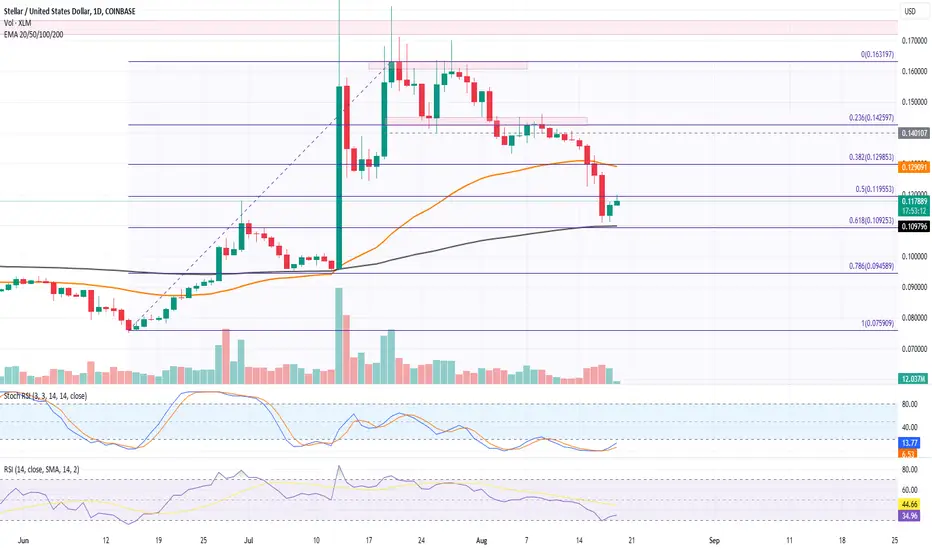
- XLM Price Reversal: The price reversed from the $0.14 resistance zone, resulting in a 20% drop to the 200-day EMA.
- Short Recovery Phase: After reaching the 200-day EMA, a short recovery phase of 4.71% occurred.
- Potential Crash: A breakdown below the 200-day EMA could crash the XLM price to $0.094.
- Sharp Correction: The retest of the $0.14 resistance level led to a sharp correction and a significant discount in Stellar coin price.
- Catalyzed Fall: The intense fall was accelerated by the retest phase and overall market correction.
- Breach of Support Levels: XLM price breached multiple support levels, including the 50-day EMA and 50% Fibonacci level.
- Short-Term Recovery: Absorbing the selling pressure, XLM set for a short-term recovery, extending to 4.12% in the last 48 hours.
- No-Trade Zone: The current recovery remains uncertain, and a breakout of specific Fibonacci levels will signal the next entry.
- Downtrend Continuation Risk: There are strong chances of a downtrend continuation with a potential bullish trap unless the recovery undermines the 10.42% drop bearish candle.
- Uptrend Possibility: If the uptrend breaks above the 50-day EMA, XLM prices may rechallenge for dominance at $0.142.
- Psychological Mark at Risk: A downfall below the 200-day EMA could endanger the $0.10 psychological mark, possibly reaching $0.094.
Disclaimer
The information and publications are not meant to be, and do not constitute, financial, investment, trading, or other types of advice or recommendations supplied or endorsed by TradingView. Read more in the Terms of Use.
Disclaimer
The information and publications are not meant to be, and do not constitute, financial, investment, trading, or other types of advice or recommendations supplied or endorsed by TradingView. Read more in the Terms of Use.