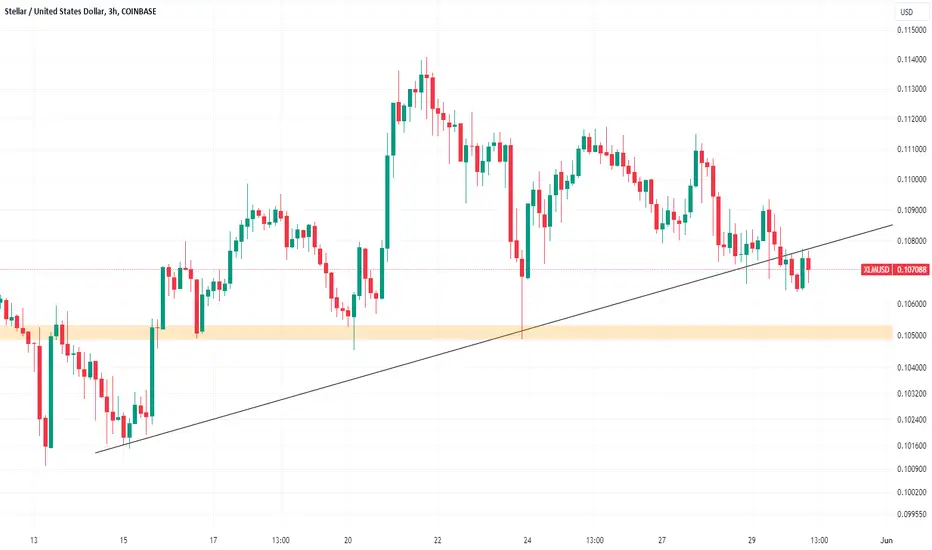
While people are busy posting bullish ideas, i'll share what people refuse to see and accept. this is a 4h chart, price has broken down below the support line, price has failed to go back above it, and the next support level is shown in orange color. while the uneducated say that the bottom is in, i do not approve or reject this notion, all i know is what i see in the chart. the chart must give us bullish signals first, but it isn't. XLM has been in a bear market since june 2021 (for 3 years). this chart cannot be in a bull market unless price surpasses 40-90 cents. traders will make money on the way up to 40-90 cents if it ever goes to those levels, but the investors and holders will get REKT waiting for new ATH.
Trade closed: target reached
Disclaimer
The information and publications are not meant to be, and do not constitute, financial, investment, trading, or other types of advice or recommendations supplied or endorsed by TradingView. Read more in the Terms of Use.
Disclaimer
The information and publications are not meant to be, and do not constitute, financial, investment, trading, or other types of advice or recommendations supplied or endorsed by TradingView. Read more in the Terms of Use.