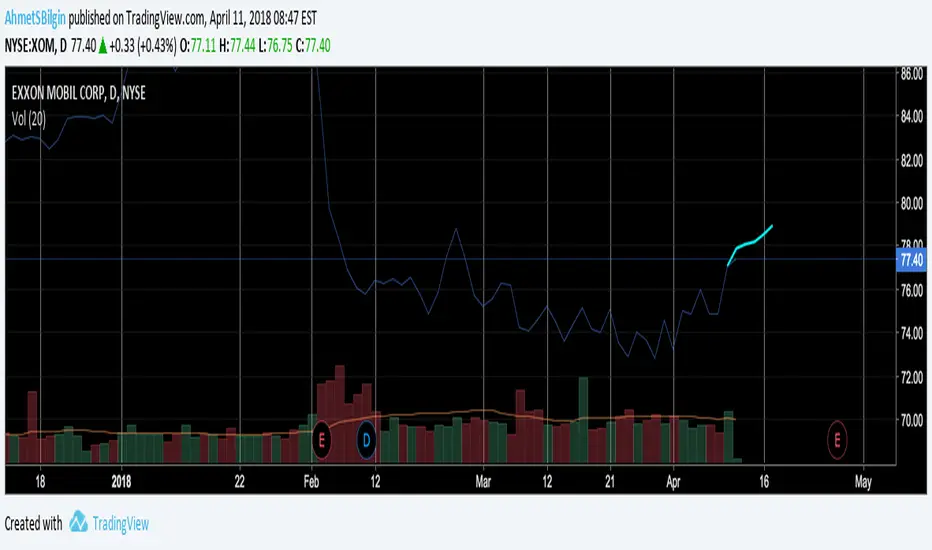
Artificial Intelligence/Deep Learning Enabled 5 Day Ahead Predicted values for Exxon Mobil Corp. ( XOM ) have been plotted on the chart.
The method used in this prediction is Deep Learning based, and using complex mathematical models/methodologies to extract hidden time series features in vast amounts of XOM related data.
The expected 5 Day Change is 2.435 %
Predictability Indicator is calculated as : 0.734
Predicted 5-Day Ahead Prices are as follows:
Wed Apr 11 Thu Apr 12 Fri Apr 13 Mon Apr 16 Tue Apr 17
77.895 78.084 78.197 78.534 78.947
Please note that outliers/non-linearities might occur, however our Artificial Intelligence/Deep Learning Enabled predictions indicate the softened/smoothed moving direction of the stocks/commodities/World indices/ETFs/Foreign Currencies/Cryptocurrencies.
Feel free to contact us for your questions.
Disclaimer
The information and publications are not meant to be, and do not constitute, financial, investment, trading, or other types of advice or recommendations supplied or endorsed by TradingView. Read more in the Terms of Use.
Disclaimer
The information and publications are not meant to be, and do not constitute, financial, investment, trading, or other types of advice or recommendations supplied or endorsed by TradingView. Read more in the Terms of Use.