1. Market Overview
Current Price: $2.1307
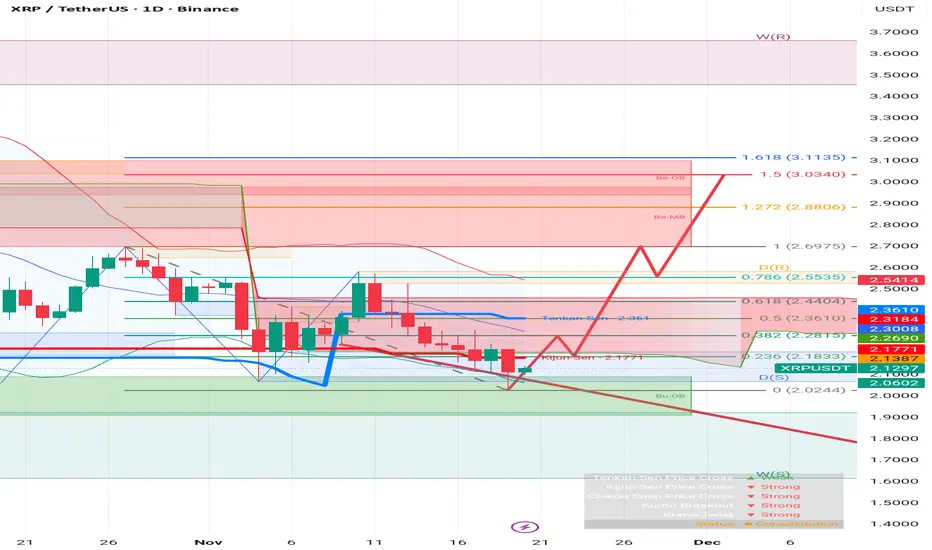
Trend Status: The market is currently in a consolidation phase (confirmed by the status panel in the bottom right) following a correction from the local high (LH).
Immediate Sentiment: Short-term bearish to neutral, attempting to find a floor at the support zone.
2. Key Support and Resistance Levels
Support (The Floor):
Primary Support ($2.02 - $2.06): The price recently wicked down to $2.0244 (marked as the 0 Fib level) and bounced. This area is reinforced by the top of the Green Order Block (Bu-OB) and the Daily Support line D(S).
Deep Support ($1.90): Below the current structure, there is a Weekly Support W(S) level at $1.9083. If the current low fails, this is the next major magnet for price.
Resistance (The Ceiling):
Immediate Resistance ($2.17 - $2.18): The price is currently struggling against the Kijun-Sen (Red Line) at $2.1771 and the 0.236 Fibonacci level at $2.1833.
Trendline Resistance: There is a steep red descending trendline connecting the recent lower highs. A breakout above this diagonal line is required to shift momentum.
Major Resistance ($2.36): The 0.5 Fibonacci level at $2.3610 coincides with the Tenkan-Sen (Blue Line). This is a "confluence zone" where multiple resistance factors meet.
3. Indicator Analysis
Fibonacci Retracement: The chart uses a retracement drawn from the recent low ($2.02) to the previous high ($2.69).
The price is currently trading below the 0.236 level, indicating that buyers are still weak.
To validate a reversal, bulls need to reclaim the 0.382 level ($2.28).
Ichimoku Cloud:
Tenkan vs. Kijun: The Tenkan-Sen (Blue) is above the price, and the Kijun-Sen (Red) is flat. The price is below both, which is generally a bearish signal for the short term.
Cloud (Kumo): The price appears to be interacting with the top of the green cloud. If the price stays above the green cloud, the long-term trend remains bullish.
4. The Projected Path (Red Zigzag Line)
The forecast path (the thick red line) anticipates a breakout above the descending trendline.
Target: It projects a rally towards the 1.5 Fib Extension ($3.03) and potentially the 1.618 Extension ($3.11).
Validity: For this path to play out, XRP must close a daily candle above $2.18 (breaking the immediate resistance) and subsequently $2.36 (breaking market structure).
Summary & Strategy
Bullish Scenario: Watch for a daily close above $2.1833. If this happens, the next target is the $2.36 region. The "Golden Pocket" (0.618 Fib) at $2.44 would be the confirmation zone for a return to the highs.
Bearish Scenario: If the price gets rejected at the Kijun-Sen ($2.1771) and fails to hold the recent low of $2.02, expect a drop into the deep green support zone around $1.90.
Current Price: $2.1307
Trend Status: The market is currently in a consolidation phase (confirmed by the status panel in the bottom right) following a correction from the local high (LH).
Immediate Sentiment: Short-term bearish to neutral, attempting to find a floor at the support zone.
2. Key Support and Resistance Levels
Support (The Floor):
Primary Support ($2.02 - $2.06): The price recently wicked down to $2.0244 (marked as the 0 Fib level) and bounced. This area is reinforced by the top of the Green Order Block (Bu-OB) and the Daily Support line D(S).
Deep Support ($1.90): Below the current structure, there is a Weekly Support W(S) level at $1.9083. If the current low fails, this is the next major magnet for price.
Resistance (The Ceiling):
Immediate Resistance ($2.17 - $2.18): The price is currently struggling against the Kijun-Sen (Red Line) at $2.1771 and the 0.236 Fibonacci level at $2.1833.
Trendline Resistance: There is a steep red descending trendline connecting the recent lower highs. A breakout above this diagonal line is required to shift momentum.
Major Resistance ($2.36): The 0.5 Fibonacci level at $2.3610 coincides with the Tenkan-Sen (Blue Line). This is a "confluence zone" where multiple resistance factors meet.
3. Indicator Analysis
Fibonacci Retracement: The chart uses a retracement drawn from the recent low ($2.02) to the previous high ($2.69).
The price is currently trading below the 0.236 level, indicating that buyers are still weak.
To validate a reversal, bulls need to reclaim the 0.382 level ($2.28).
Ichimoku Cloud:
Tenkan vs. Kijun: The Tenkan-Sen (Blue) is above the price, and the Kijun-Sen (Red) is flat. The price is below both, which is generally a bearish signal for the short term.
Cloud (Kumo): The price appears to be interacting with the top of the green cloud. If the price stays above the green cloud, the long-term trend remains bullish.
4. The Projected Path (Red Zigzag Line)
The forecast path (the thick red line) anticipates a breakout above the descending trendline.
Target: It projects a rally towards the 1.5 Fib Extension ($3.03) and potentially the 1.618 Extension ($3.11).
Validity: For this path to play out, XRP must close a daily candle above $2.18 (breaking the immediate resistance) and subsequently $2.36 (breaking market structure).
Summary & Strategy
Bullish Scenario: Watch for a daily close above $2.1833. If this happens, the next target is the $2.36 region. The "Golden Pocket" (0.618 Fib) at $2.44 would be the confirmation zone for a return to the highs.
Bearish Scenario: If the price gets rejected at the Kijun-Sen ($2.1771) and fails to hold the recent low of $2.02, expect a drop into the deep green support zone around $1.90.
Disclaimer
The information and publications are not meant to be, and do not constitute, financial, investment, trading, or other types of advice or recommendations supplied or endorsed by TradingView. Read more in the Terms of Use.
Disclaimer
The information and publications are not meant to be, and do not constitute, financial, investment, trading, or other types of advice or recommendations supplied or endorsed by TradingView. Read more in the Terms of Use.