Hey guys, XRP is navigating a tight compression zone on the 1-hour timeframe, trading at $2.07 and caught between critical moving average levels that are setting up a potential directional break. Price is sitting right on the EMA50 at $2.07, which has been acting as immediate support, but overhead we've got a resistance cluster formed by the EMA20 at $2.08, EMA200 at $2.09, and HMA55 also at $2.09. That's a lot of technical density above current price, and the repeated rejections from this zone over the past several hours suggest sellers are defending it aggressively. The 24-hour range spans from $2.01 to $2.12, and we're currently positioned in the lower half, about 6 cents off the highs and 6 cents above the lows.
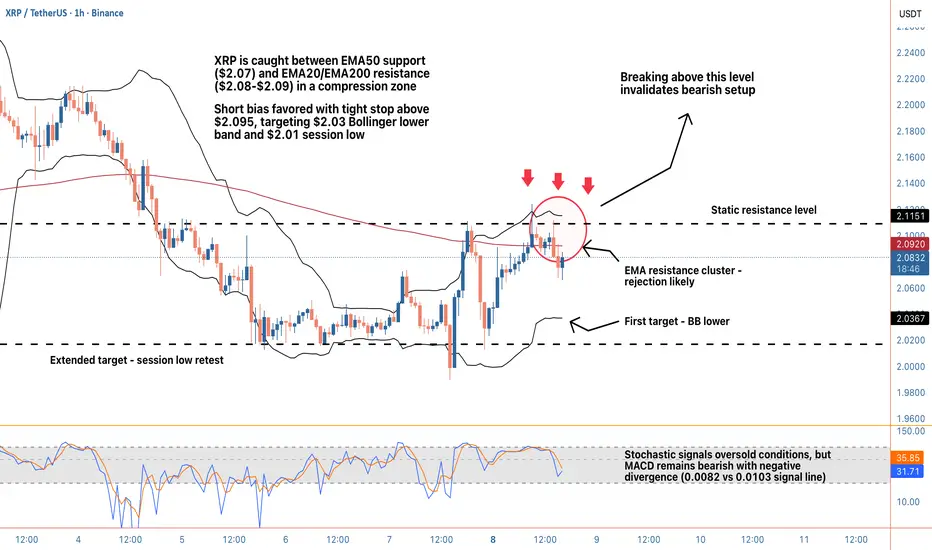
The technical indicator suite is painting a mixed but ultimately bearish picture. Stochastic has crashed to 12.2, firmly in oversold territory, which on the surface might suggest a bounce is overdue. However, context matters here. The MACD remains in bearish configuration with the MACD line at 0.0082 sitting below the signal line at 0.0103, indicating momentum hasn't shifted despite the oversold reading. RSI at 48.5 is neutral, not providing much directional conviction, but it's worth noting we're not seeing bullish divergence that would typically accompany a reversal setup. The ADX at 33.5 confirms we're in a moderate trending environment rather than choppy consolidation, and when you combine that with the lower high formation visible in recent price structure, the trend bias leans bearish.
Volume analysis is critical here and it's telling a bearish story. Current volume sits at just $10.8M, roughly 50% below the average of $21.5M. That lack of participation during this consolidation phase suggests buyers aren't showing up with conviction, even at these relatively attractive levels. When price compresses near support without volume expansion, it often precedes a breakdown rather than a reversal. The wick analysis adds another layer: lower wicks comprise 55.5% of recent candle structures, showing there have been attempts to bid price higher, but the minimal 7.3% upper wicks tell us those rallies are getting faded quickly. That's classic distribution behavior where each bounce gets sold into.
Bollinger Bands provide additional context for potential targets. Price is currently trading just below the middle band at $2.07, with the upper band at $2.11 and lower band at $2.03. The bands are relatively tight, suggesting we're in a consolidation phase that's likely to resolve with a directional move soon. The MFI (Money Flow Index) at 43.0 sits below the midpoint, confirming that money flow is leaning negative but not extreme. This supports the thesis of a measured grind lower rather than a panic sell-off.
From a price structure perspective, the lower high formation is the key bearish signal. After tagging $2.12 in the 24-hour session, price has failed to reclaim that level and instead printed a lower high, which is textbook bearish price action. The internal market state shows a bearish bias with a trending regime and only 26.4% directional confidence, suggesting the move might not be explosive but rather a methodical drift lower. The alignment score of 4 and the bear stack dominating (4 bearish indicators vs 1 bullish) reinforce this directional lean.
For a trading setup, I'm looking at short entries on any bounce toward the $2.075-$2.08 zone, particularly if we see rejection wicks forming at the EMA20. The stop loss would sit just above the resistance cluster at $2.095, providing about 20 pips of breathing room while staying below the HMA55. A close above $2.095 would invalidate the bearish structure and suggest buyers are regaining control, so that's a logical invalidation point. First take profit target comes in at the Bollinger lower band at $2.03, offering approximately 4.5 cents of downside for roughly 2 cents of risk, which delivers better than 2:1 risk-reward. Second target would be the session low at $2.01, extending the potential reward to nearly 3.5:1 if we get full follow-through and momentum acceleration.
The key level to watch is $2.07, where the EMA50 and Bollinger middle band converge. If price breaks and holds below this level with volume confirmation, I'd expect acceleration toward $2.03 as there's minimal structural support in between. Conversely, if bulls want to flip the script, they need to reclaim $2.09 with conviction and push volume above that $21.5M average to prove there's genuine buying interest rather than just short-term bounce attempts. The 24-hour change of +1.41% shows we're still in positive territory for the day, but the intraday structure has deteriorated, and the failure to hold the EMA20 is a warning sign.
Risk management is crucial in this setup given the mixed signals from oversold indicators. While Stochastic at 12.2 suggests we're technically due for a bounce, trading against established bearish structure and weak volume is risky. The safer play is waiting for either a confirmed breakdown below $2.07 or a clear rejection from the $2.08-$2.09 resistance zone. If you're already short from higher levels, consider taking partial profits at $2.03 and trailing stops on the remainder toward $2.01. If you're looking to enter fresh, patience for a bounce into resistance offers better risk-reward than chasing current levels.
What are you thinking on this XRP setup? Are you fading the weakness for a bounce play off EMA50 support, or riding the bearish structure down toward those lower targets?
Join our channel:
🔵 t.me/MonoCoin_Public
🟠 t.me/MonoCoin_Public
🔵 t.me/MonoCoin_Public
🟠 t.me/MonoCoin_Public
🔵 t.me/MonoCoin_Public
🟠 t.me/MonoCoin_Public
🔵 t.me/MonoCoin_Public
🟠 t.me/MonoCoin_Public
Related publications
Disclaimer
The information and publications are not meant to be, and do not constitute, financial, investment, trading, or other types of advice or recommendations supplied or endorsed by TradingView. Read more in the Terms of Use.