S&P 500 Daily Chart Analysis For Week of Jan 9, 2026Technical Analysis and Outlook:
During the inaugural trading session of the New Year, the S&P 500 Index is demonstrating a pronounced bullish sentiment. The Index has successfully breached the critical Key Resistance level at 6,932 and has also retested the completed Outer Index Rally at 6,945. It is anticipated that the Index will continue its upward trajectory toward the subsequent target of Outer Index Rally 7,026.
Nonetheless, it is crucial to acknowledge that, given prevailing market conditions, there is a significant likelihood of steady to lower pullbacks before the Index successfully achieves the Outer Index Rally target of 7,026. However, the market participants need to be aware that this event will trigger a price action in Force Retracement to the attainable Mean Support level of 6,922.
Indices

ASX Bulls Eye 8800ASX futures were higher for a third consecutive session by Thursday’s US close. The daily RSI is curling higher from the 50 level, signalling positive momentum without nearing overbought territory and confirming the near-term bullish structure.
Support has also been found above the monthly pivot point, along with the 20-day and 50-day EMAs. Volumes remain subdued, though this is likely a seasonal effect.
The bias is for a move towards 8,800 — near the December high, monthly R1 pivot and November VPOC — while prices hold above the recent daily swing low.
Matt Simpson, Market Analyst at City Index.

DJI M30 RSI Reset and Bullish Mean Reversion Setup📝 Description
Dow Jones on M30 is still trading inside a bullish HTF context. After the recent corrective drop, RSI has fully reset and is now sitting in a zone that historically aligns with price reversals to the upside. This tells us downside momentum is exhausted and the market is getting ready for a bounce.
________________________________________
📈 Signal / Analysis
Primary Bias: Bullish while holding above 48,800
Long Setup (Preferred):
• Entry (Buy): 48,820 (HTF FVG)
• Stop Loss: Below 48,750
• TP1: 48,930
• TP2: 49,075
• TP3: 49,230
________________________________________
🎯 ICT & SMC Notes
• RSI in reset / reversal zone
• Corrective move, not impulsive selling
• Price holding near HTF FVG support
________________________________________
🧩 Summary
With RSI showing exhaustion of sellers, the market looks ready for an upside rotation. As long as price remains above the current support, the probability favors a bullish continuation toward higher liquidity levels.
________________________________________
🌍 Fundamental Notes / Sentiment
Strong ISM Services supports economic strength and favors upside in the Dow. Softer JOLTS does not challenge the bullish trend, with pullbacks likely offering continuation opportunities.
________________________________________
⚠️ Risk Disclosure
Trading involves substantial risk and may result in capital loss. This analysis is for educational purposes only and does not constitute financial advice. Always apply proper risk management, predefined stop-loss levels, and disciplined position sizing aligned with your trading plan.

NASDAQD1 FVG
And why I’m expecting price to hit the H4 order block?
Because lit bit below it is discount.
Else we will trade what we see not what we think 💭 if the D1 holds that means the H4 CISD holds too so the bullish momentum will keep pushing because it’s NPF week.

US2000 H4 | Bullish bounce offBased on the H4 chart analysis, we could see the price fall to our buy entry level at 2,538.01, which is a pullback support that aligns with the 50% FIbonacci retracement.
Our stop loss is set at 2,504.43, which is a pullback support that aligns with the 78.6% Fibonacci retracement.
Our take profit is set at 2,589.09, which is a pullback resistance.
High Risk Investment Warning
Stratos Markets Limited (

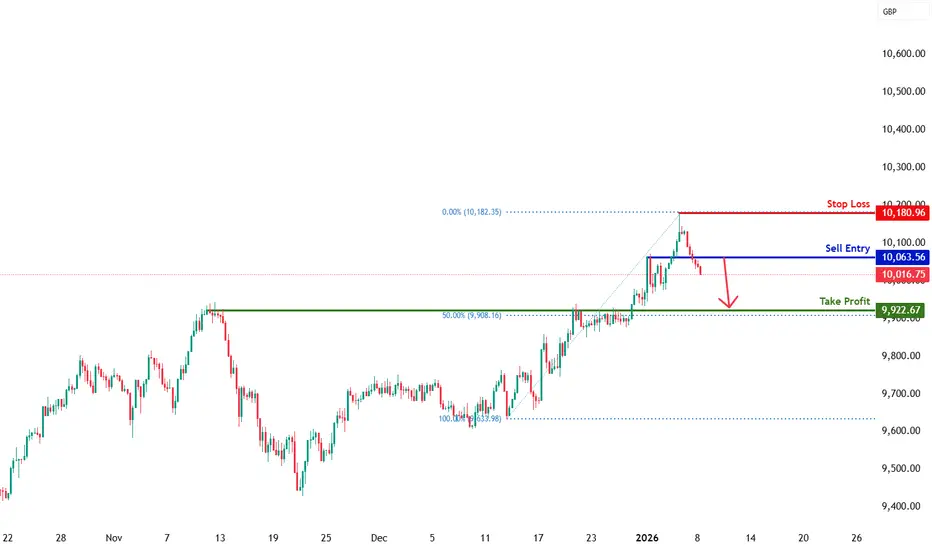
UK100 H4 | Bearish dropBased on the H4 chart analysis, we can see that the price has reacted off our sell entry level at 10,063.56, which is a pullback resistance.
Our stop loss is set at 10,180.96, which is a swing high resistance.
Our take profit is set at 9,922.67, which is a pullback support that aligns with the 50% Fibonacci retracement.
High Risk Investment Warning
Stratos Markets Limited (
JPN225 H4 | Falling Towards Overlap SupportThe price is falling towards our buy entry level at 50,969.39, which is an overlap support that is slightly above the 78.6% Fibonacci retracement.
Our stop loss is set at 50,257.10, which acts as an overlap support that aligns with the 61.8% Fibonacci retracement.
Our take profit is set at 52,156.53, which is a pullback resistance.
High Risk Investment Warning
Stratos Markets Limited (

GE40 (DAX): Structural Breakout — Bulls Targeting 25,000
Macro Environment: Investors are currently digesting a "Santa Rally" while eyeing the upcoming Fed Minutes for clues on 2026 monetary policy. Despite thin year-end liquidity, the technical structure remains exceptionally bullish as fiscal reform optimism offsets manufacturing weakness.
Technical Analysis
The H4 chart reveals a decisive shift in market regime:
The Breakout: Price has cleared a multi-month descending trendline and a major horizontal ceiling at 24,400.
Base Formation: A clean accumulation zone (grey box) acted as a launchpad, confirming strong institutional demand at lower levels.
Momentum: The successful flip of previous resistance into support suggests a "Buy the Dip" environment.
Order Swing Set-up: LONG
Entry: 24,476 (Ideally on a retest of the breakout level)
Take Profit: 25,006 (Key psychological level & measured move target)
Stop Loss: 24,195 (Protected below the recent consolidation base)
Risk/Reward Ratio: ~ 1:1.8
⚠️ DISCLAIMER: This post is for educational purposes and personal opinion only; it is not financial advice. Trading indices involves significant risk, especially during low-liquidity holiday periods. Please Do Your Own Research (DYOR) and manage your risk strictly.

Falling towards 38.2% Fib support?UK100 is falling towards the pivot, which acts as a pullback support that aligns with the 38.2% Fibonacci retracement and could bounce to the swing high resistance.
Pivot: 10,041.77
1st Support: 9,957.95
1st Resistance: 10,153.83
Disclaimer:
The opinions given above constitute general market commentary and do not constitute the opinion or advice of IC Markets or any form of personal or investment advice.
Any opinions, news, research, analyses, prices, other information, or links to third-party sites contained on this website are provided on an "as-is" basis, are intended to be informative only, and are not advice, a recommendation, research, a record of our trading prices, an offer of, or solicitation for, a transaction in any financial instrument and thus should not be treated as such. The information provided does not involve any specific investment objectives, financial situation, or needs of any specific person who may receive it. Please be aware that past performance is not a reliable indicator of future performance and/or results. Past performance or forward-looking scenarios based upon the reasonable beliefs of the third-party provider are not a guarantee of future performance. Actual results may differ materially from those anticipated in forward-looking or past performance statements. IC Markets makes no representation or warranty and assumes no liability as to the accuracy or completeness of the information provided, nor any loss arising from any investment based on a recommendation, forecast, or any information supplied by any third party

US30 H4 | Falling Towards 50% Fib SupportThe price could fall towards our buy entry level at 48,450.28, which is a pullback support that aligns with the 61.8% Fibonacci retracement.
Our stop loss is set at 47,860.43, a multi-swing low support
Our take profit is set at 49,396.96, which aligns with the 161.8% Fibonacci extension.
High Risk Investment Warning
Stratos Markets Limited (

Bullish bounce off?US100 has bounced off the support level, which is an overlap support that aligns with the 50% Fibonacci retracement and could bounce from this level to our take profit.
Entry: 25,253.06
Why we like it:
There is a pullback support level that aligns with the 78.6% Fibonacci retracement.
Stop loss: 24.919.12
Why we like it:
There is a pullback support that aligns with the 78.6% Fibonacci retracement.
Take profit: 25,837.82
Why we like it:
There is a pullback resistance level
Enjoying your TradingView experience? Review us!
Please be advised that the information presented on TradingView is provided to Vantage (‘Vantage Global Limited’, ‘we’) by a third-party provider (‘Everest Fortune Group’). Please be reminded that you are solely responsible for the trading decisions on your account. There is a very high degree of risk involved in trading. Any information and/or content is intended entirely for research, educational and informational purposes only and does not constitute investment or consultation advice or investment strategy. The information is not tailored to the investment needs of any specific person and therefore does not involve a consideration of any of the investment objectives, financial situation or needs of any viewer that may receive it. Kindly also note that past performance is not a reliable indicator of future results. Actual results may differ materially from those anticipated in forward-looking or past performance statements. We assume no liability as to the accuracy or completeness of any of the information and/or content provided herein and the Company cannot be held responsible for any omission, mistake nor for any loss or damage including without limitation to any loss of profit which may arise from reliance on any information supplied by Everest Fortune Group.

[NL25](AEX) - Bullish Trendline Breakout - LONG SetupThe Netherlands 25 (AEX) has finally broken its long-term descending trendline! We are seeing a clear shift in market structure on the 4H timeframe. Is this the start of a New Year rally?
Breakout: Price has decisively closed above the primary descending trendline.
Support Flip: The previous resistance at 952.00 is now acting as a solid support base.
Momentum: Higher highs and higher lows are forming, confirming a bullish transition.
Long Setup
Entry: 951.94
Stop Loss (SL): 938.14 (Below the accumulation zone)
Take Profit 1 (TP1): 968.45
Take Profit 2 (TP2): 977.25
Risk/Reward Ratio: ~1:1.9
⚠️ Disclaimer: Trading financial instruments involves significant risk of loss and is not suitable for every investor. This post is for educational and informational purposes only and does not constitute financial advice. Past performance is not indicative of future results. Always perform your own due diligence and manage your risk strictly.

S&P 500 Daily Chart Analysis For Week of Jan 2, 2026Technical Analysis and Outlook:
During this abbreviated New Year's trading session, the S&P 500 Index is currently continuing to demonstrate an In Force Retracement sentiment. The Index has established a new Mean Support level at 6,833, and it is anticipated that it will persist in its downward trajectory towards the subsequent Mean Support level at 6,877.
It is imperative to recognize that, given the conditions of the market, there exists a considerable probability of a Dead-Cat rebound. This rebound may prompt a retest of the completed Outer Index Rally at 6,945, via the Key Resistance identified at 6,932.
Additionally, it is expected that the prevailing downward sentiment will remain or may even deepen, and intermediate bearish momentum is likely to persist, particularly as the above-named target levels realign with the anticipated market trajectory.

Bearish Supply Zone On NASAQTwo Supply Zones, one in the extreme at the External high, and the other in the Internal High.
Could get a reaction from the internal high and continue to plough through to the extreme zone, or we could get a confirmation signal from that zone and continue with the bearish trend.

GER30 H4 | Bullish Momentum To Extend FurtherBased on the H4 chart analysis, we could see the price fall to our buy entry at 24,474.21, which is a pullback support that 23.6% Fibonacci retracement.
Our stop loss is set at 24,195.24, which is a pullback support that aligns with the 61.8% Fibonacci retracement.
Our take profit is set at 24,786.98, which is a swing high resistance that is slightly below the 161.8% Fibonacci extension.
High Risk Investment Warning
Stratos Markets Limited (

US2000 H4 | Falling Towards Key SupportThe price is falling towards our buy entry level at 2,479.37, which is an overlap support that aligns with the 38.2% Fibonacci retracement.
Our Stop loss is set at 2,449.15, which aligns with the 50% Fibonacci retracement.
Our take profit is set at 2,538.48, which is a pullback resistance.
High Risk Investment Warning
Stratos Markets Limited (

UK100 H4 | Bullish BreakoutThe price is falling towards our buy entry level at 9,923.57, which is an overlap support.
Our stop loss is set at 9,832.64, which is an overlap support.
Our take profit is set at 10,059.96, which aligns with the 61.8% Fibonacci projection.
High Risk Investment Warning
Stratos Markets Limited (

JPN225 H4 | Bullish Bounce OffThe price has bounced off our buy entry level at 50,261.74, which is an overlap support.
Our stop loss is set at 49,846.21, which is an overlap support.
Our take profit is set at 51,425.25, which is a pullback resistance.
High Risk Investment Warning
Stratos Markets Limited (

Bullish breakout?GER40 is falling towards the support level which is a pullback support and could bounce from this level to our take profit.
Entry: 24,502.39
Why we like it:
There is a pullback support level.
Stop loss: 24,236.74
Why we like it:
There is a pullback support level.
Take profit: 25,145.30
Why we like it:
There is a resistance level at the 78.6% Fibonacci projection.
Enjoying your TradingView experience? Review us!
Please be advised that the information presented on TradingView is provided to Vantage (‘Vantage Global Limited’, ‘we’) by a third-party provider (‘Everest Fortune Group’). Please be reminded that you are solely responsible for the trading decisions on your account. There is a very high degree of risk involved in trading. Any information and/or content is intended entirely for research, educational and informational purposes only and does not constitute investment or consultation advice or investment strategy. The information is not tailored to the investment needs of any specific person and therefore does not involve a consideration of any of the investment objectives, financial situation or needs of any viewer that may receive it. Kindly also note that past performance is not a reliable indicator of future results. Actual results may differ materially from those anticipated in forward-looking or past performance statements. We assume no liability as to the accuracy or completeness of any of the information and/or content provided herein and the Company cannot be held responsible for any omission, mistake nor for any loss or damage including without limitation to any loss of profit which may arise from reliance on any information supplied by Everest Fortune Group.

S&P500 H4 | Bullish Bounce Off Pullback SupportThe price is falling towards our buy entry level at 6,860.35, which is a pullback suport that aligns with the 38.2% Fibonacci retracement.
Our stop loss is set at 6,791.64, which is a pullback support that is slightly below the 61.8% Fibonacci retracement.
Our take profit is set at 6,945.99, which is a swing high resistance.
High Risk Investment Warning
Stratos Markets Limited (

AUS200 H4 | Bullish BounceThe price is falling towards our buy entry at 8,670.62, which is a pullback support that aligns with the 50% Fibonacci retracement.
Our stop loss is at 8.605.17, which is a pullback suport that aligns with the 78.6% Fibonacci retracement.
Our take profit is at 8,803.69, which acts as a swing high resistance.
High Risk Investment Warning
Stratos Markets Limited (

Falling towards 50% Fib support?US100 is falling towards the support levle which has been identified as an overlap support that aligns with the 50% Fibonacci retracement and could bounce from this level to our take profit.
Entry: 25,253.06
Why we like it:
There is an overlap support that aligns with the 50% Fibonacci retracement.
Stop loss: 24,919.12
Why we like it:
There is a pullback support level that aligns with the 78.6% Fibonacci retracement.
Take profit: 25,723.79
Why we like it:
There is a pullback resistance level.
Enjoying your TradingView experience? Review us!
Please be advised that the information presented on TradingView is provided to Vantage (‘Vantage Global Limited’, ‘we’) by a third-party provider (‘Everest Fortune Group’). Please be reminded that you are solely responsible for the trading decisions on your account. There is a very high degree of risk involved in trading. Any information and/or content is intended entirely for research, educational and informational purposes only and does not constitute investment or consultation advice or investment strategy. The information is not tailored to the investment needs of any specific person and therefore does not involve a consideration of any of the investment objectives, financial situation or needs of any viewer that may receive it. Kindly also note that past performance is not a reliable indicator of future results. Actual results may differ materially from those anticipated in forward-looking or past performance statements. We assume no liability as to the accuracy or completeness of any of the information and/or content provided herein and the Company cannot be held responsible for any omission, mistake nor for any loss or damage including without limitation to any loss of profit which may arise from reliance on any information supplied by Everest Fortune Group.

QQQ (NQ-US100) Weekly Prediction – Outlook (21 DEC)QQQ (NQ-US100) Weekly Prediction – Outlook (21 DEC)
📊 Market Sentiment
Market sentiment turned fully bullish after the CPI data came in significantly lower than expected on Thursday. While the consensus expectation was 3.1%, the actual CPI print came at 2.7%, representing a meaningful downside surprise.
This data does not directly determine the outcome of the January FED meeting, as another CPI report will be released on January 13, 2026, which will be far more critical for the FED’s decision making process. However, the current soft inflation trend increased the probability of another lower CPI reading in January, which positively impacted risk sentiment across markets.
📈 Technical Analysis
Last week’s QQQ analysis played out perfectly. I hope you were able to capitalize on it. Price reversed precisely from the levels we anticipated following the CPI release. I am linking last week’s QQQ weekly analysis below for reference.
After the CPI data, price transitioned back into a clean bullish structure on both the daily and weekly timeframes. On Friday, QQQ rallied impulsively and closed the week with strong bullish momentum.
Overall, I think the market structure supports bullish continuation.
📌 Game Plan
I think QQQ may directly test 618.5 (Target 1) early in the week, followed by a move toward 625.75. These are the two bullish targets I expect to be reached within this week.
Price may also move toward these targets without any meaningful retracement. I plan to close one third of my call options at 618.5 and the remaining portion at 625.75 from the positions I am holding since Thursday.
If price pulls back to 611.75 or 607 before reaching 625.75 and prints strong 1H or 4H bullish candle closes, I will look to add new call option positions targeting 625.75.
In the event of a developing bearish structure, I will provide updates. However, at this stage, I do not see any clear bearish signals.
💬 For deeper sentiment and strategy insights, subscribe to my Substack free access available.
This analysis is for educational purposes only and does not constitute financial advice. Always conduct your own research before trading or investing.
