ASX 200 Bulls Eye 8800 as Support Holds Near 8700Sometimes simplicity is key. While the SPI 200 (ASX 200 futures) chart has been within a particularly choppy range these past few weeks, I suspect bulls may be accumulating near the lows. Notice the false break of the July low on 2 October, before Friday’s daytime low then respected that level as su
ASX SPI 200 Index Futures
No trades
No trades
Compare with ASX SPI 200 Index Futures
SPI 200 Bulls Tease Break of 200-day MAsAs we’ve already seen a sizeable selloff on the SPI 200 (ASX 200 futures chart), with support found around 8700, I’m seeking another leg higher.
But it is worth noting that corrective price behaviour can be more erratic and choppy than trending moves, like we saw during the selloff. Therefore, we’r
$xjo fute hits 1: ratio for a bounce... part of an ABC move, thus far we have reached an equality swing downhill (C) against the larger weekly uptrend, almost a fake-out move into new altime highs then what looks like a fail, but that prices in aggregate cannot fail, there is an odds-on chance we are completing a protection sell, but,
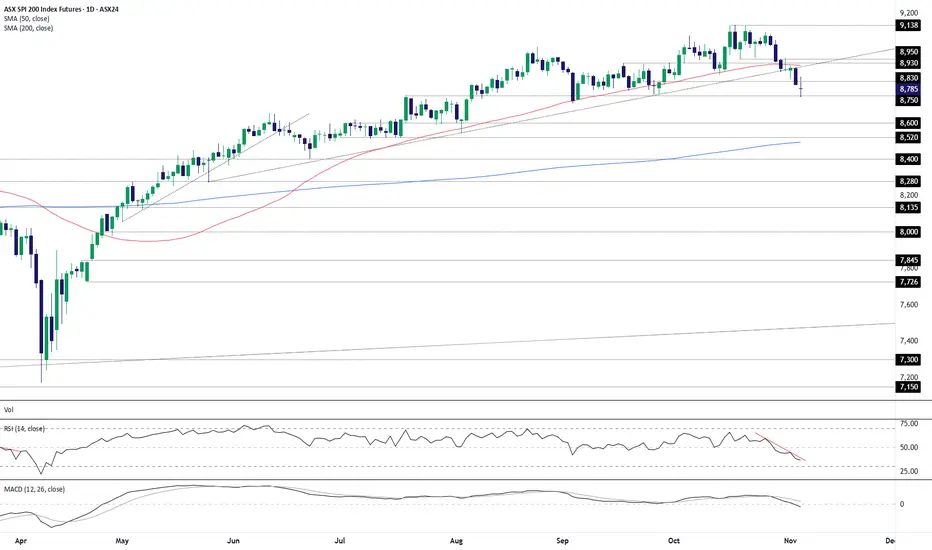
Breakdown risk buildingAustralian ASX 200 SPI futures are testing the key 200DMA after breaking out of the ascending channel they had been trading within since late November. With momentum beginning to swing to the downside, traders should be alert to the risk of a more prolonged unwind ahead. Price action into the close
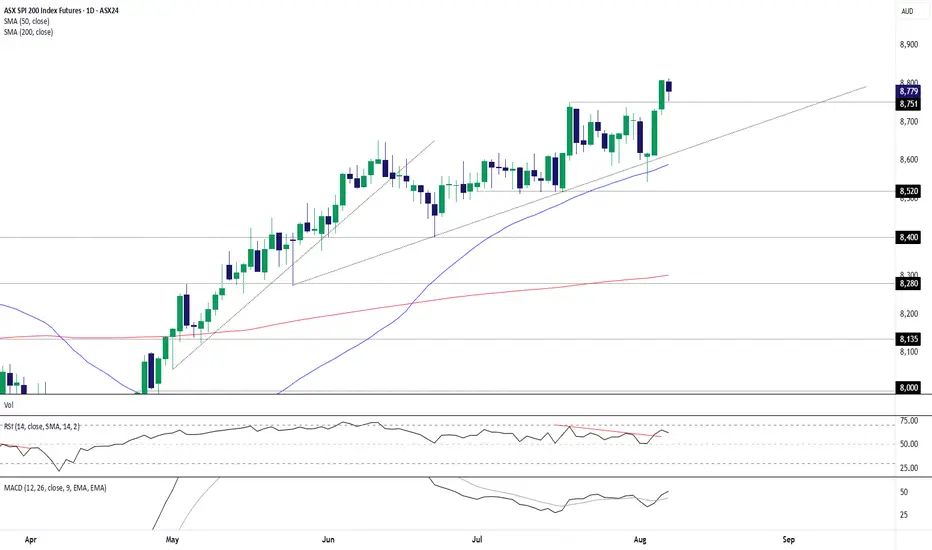
ASX Bulls Eye 8800ASX futures were higher for a third consecutive session by Thursday’s US close. The daily RSI is curling higher from the 50 level, signalling positive momentum without nearing overbought territory and confirming the near-term bullish structure.
Support has also been found above the monthly pivot po
ASX SPI: Bounce Like It’s 2025?The second downside target of the short trade in ASX 200 SPI futures discussed last Friday has now been achieved, prompting a reassessment: hold, add, square, or flip?
The uptrend that had been in place since late May finally gave way after a brief period of indecision. The subsequent bearish move
ASX SPI futures test key uptrend as bears circleAustralian ASX 200 SPI futures look vulnerable, with bearish signals continuing to pile up on the charts.
On the left-hand side, we can see price trading beneath the 50-day moving average, a level it bounced from strongly when tested earlier in the year. Having closed beneath it on Thursday, anothe
ASX 200 Futures: Back-Test Bounce Keeps Bulls in ControlASX 200 futures remain a buy-on-dips prospect, putting the contract on track to test the 9000 level soon.
Already sitting in an established uptrend, the latest leg higher coincided with a three-candle morning star pattern being completed on Tuesday, providing a bullish signal that goes some way to
ASX 200 Looks Set to BounceThe ASX 200 has drifted lower since its latest record high was set six days ago. 8500 held as support before doji formed on Tuesday to mark a false break of this key level. ASX 200 futures also tried but failed to break beneath it overnight.
Given the bullish divergence on the 1-hour RSI (14) and
Markets rally as missiles fly | how long can risk be ignored? Markets may be underpricing Israel and Iran risk.
Despite continued fighting—including high-impact strikes and rising casualties—global equities moved higher to start the week.
U.S. indices led the advance, with the Nasdaq gaining 1.5%, followed by the S&P 500 and Dow. Earlier in the session, Eu
See all ideas
Summarizing what the indicators are suggesting.
Neutral
Neutral
Neutral
A representation of what an asset is worth today and what the market thinks it will be worth in the future.
Displays a symbol's price movements over previous years to identify recurring trends.
Frequently asked questions
The current price of ASX SPI 200 Index Futures is 8,835 AUD — it has fallen −0.21% in the past 24 hours. Watch ASX SPI 200 Index Futures price in more detail on the chart.
The volume of ASX SPI 200 Index Futures is 11.61 K. Track more important stats on the ASX SPI 200 Index Futures chart.
Open interest is the number of contracts held by traders in active positions — they're not closed or expired. For ASX SPI 200 Index Futures this number is 270.46 K. You can use it to track a prevailing market trend and adjust your own strategy: declining open interest for ASX SPI 200 Index Futures shows that traders are closing their positions, which means a weakening trend.
Buying or selling futures contracts depends on many factors: season, underlying commodity, your own trading strategy. So mostly it's up to you, but if you look for some certain calculations to take into account, you can study technical analysis for ASX SPI 200 Index Futures. Today its technical rating is buy, but remember that market conditions change all the time, so it's always crucial to do your own research. See more of ASX SPI 200 Index Futures technicals for a more comprehensive analysis.