BITCOIN: One Last Drop And Then On The Way $200,000Dear Traders,
In our previous analysis, we predicted a price drop from 100k to 60k through multiple analyses. This prediction has come true as the price is currently plummeting sharply. We believe the price will likely fall between 63k and 58k, which would be ideal for swing buyers and a potential high volume zone.
We anticipate a final drop before the price reverses and potentially reaches a record high. Our initial targets are $100k, $150k and ultimately $200k. This is likely to be a significant reversal.
Please like and comment for more updates. Also, follow us for the latest news.
Team Setupsfx_
Supply and Demand

XAUUSD (Gold) – 1H Support Reaction After Sharp SelloffAfter a strong rejection from the higher resistance area, price made a sharp bearish correction into a major support zone. Current reaction suggests a possible relief bounce, but structure remains corrective unless resistance is reclaimed.
Major Support: 4760 – 4800
Recovery Resistance: 5050 – 5120
Higher Resistance: 5350 – 5400
Market is in a corrective phase. Watch for support hold and breakout above resistance to confirm recovery continuation. Risk management is essential.

XAUUSD Long: Defends Trend Support, Targeting $5,190 SupplyHello traders! Here’s a clear technical breakdown of XAUUSD (2H) based on the current chart structure. Gold remains in a broader bullish environment after a strong impulsive move that developed from a well-defined accumulation range. Following this consolidation phase, price broke to the upside and began respecting a rising trend line, confirming sustained buyer control and healthy trend conditions. During the advance, multiple bullish breakouts occurred above prior resistance levels, each followed by continuation, reinforcing the strength of the underlying trend. This bullish leg ultimately pushed price into a major Supply Zone around 5,190, where upside momentum began to stall.
Currently, at the supply area, Gold faced strong selling pressure, leading to a sharp pullback and the formation of a descending supply line, signaling short-term corrective pressure within the broader uptrend. Price then dropped toward a key Demand Zone near 4,940, which aligns closely with the rising trend line and a previous breakout structure. This confluence of horizontal demand and dynamic trend support makes the zone technically significant. The recent decline appears corrective rather than impulsive, suggesting profit-taking and short-term distribution instead of a full trend reversal.
My scenario: as long as XAUUSD holds above the 4,940 Demand Zone and continues to respect the rising trend line, the broader bullish structure remains intact. A sustained reaction from this demand area could lead to a recovery move back toward the 5,190 Supply Level (TP1). A clean breakout and acceptance above this supply would confirm bullish continuation and open the door for further upside expansion. However, a decisive breakdown below the demand zone and trend line would invalidate the bullish bias and signal a deeper corrective phase. For now, Gold is at a key decision area, with buyers attempting to defend structure and resume the broader uptrend. Manage your risk!

EURUSD Short: Rally Stalls at Supply - Key Reaction Near 1.1800Hello traders! Here’s a clear technical breakdown of EURUSD (1H) based on the current chart structure. EURUSD has recently completed a notable structural shift after trading within a well-defined descending channel. During this phase, price consistently respected the falling resistance and printed lower highs and lower lows, confirming short-term bearish control. This bearish structure eventually reached a key pivot low, where selling pressure weakened and buyers began to step in. From this pivot point, EURUSD broke out of the descending channel, signaling the end of the corrective phase and the start of a bullish recovery.
Currently, EURUSD is pulling back from the supply area along the descending supply line, indicating a corrective retracement rather than a full trend reversal. Below the current price, the Demand Zone near 1.1800 stands out as a key level. This zone represents previous resistance turned support and aligns with the base of the impulsive move, making it a critical area for buyers to defend.
My primary scenario favors a pullback toward the 1.1800 Demand Zone while price remains below the descending supply line and the 1.1880–1.1900 Supply Zone. A controlled retracement into demand could provide a healthy correction within the broader bullish recovery structure, potentially setting the stage for another upside attempt. However, a strong rejection from the supply line followed by a clean breakdown and acceptance below 1.1800 would invalidate the bullish recovery scenario and signal a return to bearish pressure. Conversely, a decisive breakout and acceptance above the 1.1900 Supply Zone would confirm bullish continuation and open the door for further upside expansion. For now, EURUSD is at a key decision point, and patience is required as price reacts between supply and demand. Manage your risk!

BITCOIN Rebuy Zone (1D)Honestly, the major and most critical support levels have already been lost, which significantly changes the overall market structure. Given the current price behavior, the pressure from sellers, the decline in momentum, and the way recent candles are forming, it appears that the ongoing bearish wave is likely to reach its completion within the green zone highlighted on the chart.
This bearish move is not something that will resolve quickly. It requires time, consolidation, and proper base-building before the market can attempt a sustainable reversal to the upside. A healthy move upward will only be possible after the market absorbs selling pressure and establishes a solid local bottom in this area.
From a trading perspective, the green zone should be treated as an accumulation area rather than a point for aggressive entries. The preferred strategy in this region is to enter positions gradually using a DCA (Dollar-Cost Averaging) approach, while strictly avoiding impatience and emotional decisions. Trying to catch an exact bottom or rushing into full-size positions can lead to unnecessary risk.
At this stage, capital preservation is more important than chasing profits. Proper risk management and position sizing are essential, as they remain the most critical elements for surviving and succeeding in this market environment.
If you have a coin or altcoin you want analyzed, first hit the like button and then comment its name so I can review it for you.
This is not a trade setup, as it has no precise stop-loss, stop, or target. I do not publish my trade setups here.

QNT Analysis (1D)From the point where we placed the green arrow on the chart, QNT has started to form a triangle.
Currently, QNT appears to be in wave b of wave D of this triangle.
Wave b of D seems to be a diametric, and only the final wave of this diametric, wave g, remains.
Within the red zone, one can look for sell/short positions.
After the completion of wave b of D, a bearish move is expected to form wave c of D.
targets : 71.43$ _ 64.39$ _ 58.69$
A daily candle close above the invalidation level will invalidate this analysis.
For risk management, please don't forget stop loss and capital management
When we reach the first target, save some profit and then change the stop to entry
Comment if you have any questions
Thank You

EURUSD: Support & Resistance Analysis for Next Week 🇪🇺🇺🇸
Here is my latest structure analysis and important supports & resistances
for EURUSD for next week.
Consider these structures for pullback/breakout trading.
❤️Please, support my work with like, thank you!❤️
I am part of Trade Nation's Influencer program and receive a monthly fee for using their TradingView charts in my analysis.

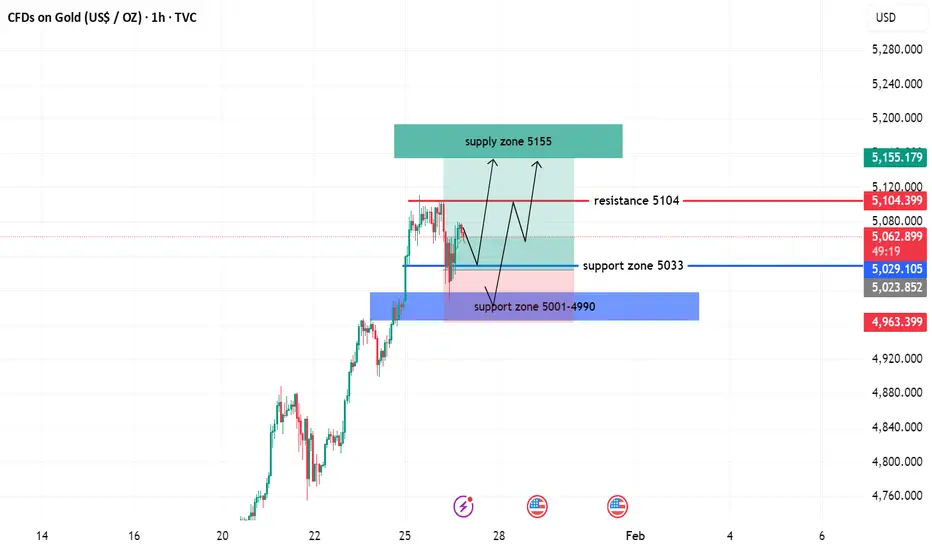
XAUUSD BULLISH ANALYSIS(READ CAPTION)Hi trader's what do you think about gold
Gold is currently showing bullish price action, with the market holding above key support levels. Buyers remain in control, and any short-term pullbacks are considered potential buying opportunities within the overall uptrend.
🟢 Primary Support: 5033
The 5033 level is acting as a strong bullish support. As long as price stays above this level, the bullish momentum is expected to continue.
🟢 Second Support Zone: 5001 – 4990
This zone represents a strong demand and accumulation area. If price retraces into this zone, buyers are likely to step in again. A clear break below 4990 would weaken the bullish structure.
📈 Market Bias
Above 5033 → Bullish trend remains valid
Pullback toward 5001–4990 → Possible buy zone
Below 4990 → Bullish setup invalidated
Overall, the market structure supports a buy-on-dips strategy while price holds above key support zones.
please don't forget to like comment and follow
USDT.D at HTF Resistance — 4H Execution, Daily Bias in ContextContext
This analysis is based on the 4H chart shown. The Daily chart is not displayed, but the higher-timeframe bias is inferred from structure and location. USDT Dominance (USDT.D) is currently trading at a key HTF resistance zone, acting as a major decision point for overall crypto risk.
Higher-Timeframe Bias (Daily – Not Shown)
From a Daily perspective, USDT.D is extended into a historically sensitive resistance area.
This zone typically represents peaks in risk-off behavior rather than continuation points.
Unless Daily acceptance occurs above this zone, my macro bias remains for a pullback in dominance.
A Daily pullback in USDT.D supports sustained risk-on conditions across BTC and Altcoins.
Execution Timeframe (4H – Chart Shown)
Key HTF resistance / supply zone: 7.16% – 7.23% .
This area is treated as a rejection-or-acceptance zone, not an entry by itself.
First downside reaction / demand zone: 6.70% – 6.76% .
If this zone fails with acceptance, lower HTF magnets come into play.
Primary Scenario — Rejection from HTF Supply (Risk-On)
4H rejection from the 7.16–7.23% supply zone.
Bearish displacement away from the zone, ideally leaving imbalance / FVG.
Price should not immediately reclaim the supply; acceptance back inside invalidates weakness.
Expectation: continuation toward the green demand zone first, then potentially lower HTF levels.
Market implication: declining USDT.D = capital rotating from stables into crypto (bullish for BTC/ALTS).
Invalidation / Alternative Scenario — Acceptance Above Supply (Risk-Off)
4H candle closes and holds above 7.23% .
Successful retest of the zone as support confirms acceptance.
This opens the path for further dominance expansion.
Market implication: sustained risk-off conditions; crypto upside becomes limited or corrective.
Notes
USDT.D is used strictly as a macro risk filter, not a standalone trade signal.
Best conditions occur when BTC and Altcoin structures confirm the same directional bias.
As always, acceptance vs rejection is more important than wicks or single candles.

1 Hr Timeframe Support And Resistance Key zones All the marked zones are extremely important key zones , expect price to show reaction in these areas.
How I look at them is easy , If price breaks level below I simply sell and target next support area , if If rejects lower levers than I buy and target next resistance area.
Now if price just keeps going up I wait for candle close above level for buys and target next resistance area and if upper level gets rejected than sell and target next support area.
Since gold is printing big a$$ candles , switch to lower tf

EUR-CHF Local Short In A Downtrend! Sell!
Hello,Traders!
EURCHF reacts from a well-defined supply zone after a strong impulsive sell-off. Failure to reclaim structure suggests distribution is active, with liquidity resting below recent lows. Expect continuation toward the downside. Time Frame 2H.
Sell!
Comment and subscribe to help us grow!
Check out other forecasts below too!
Disclosure: I am part of Trade Nation's Influencer program and receive a monthly fee for using their TradingView charts in my analysis.

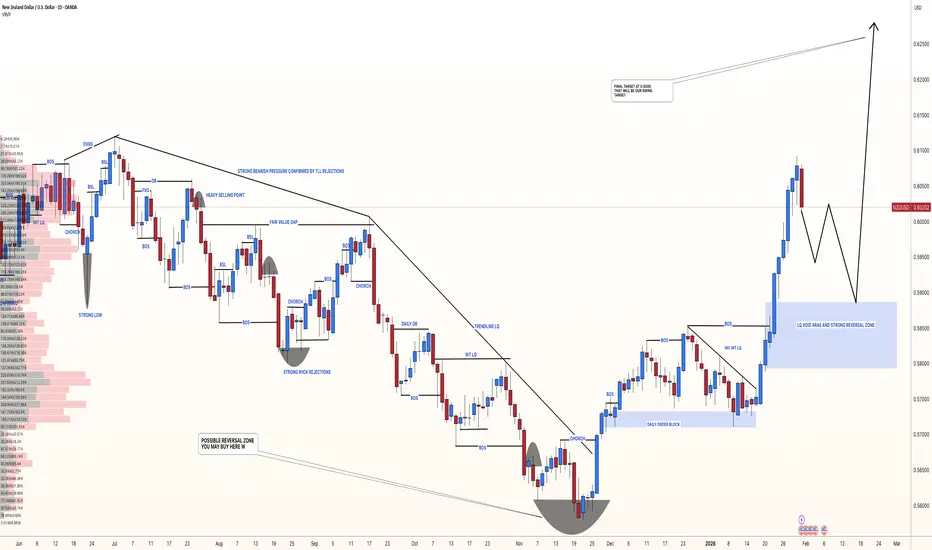
NZDUSD: First Drop Around 150+ Pips Then 800+ Pips BuyDear traders,
I hope you’re all doing well. We have a great opportunity where we expect the price to drop around our target area. This area looks promising and safer than selling at the current price. We recommend waiting for the price to touch our target before considering a buy. Remember the market has been very volatile and risky. Consider all possibilities and whether you can afford to risk trading in this environment. Always maintain strong risk management to protect your accounts.
If you like our trading ideas, please like and comment. Also, follow us for up-to-date updates.
Team Setupsfx_
EURUSD Short: Fake Breakout at Supply, Pullback to 1.1850Hello traders! Here’s a clear technical breakdown of EURUSD (4H) based on the current chart structure. EURUSD initially traded within a well-defined ascending channel, confirming a strong bullish environment with consistent higher highs and higher lows. This phase reflected clear buyer control and healthy trend continuation. After reaching the upper boundary of the ascending channel, price lost momentum and transitioned into a descending corrective channel, signaling a temporary pullback rather than a full trend reversal. The corrective move remained orderly, with price respecting the descending structure and gradually compressing toward the lower boundary. At the lower edge of the descending channel, EURUSD formed a clear pivot point, where seller pressure weakened and buyers stepped back in aggressively. This led to a bullish breakout from the descending channel, confirming the end of the corrective phase. Following the breakout, price accelerated sharply higher, impulsively breaking above the key Demand Zone around 1.1850, which previously acted as resistance. This clean structure flip confirmed strong buyer commitment and renewed bullish momentum.
Currently, price then surged directly into the higher-timeframe Supply Zone around 1.2000–1.2050, where a fake breakout occurred. The rejection from this area suggests that sellers are active at the highs and that the market may be temporarily overextended after the strong impulse. Such behavior often leads to a corrective retracement rather than immediate continuation.
My primary scenario is a corrective pullback from the supply zone toward the 1.1850 Demand Zone (TP1). This level represents former resistance turned support and is a key area where buyers previously entered aggressively. As long as EURUSD holds above this demand zone, the broader bullish structure remains intact, and any pullback should be viewed as corrective within an overall uptrend. A strong bullish reaction and stabilization from the demand area could open the door for another attempt higher toward the supply zone and potentially new highs. However, a decisive breakdown and acceptance below the 1.1850 demand zone would weaken the bullish bias and increase the probability of a deeper correction. For now, the market favors buyers, with the current move best interpreted as a pullback after a strong impulsive rally. Manage your risk!

GBPCHF – H4 OutlookGBPCHF remains bearish after a clear break of structure, with price currently consolidating below prior support. The recent upside move is corrective.
The key reaction zone sits at the H4 supply / order block around 1.0620 – 1.0640, where sellers are expected to step back in.
Key Levels
- Sell zone: 1.0620 → 1.0640
- Invalidation: H4 close above 1.0660
- Downside targets: 1.0560 → 1.0520
Bias remains bearish while price trades below supply. Clean rejection from the zone offers optimal short setups.

BTCUSD IS FORMING A DROP-BASE-DROP-PATTERN IN WEEKLY TIME FRAMEOur expectation on this very pair is a sell continuation from the base area(b/w 80,000 &100,000). price has changed from up -trend to down- trend forming a drop-base-drop pattern ,we can capitalize on the pair if we'll exercise patience for the new week candle to open by the first week of February 2026.

BTC: The 2026 ProjectionSince late 2025, #Bitcoin has been in a bearish decline that led to a broader market downturn. After reaching an untested support level, a corrective upward move is expected, which could give the whole market a strong room to rise and recover from the bear-market.
As long as BTC remains below its ATH, a potential Head & Shoulders pattern may be forming, which could drive the price down toward the 2024 demand zone.
This does not necessarily imply a market-wide decline as altcoins performance would depend on BTC dominance & their market cap.

SUI at the macro golden pocketCRYPTOCAP:SUI has only printed series of 3 wave structures on the weekly time frame showing no impulsive motif wave despite large returns. This suggests its all corrective or a leading diagonal.
Wave (B) is underway and currently at the golden pocket Fibonacci retracement, finding support in a High Volume Node. The altCoin golden pocket, 0.786, sits at $0.646, a likely terminal target.
Weekly RSI is printing unconfirmed bullish divergence but has not yet reached oversold. The bears are in control.
I think we are going to see bottoms soon enough. Dumping on a low liquidity Saturday is a suspicious move that could trigger a capitulation event.
Safe trading

BITCOIN is still bearish (12H)Bitcoin Liquidity Sweep & Bearish CH – What Traders Need to Know
As we can clearly see on the chart, Bitcoin has already swept the liquidity above the structure, successfully triggering a bearish Change of Character (CHoCH). This move confirms that the market is shifting toward bearish momentum, and the bulls have lost control.
But the story doesn’t end there. After clearing the upper liquidity, Bitcoin has now also swept the liquidity below the chart. This is a classic sign of liquidity hunting by market makers and smart money, aiming to collect stops and pending orders before pushing the market in the desired direction.
What to Expect Next (High-Probability Scenario)
Once the liquidity below the market has been taken out, we typically expect a temporary retracement or pullback to the upside. This retrace serves two key purposes:
It allows the market to breathe and shake out weak hands,
It helps market makers gather more liquidity before continuing the main move.
After this expected pullback, we anticipate that price will resume its downward movement, continuing the bearish structure.
Entry Strategy (DCA Plan)
We have identified two clear entry zones, designed for DCA (Dollar-Cost Averaging). This approach allows traders to:
enter with lower risk,
reduce entry price uncertainty,
and avoid the danger of catching the exact bottom.
Target Zone
Our target can be one lower liquidity level (one lower “L”), which aligns with the overall bearish structure and liquidity flow.
Key Takeaways for Traders
Liquidity sweeps indicate market maker activity
Bearish CH confirms the shift in trend
A temporary pullback is likely after liquidity hunting
Use DCA for safer entries
Target can be the next lower liquidity level
If you would like us to analyze a coin or altcoin for you, first like this post, then comment the name of your altcoin below.


GOLD (XAUUSD): Support & Resistance Analysis for Next Week
Here is my latest structure analysis for Gold.
Resistance 1: 5104 - 5115 area
Resistance 2: 5582 - 5600 area
Support 1: 4630 - 4685 area
Support 2: 4536 - 4551 area
Support 3: 4340 - 4410 area
Consider these structures for pullback/breakout trading.
❤️Please, support my work with like, thank you!❤️
I am part of Trade Nation's Influencer program and receive a monthly fee for using their TradingView charts in my analysis.

AUDNZD: One Hour Timeframe, Possible Intraday Buying Setup! Dear traders,
The AUDNZD dropped in the hourly timeframe today following a heavy sell-off in metals like gold and silver. However, we anticipate a bullish trend for AUDNZD to begin next week as the market settles down. Please manage your risk accurately while trading in these current conditions. Good luck and trade safely!
If you enjoy our work, please like and comment on our ideas.
Team Setupsfx_

ETH Rebuy Zone (1D)Honestly, the key support levels have already been lost.
Considering the selling pressure, the bearish momentum, and the current candle structure, it appears that the bearish wave is likely to conclude within the green zone.
This corrective move will require time and proper base formation before any meaningful reversal to the upside can occur. A sustainable recovery is unlikely without consolidation and accumulation in this area.
The optimal approach in the green zone is to enter positions gradually using a DCA (Dollar-Cost Averaging) strategy, while avoiding any form of impatience or emotional decision-making. Rushing entries in such conditions significantly increases risk.
Above all, capital management and risk control remain the most critical factors in navigating this market phase.
If you have a coin or altcoin you want analyzed, first hit the like button and then comment its name so I can review it for you.
This is not a trade setup, as it has no precise stop-loss, stop, or target. I do not publish my trade setups here.

US Dollar: Turning Bullish? Look Carefully...Welcome back to the Weekly Forex Forecast for the week of Feb. 2-6th.
In this video, we will analyze the following FX market: USD Dollar
The USD has been bearish-neutral, stuck in a consolidation. Last week it swept the low of the consolidation.... then immediately retraced back into the range.
Manipulation? I think so. Especially if you look at the position of price in the structure.
AMD comes to mind.
This week, I expect the bullish momentum of this correction to continue. Should the market start to disrespect bearish PD Arrays, then I will trade the major currencies vs USD accordingly.
Enjoy!
May profits be upon you.
Leave any questions or comments in the comment section.
I appreciate any feedback from my viewers!
Disclaimer:
I do not provide personal investment advice and I am not a qualified licensed investment advisor.
All information found here, including any ideas, opinions, views, predictions, forecasts, commentaries, suggestions, expressed or implied herein, are for informational, entertainment or educational purposes only and should not be construed as personal investment advice. While the information provided is believed to be accurate, it may include errors or inaccuracies.
I will not and cannot be held liable for any actions you take as a result of anything you read here.
Conduct your own due diligence, or consult a licensed financial advisor or broker before making any and all investment decisions. Any investments, trades, speculations, or decisions made on the basis of any information found on this channel, expressed or implied herein, are committed at your own risk, financial or otherwise.
