GBPAUD Textbook Bear FlagGBPAUD price had been falling sharply, sellers were in full control, driving the market lower with strong bearish momentum.
Then came a pause. Price started climbing slowly, forming a rising channel. That’s the bear flag. Buyers are trying to recover, but it is weak and hesitant, every push higher is met with selling pressure.
Inside that flag, sellers are waiting for signs of exhaustion. And if price breaks below the structure strongly, that’s the confirmation we need.
I am expecting another impulsive leg down in the direction of the main trend, at around 1.9856.
With this kind of pattern, usually the stop-loss is placed just above the flag.
Keep in mind that this is just an idea, not a trade and not financial advice.
Community ideas

GOLD → Consolidation. The fundamental backdrop is changing...FX:XAUUSD stabilizes after a week-long decline, failing to consolidate above $4050. The market is taking a pause before new impulses. Focus on 4030 and 3980...
Investors are closing positions before the end of the week and month, the reason being the uncertainty surrounding the deal with China and Powell's less dovish stance on policy: a 25 bp rate cut is already priced in. The probability of a December cut has fallen to 72.8% (from 91.1% a week ago). Powell emphasized that decisions depend on data, which is not available due to the shutdown.
The strong dollar (2-month highs) is putting pressure on gold. Weak data from China (PMI fell to 49.0) is reducing demand from the largest consumer.
The balance is tipping towards weak fundamentals...
Resistance levels: 4030, 4085
Support levels: 3982, 3955, 3915
Technically, bears are keeping the market below 4030 - strong resistance. If buyers enter the market (there are currently no fundamental reasons for this) and the bulls are able to break through 4030 and keep the price above this level, we will have a chance for growth. But under the current circumstances, I expect a correction to support before a possible rise.
Best regards, R. Linda!

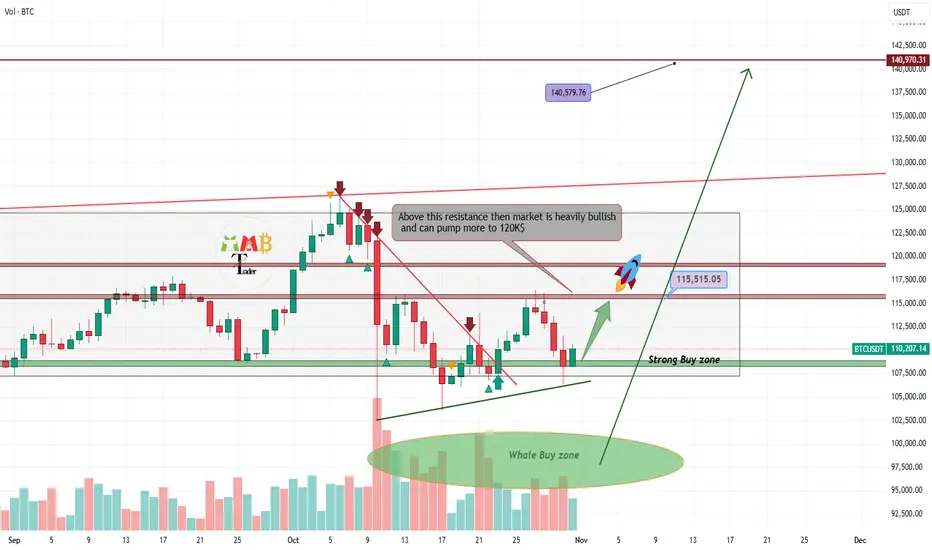
Bitcoin soon will hit 140K$ as new ATHAs the chart illustrates, Bitcoin continues to consolidate within a well-defined range, bounded by the key support at $100,000 and the significant resistance at $117,000. Periods of such compression are typically followed by a decisive directional move, which establishes a new trend path.
Our analysis favors a resolution to the upside. A confirmed breakout, characterized by a decisive daily close above the $117,000 resistance level, would be a strong technical signal. This would invalidate the current range-bound structure and likely reactivate the primary bullish trend.
Such a breakout would open a clear path for price discovery toward new all-time highs. The initial projected technical target following a successful breach is the $140,000 zone, which represents the next major psychological and technical objective.
DISCLAIMER: ((trade based on your own decision))
<<press like👍 if you enjoy💚
Hawkish Fed Tone Caps EURUSD Near 1.1580!!Hey Traders, in today’s trading session we’re monitoring EURUSD for a potential selling opportunity around the 1.15800 zone.
The pair remains in a downtrend, and the current correction phase is bringing price back toward the 1.15800 resistance area, aligning with the broader bearish structure.
On the fundamental side, the recent U.S.–China deal combined with Powell’s hawkish tone has reduced the odds of a December rate cut — a setup that continues to favor USD strength and weigh on EURUSD.
Watching for rejection signs near 1.15800 for possible continuation to the downside.
Trade safe,
Joe.

XAU/USD | Gold Fills Liquidity Gap – Another Drop Below $3,900?By analyzing the #Gold chart on the 2-hour timeframe, we can see that after reaching the $3,915 demand zone, price reacted strongly and began to rise, filling the liquidity gap created by last night’s drop. Gold is currently trading around $3,973, and if it fails to hold above $4,015, we could see another strong bearish move toward lower levels below $3,900. The next short-term bearish targets are $3,955, $3,947, $3,915, and $3,899.
Please support me with your likes and comments to motivate me to share more analysis with you and share your opinion about the possible trend of this chart with me !
Best Regards , Arman Shaban

GOLD: Waiting For the Bulls To Join the PartyGOLD: Waiting For the Bulls To Join the Party
From our previous analysis, gold reached the same target twice. The bullish momentum is low, but it could increase over time.
The prevailing trend is evident, which is intact and remains bullish.
Today on the US economic calendar, the PCE data was expected to be reported.
Given that we have a data shortage due to the US government shutdown, this could raise questions again and could help gold to rise.
You may find more details in the chart!
Thank you and Good Luck!
❤️PS: Please support with a like or comment if you find this analysis useful for your trading day❤️
Previous analysis:

EUR/USD – Bears in Control but Demand Zone Could Spark a Rebound🔹 EUR/USD – Weekly Outlook (1–7 November 2025)
Bears remain in control, but a key demand zone is now in play.
The euro continues to trade under pressure as macro divergences between the U.S. and Eurozone persist.
In the U.S., the latest data confirmed a clear cooldown in growth and inflation, with Core PCE slowing to 2.6% YoY and GDP Q3 printing 2.2% vs. 3.0% expected. This fueled market expectations for a Fed rate cut in Q1 2026, yet Chair Powell reiterated that “progress on inflation remains incomplete,” keeping a neutral–hawkish tone. The U.S. dollar therefore preserved its defensive bid, supported by ongoing safe-haven demand amid geopolitical tension and weaker European data.
Across the Eurozone, inflation continues to decelerate (headline 2.5%, core 2.8%), while PMIs remain below 50, indicating a stagnant industrial sector. Market participants now expect the ECB to lean more dovish into early 2026, potentially preparing the ground for a rate cut once disinflation stabilizes. This narrative has weighed on the euro, pushing EUR/USD back below 1.16.
COT (Commitment of Traders)
COT data remain frozen due to the CFTC shutdown, with the last update dated September 23.
At that time, non-commercials held a strong net long on EUR (+114K), reflecting broad bearishness on the USD. However, the latest price action clearly suggests a partial unwinding of long exposure, consistent with the recent downside retracement.
⚠️ These figures are now outdated and must be interpreted with caution — institutional flows may have shifted significantly since late September.
Retail Sentiment
📊 59% long / 41% short → contrarian bearish bias.
Retail traders remain predominantly long, implying a higher probability of continued downside in the short term, especially while macro data favor the dollar.
Seasonality
Seasonal statistics for November are mildly positive over 10–20Y composites, but recent 5-year data suggest a sluggish start to the month, often followed by a technical rebound in the second half.
📅 Seasonal conclusion: short-term weakness likely persists into mid-November, with recovery potential toward month-end once markets price in softer U.S. CPI or dovish Fed expectations.
Technical Outlook
EUR/USD continues to move within a descending channel since late August.
After a clean rejection from the 1.1700–1.1750 supply zone, the pair broke recent lows and is now consolidating within the 1.1530–1.1550 demand area, aligned with the summer support base.
Key technical levels:
Resistance: 1.1650–1.1700
Immediate support: 1.1530–1.1500
Next demand zone: 1.1380–1.1420
RSI: below 50, yet showing early signs of bullish divergence, hinting at a potential rebound if 1.15 holds.
🎯 Primary Scenario:
Price may extend the corrective leg toward 1.1450–1.1420, where a structural swing low could form. From there, any USD weakness following U.S. CPI data could fuel a technical rebound targeting 1.1650–1.1700.
⚙️ Invalidation: Daily close above 1.1730, which would break the descending structure and shift the bias neutral-to-bullish.
Summary
Macro: Euro pressured by softer inflation and weak PMI; USD supported by cautious Fed and geopolitical flows.
Sentiment: Retail still long — contrarian signal for more downside.
Technical: Channel intact; demand zone at 1.1530–1.1500 under test.
Outlook: Expect another leg lower before possible late-month rebound.

EUR/USD Faces Renewed Downside Pressure as Sellers DominateHello everyone, the EUR/USD pair is showing clear signs of weakness as sellers continue to dominate, pushing the price back to around 1.1550 after a brief rebound. On the H4 timeframe, the market structure remains in a medium-term downtrend with a series of lower highs and lower lows, confirming consistent selling pressure. After failing to hold above the 1.1620 zone, EUR/USD quickly retreated and is now hovering near the key support area at 1.1550, where buyers are attempting to defend against a potential breakdown.
The FVG resistance zone between 1.1590–1.1620 is acting as the primary obstacle for any recovery, coinciding with the Ichimoku cloud — forming a strong technical barrier. Each time the price tests this region, sellers step in aggressively, reinforcing that bears remain firmly in control.
On the macro side, the euro continues to suffer from lacklustre data — slower GDP growth, weakening inflation, and rising unemployment. This economic backdrop makes it likely that the European Central Bank (ECB) will keep rates unchanged to avoid deepening a potential recession. Meanwhile, the US dollar remains supported by expectations that the Federal Reserve will maintain a cautious stance after its modest rate cut, amid lingering inflation concerns. The resulting policy divergence continues to favour the greenback, limiting EUR/USD’s ability to recover.
From both a technical and fundamental perspective, the pair is likely to consolidate between 1.1550–1.1620 before potentially breaking down to 1.1500 to sweep liquidity and test market reaction. If sellers sustain pressure near the FVG resistance, the bearish trend should persist. Conversely, only a firm close above 1.1625 would confirm a short-term recovery attempt.
At present, the preferred scenario remains a drop toward 1.1500, followed by a possible technical rebound if upcoming US data disappoints or if the ECB turns unexpectedly dovish.
And you — do you think EUR/USD can defend this support, or will it slide deeper under the weight of the strengthening dollar?

CHF/JPY: Confirmed Intraday Bullish SignalI spotted an additional instance aligning with my breakout trading strategy.
The 📈CHFJPY pair showed a decisive violation and close above a significant intraday horizontal resistance level.
Following this, the price retested the broken structure and subsequently breached the resistance line of a falling parallel channel on an hourly timeframe.
This indicates a strong buying interest.
We can now anticipate an upward movement, with a minimum target of 192.66.

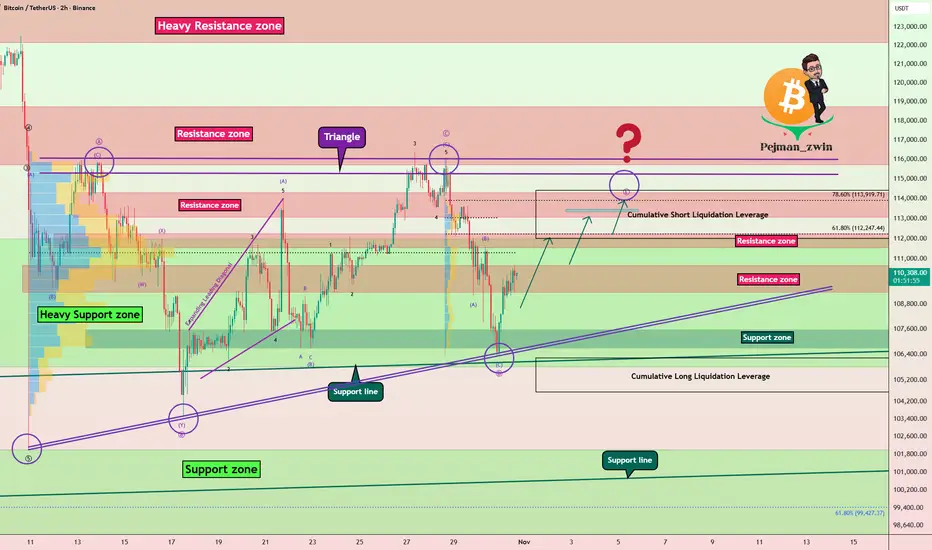
Bitcoin Correction Forming a Triangle – Which Way Next?Bitcoin ( BINANCE:BTCUSDT ), just as I expected in the previous idea , started to decline and reached its full target .
Over the past 20 days , Bitcoin has been moving in a ranging pattern that seems to be forming into a triangle shape .
From an Elliott Wave perspective , this corrective structure also appears to be a triangle , with its wave E potentially completing around the Resistance zone($114,300-$113,000) and the Cumulative Short Liquidation Leverage($114,424-$112,000) .
I expect that in the coming hours, Bitcoin can rise at least up to about $112,800 . If the upward momentum is strong enough , we might even see it reach the upper lines of the triangle .
Cumulative Long Liquidation Leverage: $106,231-$104,648
Please respect each other's ideas and express them politely if you agree or disagree.
Bitcoin Analysis (BTCUSDT), 2-hour time frame.
Be sure to follow the updated ideas.
Do not forget to put a Stop loss for your positions (For every position you want to open).
Please follow your strategy and updates; this is just my Idea, and I will gladly see your ideas in this post.
Please do not forget the ✅' like '✅ button 🙏😊 & Share it with your friends; thanks, and Trade safe.
PRICE ACTION – The True Language of the MarketIn the noisy world of trading, filled with indicators, signals, and formulas, Price Action brings you back to the core: price. When you remove all indicators, erase moving averages, and forget RSI, the only thing left on your chart is the footprint of the market – the candles telling their story.
What is Price Action – and why is it the “true language”?
Price Action is not a “magic trick” or an infallible trading system. It is the art of listening to the market, the ability to read the rhythm of money flow and human emotions reflected in every price movement. Each candle is not just data – it is a story of hope and fear, of buyers and sellers, of greed and doubt. A Price Action trader does not predict the market – they observe how the market reacts.
Price – where emotions are written in candles
Price never moves randomly. Every high and low is the result of millions of human decisions.
When price breaks a high: it’s confidence and euphoria.
When price breaks a low: it’s fear and panic.
When price moves sideways: it’s waiting and doubt.
Price Action teaches you to read the emotions behind each click, not just the shape of the candle.
Market structure – the backbone of Price Action
Behind every trend lies a clear structure. The market cycles through three phases:
Accumulation – buyers and sellers struggle, price moves sideways.
Expansion – one side dominates, trend forms.
Distribution – winners take profits, losers retreat.
Understanding market structure means knowing where you are in the cycle, avoiding blind trades, and acting with purpose.
Every candle – a small story in the bigger picture
A long lower shadow signals strong buying pressure.
A pinbar at resistance shows price rejection.
A series of small candles indicates accumulation and an impending breakout.
A Price Action trader does not see candles individually but connects them into the full story – where every move has a reason.
The power of simplicity
Price Action is simple, yet far from simplistic. It is not lagging like indicators, not dependent on false signals, and can be applied across all markets – from Forex and gold to crypto. When you read price action, you are no longer passive, waiting for a signal; you become the navigator, following the market’s heartbeat.
The mindset of a professional Price Action trader
A professional Price Action trader doesn’t ask, “When should I enter?” Instead, they ask:
Who is controlling the market?
Where is the money flowing?
Has this price area reversed before?
Am I moving with the money or against it?
The difference lies not in technique, but in mindset and reaction. The market doesn’t need you to win. It rewards those who understand how it operates.
When you read price, you understand people
Price Action is not a tool; it is a living perspective on market psychology. It doesn’t promise perfection, but it gives you profound understanding. When you read price – you are reading human psychology. When you understand structure – you grasp the rhythm of emotional cycles. And when you immerse yourself in Price Action, you are no longer guessing prices – you move with the market, heartbeat by heartbeat, move by move, opportunity by opportunity.

Bitcoin Bullish Breakout Toward 112,000 TargetBitcoin (BTC/USD) is showing bullish momentum, trading above the trend line support. The price is targeting the 112,000 level, with potential resistance zones ahead. A sustained move above 110,000 could confirm further upside continuation.

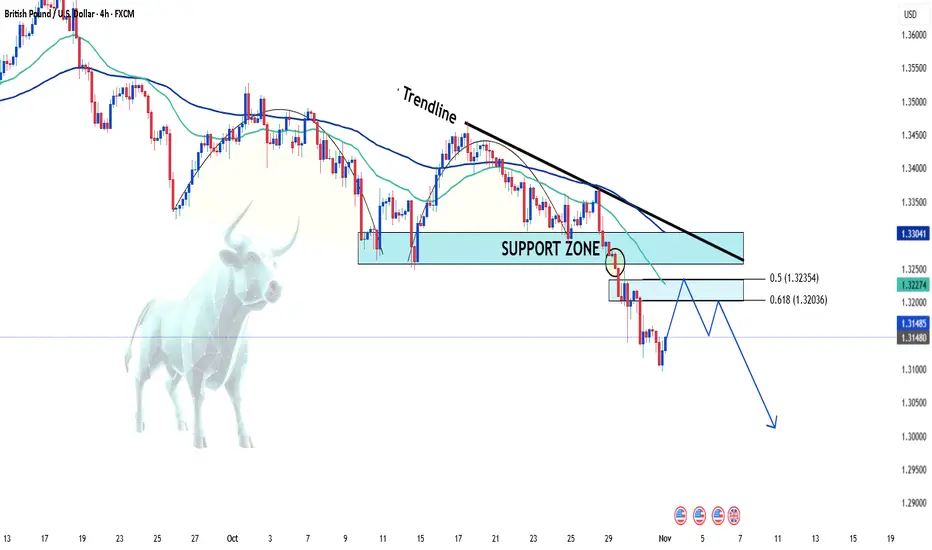
GBPUSD: Drops Sharply After Breaking Key Support👋Hello traders , what’s your view on FX:GBPUSD ?
The GBP/USD pair continues its bearish momentum in the first sessions of November, currently trading around the 1.314 zone after failing to hold the key 1.326 support — which has now turned into new resistance.
On the 4H technical chart, the descending trendline still acts as a dynamic resistance, blocking every recovery attempt from buyers. Meanwhile, both EMA 34 and EMA 89 remain sloping downward, confirming that the short-term bearish trend is still dominant.
From a fundamental perspective, the British Pound is under pressure from weak economic data and expectations that the Bank of England (BoE) may keep its tightening policy longer than anticipated. At the same time, the USD continues to find support and strengthen over recent days.
The preferred scenario suggests that price may perform a technical rebound back to the 1.3200 – 1.3235 zone (which aligns with the 0.5–0.618 Fibonacci retracement area) before continuing its downward move in line with the main trend. The next potential target lies near 1.3050 – 1.3000, where a temporary buying reaction could occur.
What do you think — will GBPUSD bounce from this bottom zone or keep sliding lower next week? 💬
EURUSD: Bounce from Support Could Trigger Move Toward 1.1640Hello everyone, here is my breakdown of the current Euro setup.
Market Analysis
EURUSD has been trading in a corrective phase after breaking down from the Upward Channel that previously guided its bullish movement. The pair formed a Range near the 1.1760 Resistance Area, showing consolidation before sellers regained control. Multiple Breakouts confirmed shifts in market structure — first to the upside within the channel, and later to the downside, signaling the transition from bullish to neutral-bearish momentum.
Recently, price found strong demand within the 1.1550–1.1560 Support Zone, which aligns with the Triangle Support Line. This level has been tested multiple times, acting as a significant pivot point for potential bullish reactions. The Triangle Resistance Line above continues to limit upward movement, forming a contracting structure that reflects growing pressure from both sides.
My Scenario & Strategy
From my view, EURUSD is currently setting up for a possible bullish rebound from the support zone near 1.1560. If buyers defend this level, the price could rise toward the Triangle Resistance Line around 1.1630–1.1640. A confirmed breakout above this resistance could open the way toward the key 1.1760 Resistance Zone, signaling a shift in sentiment back to bullish.
However, if the pair fails to hold above the Triangle Support Line, a breakdown could trigger a deeper decline toward 1.1500. For now, I maintain a short-term bullish bias, looking for long opportunities near support with clear confirmation signals.
That's the setup I'm tracking. Thank you for your attention, and always manage your risk.

Lingrid | USDCHF Structure Based Trade SetupFX:USDCHF is trading near the upper boundary of its multi-week range, testing the resistance zone at 0.8050–0.8060. Price action shows repeated rejections from this area while maintaining a higher-low structure supported by an ascending trendline. A short-term pullback toward 0.7980 could occur before any possible bullish attempt. Overall, the pair remains range-bound with momentum gradually tightening under resistance.
⚠️ Risks:
Unexpected FOMC statement volatility could shift USD sentiment.
A breakout above 0.8060 may invalidate the short-term pullback view.
Weak U.S. macro data could accelerate downside pressure toward 0.7870.
If this idea resonates with you or you have your own opinion, traders, hit the comments. I’m excited to read your thoughts!

BTCUSD Rebound Setup: Buyers Target 114K Resistance ZoneHello traders, I want to share with you my opinion about Bitcoin (BTCUSD). Bitcoin continues to move within a well-defined descending channel, forming a consistent pattern of lower highs and lower lows. This confirms that the market remains under bearish control, with sellers actively defending each retest of the resistance line. The Resistance Level at 115,600 has acted as a major cap for bullish attempts, rejecting multiple upside moves over the past few weeks. Recently, BTC retested the Buyer Zone near 108,000–109,000, where strong demand emerged, preventing further downside. This level aligns with both the Support Line of the channel and the horizontal Support Level at 106,400, making it a critical zone for potential bullish reactions. At the current stage, the price is showing early signs of a corrective rebound from the Buyer Zone. I believe this recovery could push the price toward the Seller Zone and Resistance Line, with a short-term target (TP1) around 114,000. However, this move should be viewed as a correction within a broader bearish trend unless BTC manages to break and hold above the 115,600 resistance area. My scenario suggests that BTC could face selling pressure once it reaches the upper boundary of the channel, possibly leading to another bearish leg unless bulls confirm a breakout. Please share this idea with your friends and click Boost 🚀

TRUMP Token Ecosystem Expanding – Real Utility Incoming(+30%)?The Official Trump ( BINANCE:TRUMPUSDT ) token has recently shown strong resilience and even outperformed the broader crypto market — and there are several interconnected reasons behind this momentum :
1. Whale Accumulation and Investor Confidence
Large holders have increased their TRUMP balances from roughly 3.97M to 4.88M tokens. This accumulation suggests renewed confidence and long-term positioning by influential investors, providing a strong base of support.
2. Expansion of the Trump Crypto Ecosystem
The ecosystem around Trump-linked assets is growing:
World Liberty Financial, connected to the Trump family, announced a distribution of 8.4M WLFI tokens to users of its USD1 stablecoin on the Enso blockchain.
This strengthens cross-project connectivity and gives TRUMP indirect exposure to new on-chain activity and liquidity.
3. Strategic Business Moves
The TRUMP token issuer, Fight Fight Fight LLC, is reportedly in talks to acquire the U.S. operations of Republic, a regulated investment and crowdfunding platform.
If completed, this deal could:
Add real utility to TRUMP (e.g., payments, fundraising, platform fees).
Expand adoption beyond speculation.
Reinforce the token’s legitimacy within U.S. financial infrastructure.
Summary
While the broader crypto market has dipped, TRUMP is supported by:
Whale accumulation,
Expanding ecosystem ties,
A potential acquisition bringing real-world utility, and
These factors together explain why the TRUMP token could continue to rise — or at least remain relatively strong — even in a weakening crypto environment.
-------------------------------------------------------
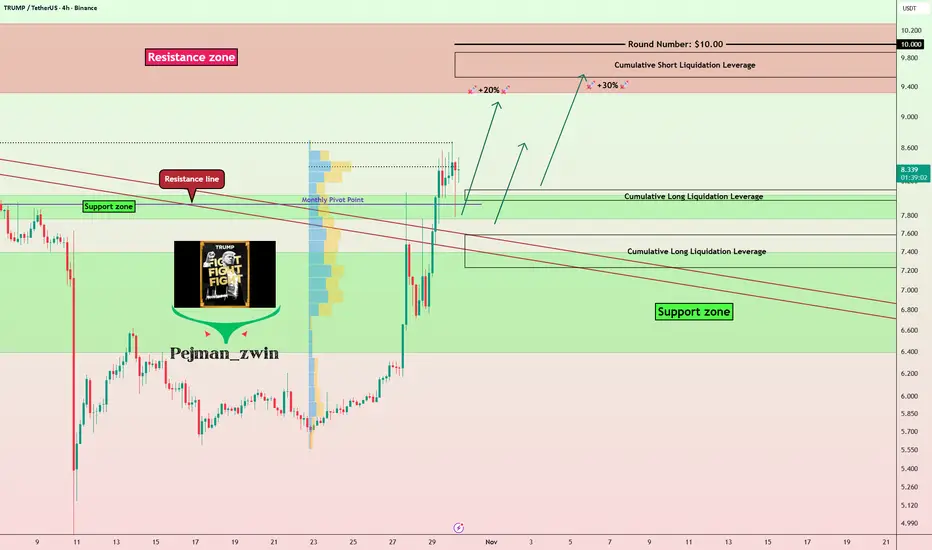
After reviewing the recent news around the TRUMP token , let's take a look at its 4-hour time frame chart.
Currently, the TRUMP token has successfully broken through its Resistance lines with strong momentum and is now moving near a Support zone($8.30-$7.76) and a Cumulative Long Liquidation Leverage($8.10-$7.97) .
I expect that even if the crypto market and Bitcoin ( BINANCE:BTCUSDT ) experience some decline, the TRUMP token might be able to hold its ground thanks to the positive news and the strong momentum it showed when breaking those resistance lines. We could see it potentially rise another +20%/+30% and reach its next Resistance zone($10.30-$9.32) .
Note: A key price level to watch for TRUMP is around $8.70, which has served as both strong support and resistance over the past few months and has been notable in terms of trading volume.
Stop Loss(SL): $7.19(Worst)
Cumulative Long Liquidation Leverage: $7.58-$7.23
Cumulative Short Liquidation Leverage: $9.88-$9.53
Please respect each other's ideas and express them politely if you agree or disagree.
OFFICIAL TRUMP Analyze (TRUMPUSDT), 4-hour time frame.
Be sure to follow the updated ideas.
Do not forget to put a Stop loss for your positions (For every position you want to open).
Please follow your strategy and updates; this is just my Idea, and I will gladly see your ideas in this post.
Please do not forget the ✅' like '✅ button 🙏😊 & Share it with your friends; thanks, and Trade safe.
Bitcoin - Bull trap, expect 92000 USD in November! (must see)Bitcoin formed a symmetrical triangle, and the triangle broke bullish, but can we really believe this price action, or is it a bullish trap? To trap bulls into buying, but then sending the price down. I see many issues with the current price action.
Price created a CME GAP at around 111,000 USD, and you probably know that these gaps tend to be filled pretty quickly. In one of the next analyses, I will tell you how many gaps were filled and how many remained open on the daily and weekly charts. So the price should definitely go back and fill the gap, which means the price needs to go back into the symmetrical triangle, which is bearish.
I think it would be a good long to buy this CME GAP, but only for a short-term intraday trade. I think we are going to go to 92k in November.
Next issue is that Bitcoin just formed a bearish (W)(X)(Y) Elliott wave pattern, so instead of a breakout above the wave (W), we have seen a fakeout or a liquidity sweep. That's another sign of weakness.
The next issue is gold. I think gold's recent pretty significant fall from its all-time high can push the price of Bitcoin down as well.
Altcoins are very weak, and I see BTC.D going up, which suggests that we cannot expect any altcoin season.
So this is my current outlook on BTC, I think we are going to go down in November. You know that the Bitcoin market is highly manipulated by huge banks and governments (they work together), and they can send the price down to take liquidity and liquidate traders on the futures market. This is how they make most of their money, not by sending the price straight to the upside. That's why we will always see many significant drops on the way to the upside. And I think their next plan is to liquidate all ETF traders, so be careful.
Write a comment with your altcoin + hit the like button, and I will make an analysis for you in response. Trading is not hard if you have a good coach! This is not a trade setup, as there is no stop-loss or profit target. I share my trades privately. Thank you, and I wish you successful trades!

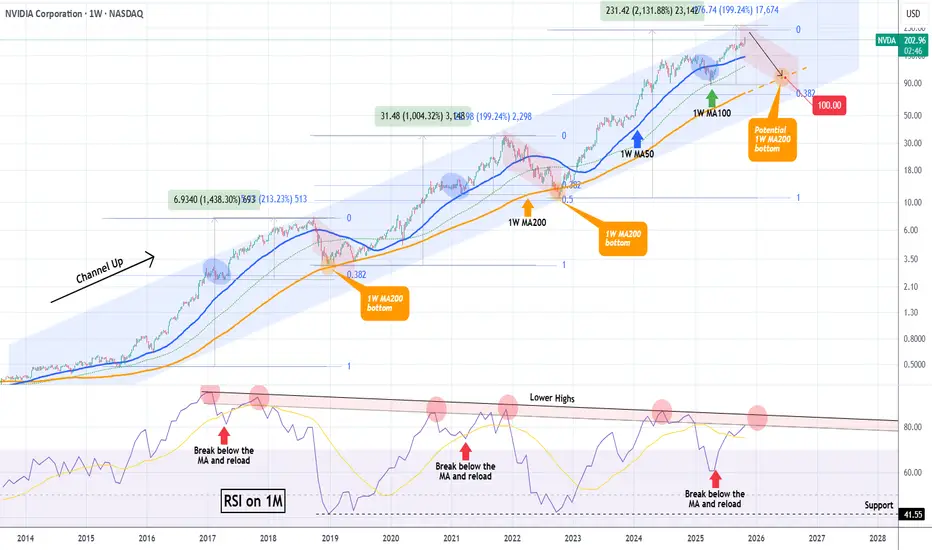
NVIDIA hit $5 Trillion but the end of the rally may be near.NVIDIA Corporation (NVDA) broke this week the $5 Trillion market cap barrier, becoming the first company to do so. In the meantime, it is extending the rally that started on the April 07 Low on the 1W MA100 (green trend-line), following the end of the Tariff War.
This rally has been nothing more than a part of the larger technical Bullish Leg inside the 10-year Channel Up that NVIDIA has been trading in. Within this pattern, the price has had rather asymmetric Bullish Legs in terms of rise % but has always been rejected at the top of the Channel Up and corrected back to the 1W MA200 (orange trend-line).
Following the mid-Bullish Leg corrections to the 1W MA50 (blue trend-line), the final rallies of the Bullish Legs before their Tops have been around +200%. Then their corrections/ Bearish Legs have always hit the 1W MA200 (as mentioned), with one time bottoming just above the 0.382 Fibonacci retracement level and the other below it (0.5 Fib).
We previously had NVIDIA's top at around $240, which is slightly below this expected +200% rise from the 1W MA100 bottom. As a result, we project that a potential contact with the 1W MA200 for the 2026 Bearish Leg can be achieved around $100, which is above the 0.382 Fib, similar to 2018.
Note that a very reliable Top indicator has also been the 1M RSI and its 9-year Lower Highs Zone. Every time the RSI entered the Zone and then broke below its MA (yellow trend-line) and rebounded, the next hit was the Bullish Leg's Top. Right now the 1M RSI is about to enter this Zone for the second time, indicating that we may be approaching the end of this long-term rally.
-------------------------------------------------------------------------------
** Please LIKE 👍, FOLLOW ✅, SHARE 🙌 and COMMENT ✍ if you enjoy this idea! Also share your ideas and charts in the comments section below! This is best way to keep it relevant, support us, keep the content here free and allow the idea to reach as many people as possible. **
-------------------------------------------------------------------------------
💸💸💸💸💸💸
👇 👇 👇 👇 👇 👇
XAU/USD (Gold Spot vs. U.S. Dollar) on the 30-minute timeframe..XAU/USD (Gold Spot vs. U.S. Dollar) on the 30-minute timeframe, using the Ichimoku Cloud with a clearly drawn ascending trendline providing support.
Here’s what’s visible:
Current price: around $4,002 – $4,009.
The price is sitting above the trendline and at the edge of the cloud, suggesting possible continuation to the upside if support holds.
A target point is drawn on your chart near $4,120.
✅ Target:
Primary Target Point: ≈ $4,120
That’s roughly a +110 to +120 point potential move from current levels.
If you want to manage risk:
Stop loss could be set just below the trendline or cloud base — around $3,975 – $3,980.
That gives a risk–reward ratio of roughly 1:3 depending on my entry.

XAGUSDHello Traders! 👋
What are your thoughts on Silver ?
Silver entered a corrective phase following its recent rally and is now trading below the resistance zone and the broken trendline.
This structure suggests weakening bullish momentum and a potential continuation to the downside once the pullback completes.
We expect price to complete a pullback toward the broken zone and then resume its downward movement toward the identified support levels.
As long as silver remains below the resistance and trendline, the bearish bias stays valid.
A confirmed break and close above resistance would invalidate this scenario.
Don’t forget to like and share your thoughts in the comments! ❤️

TradeCityPro | Bitcoin Daily Analysis #207👋 Welcome to TradeCity Pro!
After a short break, let's get back to the daily Bitcoin analysis. The market is still in a very large range box.
⏳ 1-Hour Timeframe
Currently, Bitcoin is recovering after the drop to the 106319 level and has moved up to 110803.
✅ Today is Saturday, and as you can see, the market volume has dropped significantly. It seems that the market may range until tomorrow afternoon and won't move much upwards, with the main movement starting next week.
⚡️ The triggers we have for opening positions right now are:
For long: 110803
For short: 108844 and 106319
💥 Overall, Bitcoin is in a very large range box between 106319 and 115808, and as long as the price stays between these two levels, I will open my positions with very low risk.
❌ Disclaimer ❌
Trading futures is highly risky and dangerous. If you're not an expert, these triggers may not be suitable for you. You should first learn risk and capital management. You can also use the educational content from this channel.
Finally, these triggers reflect my personal opinions on price action, and the market may move completely against this analysis. So, do your own research before opening any position.

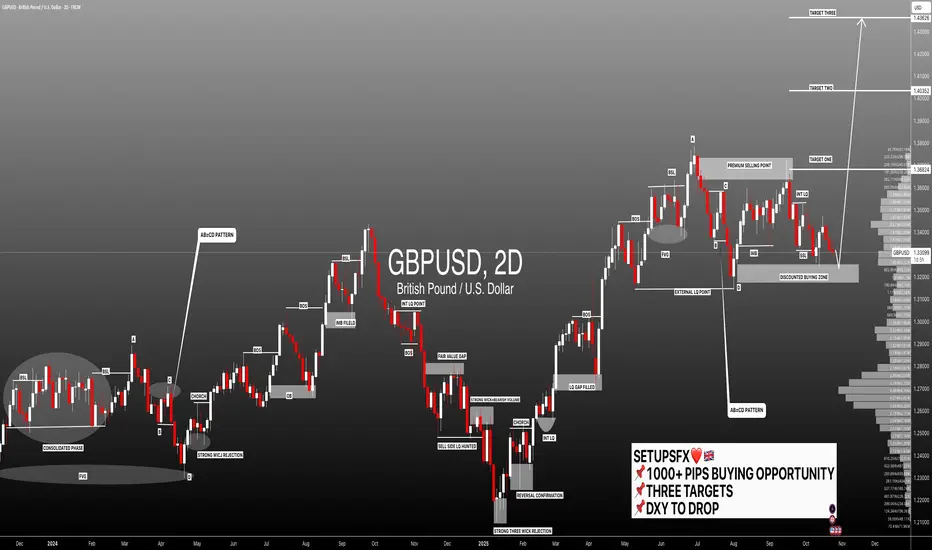
#GBPUSD:+1000 Pips Highly Probable Target! Agree with the idea? GBPUSD is currently trading at a highly probable point where we may see a strong bullish volume emerge in the market. This key level is only valid if the US dollar declines further, as a weak dollar will push our prices towards our target zones, helping us gain a higher risk-to-reward trade setup. Please like and comment on the ideas, even if you disagree. Sharing thoughts will help us all.
There are three major targets, and they accumulate to a +1000 pips trade setup. Set your take profit and stop loss based on your own analysis.
Team Setupsfx_