Building Better Inputs: The Foundation of AI Trading Success
The Best Algorithm in the World Can't Fix Bad Inputs
Here's a secret that separates amateur AI traders from professionals:
The model architecture matters far less than the features you feed it.
Feature engineering - the art of transforming raw data into meaningful inputs — is where the real edge lives.
---
What Is Feature Engineering?
Definition:
Feature engineering is the process of creating input variables (features) from raw data that help machine learning models make better predictions.
In Trading:
Transforming raw price, volume, and other data into signals that capture market behavior.
The Core Principle:
Raw data (OHLCV) contains information, but it's often hidden. Features extract and highlight that information.
---
Why Feature Engineering Matters
1. Models Learn from Features, Not Raw Data
A model seeing learns little
A model seeing learns patterns
Features encode the relationships that matter
2. Domain Knowledge Becomes Computable
"Price is extended" → Z-score feature
"Volume is unusual" → Volume ratio feature
"Trend is strong" → ADX feature
3. Reduces Noise, Amplifies Signal
Raw prices contain noise
Well-designed features filter noise
Model focuses on what matters
4. Enables Simpler Models
Good features + simple model often beats
Bad features + complex model
Interpretability improves
---
Categories of Trading Features
Category 1: Price-Based Features
Returns:
Simple returns: (Close - Previous Close) / Previous Close
Log returns: ln(Close / Previous Close)
Multi-period returns: 5-day, 20-day, 60-day
Price Relationships:
Distance from high/low
Distance from moving average
Price relative to range (where in today's range)
Candle Features:
Body size: |Close - Open|
Upper wick: High - max(Open, Close)
Lower wick: min(Open, Close) - Low
Body to range ratio
---
Category 2: Trend Features
Moving Average Features:
Price above/below MA (binary)
Distance from MA (continuous)
MA slope (trend direction)
MA crossover signals
Trend Strength:
ADX value
Consecutive higher highs/lower lows
Linear regression slope
R-squared of price trend
Trend Duration:
Bars since trend started
Bars since last MA cross
Time in current regime
---
Category 3: Momentum Features
Oscillators:
RSI value
RSI zone (oversold/neutral/overbought)
Stochastic %K and %D
CCI value
Rate of Change:
ROC over various periods
Momentum acceleration/deceleration
Momentum divergence from price
Relative Momentum:
Performance vs benchmark
Sector relative strength
Percentile rank of momentum
---
Category 4: Volatility Features
Range-Based:
ATR (Average True Range)
ATR ratio (current ATR / historical ATR)
Range expansion/contraction
Standard Deviation:
Rolling standard deviation
Bollinger Band width
Z-score of price
Volatility Regime:
High/low volatility classification
Volatility percentile
Volatility trend (increasing/decreasing)
---
Category 5: Volume Features
Volume Ratios:
Volume / Average volume
Volume trend (increasing/decreasing)
Relative volume by time of day
Price-Volume Relationships:
Up volume vs down volume
Volume on up days vs down days
OBV (On-Balance Volume)
Volume-price trend
Volume Patterns:
Volume spike detection
Volume climax signals
Accumulation/distribution
---
Category 6: Time Features
Calendar Features:
Day of week
Month of year
Quarter
Days until/since events (earnings, FOMC)
Session Features:
Time of day
Session (Asian, European, US)
Minutes since open/until close
Cyclical Encoding:
Sin/cos transformation for cyclical features
Preserves cyclical relationships
Day of week: sin(2π × day/7), cos(2π × day/7)
---
Category 7: Cross-Asset Features
Correlation Features:
Rolling correlation with benchmark
Correlation regime changes
Beta to market
Relative Features:
Spread between assets
Ratio between assets
Relative performance
Market Context:
VIX level and change
Sector performance
Market breadth
---
Feature Engineering Best Practices
Practice 1: Normalize Features
Raw values vary wildly across assets and time.
Methods:
Z-score: (value - mean) / std
Min-max scaling: (value - min) / (max - min)
Percentile ranking
Why: Models work better with normalized inputs.
---
Practice 2: Handle Look-Ahead Bias
Features must only use data available at prediction time.
Common Mistakes:
Using future data in calculations
Normalizing with full dataset statistics
Including target information in features
Solution: Always use rolling/expanding windows.
---
Practice 3: Create Interaction Features
Combine features to capture relationships.
Examples:
RSI × Trend direction
Volume ratio × Price change
Volatility × Momentum
Why: Captures conditional relationships.
---
Practice 4: Lag Features Appropriately
Include historical values of features.
Examples:
RSI 1 bar ago, 5 bars ago, 20 bars ago
Return over last 1, 5, 20, 60 periods
Volatility change over time
Why: Captures temporal patterns.
---
Practice 5: Test Feature Importance
Not all features help. Some hurt.
Methods:
Correlation with target
Feature importance from tree models
Ablation studies (remove and test)
Why: Reduces overfitting, improves interpretability.
---
AI-Powered Feature Engineering
1. Automated Feature Generation
AI can generate thousands of feature combinations:
Mathematical transformations
Interaction terms
Lagged versions
2. Feature Selection
AI identifies which features actually help:
Removes redundant features
Identifies most predictive features
Optimizes feature set for model
3. Dynamic Feature Weighting
AI adjusts feature importance over time:
Some features work better in certain regimes
Adaptive weighting based on recent performance
Regime-specific feature sets
4. Deep Learning Feature Extraction
Neural networks can learn features automatically:
Convolutional layers for pattern detection
Recurrent layers for sequence patterns
Attention mechanisms for importance weighting
---
Feature Engineering Mistakes
Too Many Features - More features ≠ better model. Overfitting risk increases. Curse of dimensionality. Start simple, add complexity only if needed.
Highly Correlated Features - Multiple features measuring the same thing. Redundancy without benefit. Check correlation matrix, remove duplicates.
Unstable Features - Features that change dramatically with small data changes. Unreliable in live trading. Test stability across time periods.
Ignoring Domain Knowledge - Letting AI generate features without trading logic. May find spurious patterns. Combine AI generation with human curation.
Not Testing Out-of-Sample - Features that work in-sample may fail out-of-sample. Always validate on unseen data.
---
Building Your Feature Library
Step 1: Start with Fundamentals
Returns (multiple timeframes)
Volatility (ATR, std dev)
Trend (MA relationships)
Momentum (RSI, ROC)
Volume (ratios, trends)
Step 2: Add Domain-Specific Features
What do you look for when trading?
Encode your analysis into features
Test if they add predictive value
Step 3: Create Derived Features
Combinations of base features
Regime indicators
Cross-asset relationships
Step 4: Continuously Refine
Monitor feature performance
Remove degraded features
Add new features as markets evolve
---
Key Takeaways
Feature engineering transforms raw data into meaningful model inputs
Good features often matter more than model complexity
Categories include price, trend, momentum, volatility, volume, time, and cross-asset
Always normalize, avoid look-ahead bias, and test out-of-sample
AI can automate feature generation and selection, but domain knowledge guides the process
---
Your Turn
What features do you find most predictive in your trading?
Have you experimented with creating custom features?
Share your feature engineering insights below 👇
Algotrading

The Beginner's Blueprint to Custom Trading Indicators
Your First AI‑Assisted Indicator Doesn't Need to Be Perfect - It Just Needs to Be Yours
In the AI era, you don't have to be "a coder" to build tools that actually match how you see the market.
You just need:
A clear idea
Basic Pine Script concepts
AI to help with the heavy lifting, while you fine tune/debug it.
This post is about turning that first idea into a real indicator on your chart.
---
Step 1: Start With One Sharp Idea, Not Ten Vague Ones
Instead of:
"I want an indicator that tells me when to buy and sell."
try:
"I want a trend filter that only shows long signals when price is above a 200‑MA and volatility is not extreme."
The sharper your idea, the easier it is for both you and AI to build something useful.
---
Step 2: Break the Idea Into Building Blocks
Most indicators combine a few simple components:
Trend (moving averages, higher highs/lows)
Momentum (RSI, rate of change)
Volatility (ATR, bands)
Volume (OBV, volume filters)
Your job is to decide:
Which components matter for your idea
How they should interact (AND, OR, weights)
Then you can tell AI exactly what to code instead of saying "make me something cool".
---
Step 3: Talk to AI Like a Developer, Not a Customer
When you ask AI for Pine code, be specific:
"Overlay indicator on price chart"
"Inputs for fastMA, slowMA, ATR length, ATR multiplier"
"Plot trend filter as a colored background"
"Create longCondition and shortCondition booleans"
You can even sketch the structure:
indicator("My Trend Filter", overlay = true)
// 1. Inputs
// 2. Calculations
// 3. Conditions
// 4. Plots
AI will happily fill in the gaps.
---
Step 4: Understand Before You Trust
AI can write the code, but you are still responsible for:
Reading each block and asking, "What does this do?"
Checking signals on different timeframes and markets
Confirming the indicator behaves like your original idea
Think of AI as an ultra‑fast junior dev. You’re still the lead.

Regime Detection: The AI Trader's Secret Weapon
Your Strategy Didn’t "Stop Working" - The Market Regime Changed
Every trader knows the feeling:
Same signals
Same rules
Suddenly, completely different results
Most people call this "my edge stopped working".
Often, the truth is simpler: the regime changed, but your strategy didn’t.
---
What We Really Mean by "Regimes"
Regimes are just labels for how the market is behaving:
Trending vs ranging
High volatility vs low volatility
Risk‑on vs risk‑off
AI and systematic tools see this in the data:
ATR, realized volatility, and correlation spikes
Trend strength from measures like ADX
Clustered patterns in returns and volume
You feel it as:
"Breakouts keep failing now"
"Mean‑reversion is getting steamrolled"
"Options premium isn't decaying like it used to"
Same observation, different language.
---
Why Regime Awareness Is Mandatory in the AI Era
When you use AI or algo systems, you're often:
Running the same rules from last month
On today's data
If the rules were built in one regime and deployed in another, results will diverge.
AI can help by:
Classifying days/weeks into regime buckets
Tracking how each strategy performs in each bucket
Alerting you when the regime label flips
But you still have to decide how your playbook changes when the label changes.
---
A Simple Regime → Strategy Mapping
You don’t need complex ML to get started. Even a basic map helps:
Trending + Normal Vol → Trend‑following systems sized normally
Trending + High Vol → Same systems, reduced size, wider risk buffers
Ranging + Low Vol → Mean‑reversion and carry trades
Choppy + High Vol → Trade less, focus on defense, maybe only scalp
AI can refine the labels; your job is to define what each label means for you

AI Trading Fundamentals: The Trinity of Success
Most Traders Obsess Over Strategy - and Ignore the Two Things That Actually Save Them
In the AI trading era, it's easy to get lost in models, indicators, and signal quality.
But beneath every durable trading approach — manual or automated — there are only three pillars:
Edge – a real, testable reason your trades make money over time
Risk – how much you lose when you're wrong
Execution – how consistently you follow the plan
Remove any one, and the entire structure collapses.
Pillar 1: EDGE – Why This Should Work at All
In a world of AI‑generated strategies and infinite backtests, edge has to mean more than "the curve looks nice".
Ask your system:
What market behavior is this exploiting?
Why should that behavior continue ?
What market conditions break this logic?
If your only explanation is "the bot backtested well", you don't have an edge. You have a story.
Pillar 2: RISK – How You Survive Your Own Edge
Even a strong edge comes with:
Losing trades
Losing streaks
Drawdowns that feel worse live than on paper
In the AI era, risk decisions include:
Position sizing rules for each strategy
Portfolio‑level exposure caps across multiple bots/systems
Maximum drawdown and daily loss limits that auto‑trigger when hit
Edge without risk is just leverage pointed at a wall.
Pillar 3: EXECUTION – Where Most Traders Quietly Lose
Execution is simply: Did you do what your plan said, when it said to do it?
With AI tools, this becomes:
Did you take every valid signal, or did you cherry‑pick?
Did you change parameters mid‑drawdown "to feel safer"?
Did you override bots based on fear or FOMO?
AI is excellent at pure execution. Humans are not. The hack is to let algorithms handle the rules - and keep humans in charge of designing those rules and managing risk.
Putting It Together in the AI Era
When you review your trading or systems, don't just ask "Did I make money?". Ask:
Edge: Do I still understand why this works? Has the market changed?
Risk: Are my size, drawdown limits, and kill switches clear and enforced?
Execution: How often did I actually follow the plan?
For most traders, the weakest pillar isn't edge - it's risk or execution.

Algorithmic Trading vs Manual TradingWhy the Edge Is Shifting And Why 2026 May Be a Turning Point
As this year comes to an end, it’s the perfect moment to slow down, zoom out, and ask an uncomfortable but necessary question:
Are we trading the markets — or are the markets trading us?
Whether you are in your first year of trading or have spent a decade studying charts, there comes a moment of clarity where you ask yourself:
“If I know what to do… why don’t I always do it?”
Beginners ask this after their first emotional mistake.
Experienced traders ask it after their hundredth.
The market does not punish ignorance as harshly as it punishes inconsistency.
Most traders don’t fail because they lack knowledge.
They fail because they are human.
We all know this pattern:
The entry is clear but hesitation creeps in
The stop is defined but gets adjusted “just a little”
The trend is obvious yet profits are taken too early
The system says don’t trade but emotions say this time is different
At the end of the day, trading is not a battle against the market.
It’s a battle against ourselves.
And that’s exactly where algorithmic (systematic) trading enters the game. Not as a shortcut, not as a holy grail, but as an evolution of execution.
Now, with AI evolving rapidly and tools becoming accessible to retail traders, something big is happening:
The same systematic edge institutions used for years is now available to individuals.
That raises a powerful question:
Can a system (without emotion, instinct, or fear) trade better than a human?
After spending the last 6–8 months deeply immersed in algorithmic trading, intense backtesting, rule-building, and system refinement, I came to a conclusion:
Algorithmic trading is not just the future, it’s the logical evolution of trading itself.
And I strongly believe 2026 will be a major turning point.
Let’s break this down properly.
Manual Trading (Human Trading) → The Strengths & The Silent Killers
Manual trading is where almost everyone starts and for good reason.
What humans do exceptionally well
Pattern recognition
Context awareness and regime interpretation
Macro, narrative, and sentiment understanding
Adaptation during abnormal market conditions
For experienced traders, discretion often becomes earned intuition.
But here’s the uncomfortable truth:
The better you get, the more painful your mistakes become.
Why?
Because you know better yet still break your own rules.
Humans are great at ideas.
But trading success doesn’t come from ideas.
It comes from execution → repeated thousands of times.
And this is where humans struggle most.
The Complete List of Human Trading Failures (The Real Reason Most Traders Lose)
Regardless of experience, humans share the same failure modes.
Here’s the part most people avoid talking about.
Emotional failures
Fear when price approaches entry
Greed when price runs in profit
Panic after one losing trade
Overconfidence after a winning streak
Revenge trading to “get it back”
Execution & discipline failures
Moving stop losses too early
Widening stops to avoid realizing a loss
Taking profit early because “it’s green now”
Ignoring your system once emotions kick in
Changing rules mid-trade
Cognitive biases (even in professionals)
Confirmation bias (seeing only what supports your bias)
Recency bias (overweighting the last trade)
Anchoring to entry price
Counter-trading the trend because price “feels extended”
Lifestyle & state-based issues
Trading tired
Trading stressed
Trading distracted
Trading emotionally impacted by life events
The classic question every trader has asked:
“Why did I take profit so early when the trend was obvious?”
Or:
“Why did I counter-trade when the moving averages clearly showed downside momentum?”
These aren’t skill problems.
They are human problems.
The Hard Truth: Trading Is an Execution Game
Markets reward:
Consistency
Repetition
Risk control
Statistical edge
They do not reward:
Creativity during execution
Emotional intelligence in drawdowns
Smart excuses
Execution quality determines outcomes and execution is precisely where humans are weakest.
Algorithmic Trading → What Changes When Rules Take Control
Algorithmic trading removes the weakest link in trading:
The trader.
A system:
Doesn’t feel fear, stress, fatigue, or boredom
Doesn’t reinterpret rules mid-trade
Doesn’t revenge trade
Doesn’t move stops
Doesn’t second-guess
Doesn’t hesitate
It follows rules.
Every single time.
Key advantages of algorithmic trading
Processes multiple data points simultaneously
Executes instantly during fast price action
Trades 24/7 without fatigue
Applies identical risk rules every trade
Can be objectively tested and measured
There is no emotional deviation.
And that alone is a massive edge.
“But Humans Have Instinct” — The Big Myth
Instinct is just pattern recognition shaped by experience.
And patterns can be quantified.
If a trader can explain why they take a trade
that logic can be turned into rules.
And rules can be executed better by machines.
Win Rate Reality — How High Can It Really Go?
When I began researching existing algo traders:
Some had ~60% win rates with solid returns
Some reached 70–80%
That sparked a question I wrote down and circled:
“Is a 90% win rate even possible?”
So I tested.
Started with swing trading systems
Moved to intraday
Then scalping
Simplified rules instead of complexity
Tested only what truly mattered
After months of backtesting and refinement:
Achieving high-precision win rates of 80–90% across various asset classes, with drawdowns kept to an absolute minimum.
It proved something deeper:
Precision trading is possible when emotion is removed.
Important Reality Check (Especially for Experienced Traders)
High win rate does not automatically mean profitability.
What truly matters:
Risk-to-reward
Drawdowns
Expectancy
Consistency
Longevity over multiple market regimes
A system must survive:
Trending markets
Ranging markets
High volatility
Low volatility
Durability beats elegance.
Always.
The Real Future of Trading (2025–2030)
Here’s how I see it:
More traders will become system builders, not button clickers
Manual trading will shift toward monitoring & strategy design
AI will assist in:
Data filtering
Pattern discovery
Optimization
Hybrid approaches will dominate:
Machines execute
Humans supervise
Manual trading won’t disappear
but manual execution will.
My Personal Conclusion
Manual trading becomes validation
Algorithmic trading becomes execution
Humans decide what to trade
Systems decide how to trade
That’s evolution.
Final Thoughts — End of Year Message 🎄
As the year comes to an end, take time to reflect:
What worked
What didn’t
Where emotions interfered
Where rules could replace decisions
Trading is a long-term game.
The goal isn’t to trade more
it’s to trade better.
Merry Christmas to everyone!
May the next year bring clarity, discipline and growth — both in trading and in life.
The edge is shifting.
And those who adapt early will lead.
Would love to hear your thoughts:
Are you trading fully manual?
Hybrid approach?
Or already building systems?
_________________________________
💬 If you found this helpful, drop a like and comment!

Your Trading Algorithm's Report Card: The Year-End Review
Forget New Year’s Resolutions — Give Your Trading a Real Audit
At the end of the year, most traders do one of two things:
Celebrate if they made money
Blame the market if they didn't
Neither of those changes anything.
In the AI era — where your tools can track every trade, every decision, every bot run — there's no excuse not to sit down once a year and ask: "What actually happened here?"
Why a Year‑End Audit Matters More With AI
When you're using AI tools or bots, you aren't just grading yourself. You're grading:
Your systems (manual or automated)
Your risk framework
Your behavior around those systems
Without an audit, it's easy to:
Blame the bot for what was actually poor risk management
Assume an edge that only worked in one regime
Miss the fact that overrides did more harm than good
Four Lenses for Your Year‑End Review
Performance – cold, hard numbers
Total return vs a simple benchmark ( AMEX:SPY , $CRYPTO:BTC, etc.).
Maximum drawdown — did it match what you thought you could handle?
Expectancy per trade and per system.
Process – did you do what you said you would?
How often did you follow your rules exactly?
How often did you override AI or system signals?
Did you journal or track reasons for trades?
Strategy – did your ideas actually have edge?
Which strategies carried the year?
Which consistently bled capital?
Did you unknowingly just ride a bull market?
Behavior – how you handled stress, FOMO, and drawdowns
Did you stick to size limits during losing streaks?
Did you revenge trade after losses?
Did you turn bots off or on based on feelings instead of rules?
Turning Reflection Into an Actual Plan
After the audit, write down three lists:
STOP – behaviors, markets, or strategies that clearly don't work for you.
START – habits you know would have helped (journaling, monthly reviews, better risk checks).
KEEP – strengths you want to double down on.
Then convert them into specific goals:
"Reduce discretionary overrides to <5% of total trades"
"Run walk‑forward tests on any new AI strategy before going live"
"Review performance on the first weekend of every month"
In the End, Data > Stories
The point of a year‑end audit isn't to beat yourself up.
It's to replace:
"I think I did okay this year"
with:
"My systems returned X%, max drawdown was Y%, my biggest leak was Z, and here’s exactly what I’m changing."
In a world where AI can track every detail of your trading, the traders who win are the ones willing to look at those details honestly.

Backtesting AI Strategies: The Complete Framework
Your Backtest Showing 1,000% Returns Is Probably Lying to You
In the age of AI tools and instant backtests, it's never been easier to generate beautiful equity curves.
It's also never been easier to fool yourself.
Backtesting isn't about proving your genius. It's about trying as hard as possible to break your idea before the market does.
What Backtesting Is Really For
Backtesting should answer boring, critical questions:
Does this logic have any edge beyond randomness?
How ugly do the drawdowns get when things go wrong?
Does it survive different market regimes, or only one lucky period?
What happens after costs, slippage, and realistic execution?
In the AI era, you can run thousands of tests in minutes. That doesn't mean you should trust the first curve that looks good.
The Classic Sins (Supercharged by AI)
AI makes it easy to commit every backtesting error faster:
Overfitting – Adding parameters and filters until the past looks perfect.
Look‑ahead bias – Accidentally using data that wouldn't have been known at the time.
Ignoring costs – Forgetting that spreads, fees, and slippage eat high‑frequency edges alive.
Data snooping – Testing hundreds of variants and only remembering the winners.
Each mistake quietly turns your "edge" into noise dressed up as science.
A Clean, Honest Testing Framework
You don't need a PhD. You need structure.
Write the Hypothesis First
"I think momentum in high‑volume stocks persists for 5–20 days."
Document the why before you see the results.
Split Your Data
Training: where you rough in the idea.
Validation: where you tune it.
Test: a final, untouched slice you only use once.
Compare Against Baselines
Buy‑and‑hold.
Random entries with similar risk rules.
Walk Forward
Train on past → test on the next chunk → roll forward.
Mimic how you'd actually update the system in real time.
Stress It
High vol vs low vol.
Trends, ranges, crashes.
Key Metrics That Actually Matter
Skip the exotic stats. Focus on:
Max Drawdown – Can you survive it psychologically and financially?
Expectancy – Average profit per trade after costs.
Profit Factor – Gross profits / gross losses.
Win Rate + Win/Loss Size – How often you win, and how big wins vs losses are.
Monthly Consistency – How many months are red vs green.
These tell you if the system is tradable, not just impressive.
AI's Role: Helper, Not Judge
AI can:
Generate variations you wouldn't think of
Run large test grids quickly
Estimate parameter sensitivity
But you still have to:
Define what "good" looks like
Reject fragile, curve‑fit solutions
Decide when a system has truly failed and needs to be retired
In other words, AI gives you the lab. You still have to be the scientist.

Neural Networks in Trading: Separating Hype from Reality
"99% Accurate AI" Sounds Great — Until You See the Equity Curve
If you've been around markets lately, you've seen the pitch:
Our revolutionary AI uses deep neural networks to predict the market with 99% accuracy.
In the era of big models and buzzwords, it's easy to get hypnotized by charts that go straight up. The problem isn't that neural networks are useless — it's that most people use them (and sell them) in ways that have nothing to do with real trading.
What Neural Networks Actually Do
Underneath the hype, a neural network is just a flexible function approximator:
You feed it inputs (price, volume, indicators, sentiment, etc.)
It learns internal weights that map those inputs to outputs
It adjusts those weights to reduce error on past data
They are powerful because they can model complex, non‑linear relationships. But that power is a double‑edged sword: they can also memorize noise and call it "pattern".
The Big Myths (and the Boring Reality)
Myth: "AI predicts direction with high accuracy"
Reality: Markets are adaptive. High "accuracy" often means tiny moves or rare trades.
A model that wins 90% of the time by making 0.1% might still blow up on the 10% it loses.
Myth: "Deeper = Better"
Reality: Extra layers don't magically create edge.
Often, simple models with clear logic survive regimes better than giant black boxes.
Myth: "The AI will find hidden alpha humans can't"
Reality: It can only find what exists in the data you give it .
Garbage in, overfit magic out.
The AI revolution doesn't remove the need for market understanding — it punishes the lack of it faster.
Where Neural Nets Make Sense in Trading
In the AI era, the realistic edge isn't "my network predicts the next candle". It's using ML for jobs humans are bad at:
Sentiment and Text – Classifying news and social feeds as bullish/bearish/neutral.
Regime Detection – Clustering periods into "trend", "range", "crisis", etc.
Feature Extraction – Turning raw data into useful signals that simpler rules can trade.
Execution Optimization – Deciding how to slice orders to minimize impact and cost.
In all of these, the network is a component of your system, not the entire strategy.
The Overfitting Trap (Where Most AI Traders Die)
Neural networks are overfitting machines if you don't constrain them.
Signs you're in trouble:
Almost perfect backtest equity curve
Hundreds of parameters and indicators in the input
Performance collapses when you shift the date range or symbol
A few trades account for most of the profit
Remember: the network is trying to minimize past error, not maximize future robustness.
Practical Guidelines for Using Neural Nets in the AI Era
Start With the Problem, Not the Model
"I want to forecast tomorrow's close" is vague.
"I want to classify if we're in a high‑volatility regime" is concrete.
Keep Inputs Honest
No look‑ahead data.
Use realistic, survivorship‑aware histories.
Hold Out Real Out‑of‑Sample Data
Data the model never touches during training.
Use it once as a final exam, not 20 times as another tuning set.
Prefer Simple Uses Over "Magic"
Use nets to rank or score, not to call exact highs and lows.
Combine ML outputs with transparent risk rules.
AI Is a Tool, Not a Free Lunch
Neural networks are part of the AI trading toolkit — not the holy grail.
In this era, the traders who win are the ones who can:
Ask precise questions
Understand what their models are actually doing
Say "no" to beautiful but fragile backtests
Use AI to extend your edge, not to replace thinking.

The Psychology of Letting AI Trade for YouThe Hardest Part of AI Trading Isn't the Code - It's Letting Go
You can spend months building the perfect system.
You backtest it. Tweak it. Optimize it.
And then, the first time it takes three losses in a row, you override it.
In the era of AI and automation, the battlefield has shifted. The challenge is no longer just "Can I build a system?" — it's "Can I trust it enough to let it work?"
The New Psychological Game: Humans vs Their Own Bots
We tell ourselves we want robots to remove emotion.
What actually happens is more subtle:
We stop being emotional about individual trades
We start being emotional about the system itself
Instead of:
"Should I exit this trade?"
you think:
"Is the bot broken?"
"Should I turn it off?"
"Why did it take this trade? I wouldn't have."
The emotions don't vanish. They just move up a level.
The 5 Stages of AI Trading Psychology
Euphoria – Early wins, "this thing is a money printer."
Doubt – First real drawdown, "maybe it's not as good as I thought."
Intervention – You start skipping signals, closing early, or adding your own trades.
Confusion – You can no longer tell if results are from the system or from your meddling.
Integration (or Abandonment) – Either you learn your role vs the system… or you conclude "AI doesn't work" and go back to pure manual trading.
Most traders get stuck between stages 2–4. The goal is to move to stage 5 with eyes open .
Calibrated Trust: Between Blind Faith and Total Control
Two extremes kill AI trading:
Blind Trust – "The bot knows best, I'll never question it."
Zero Trust – "I'll override whenever I feel like it."
You want calibrated trust :
You understand how the system makes decisions
You know its expected win rate, drawdown, and losing streaks
You have written rules for when you will and won't intervene
Think of it as a partnership: the AI follows the rules; you manage the environment and the risk.
Designing Your Role Before You Turn the Bot On
Before you ever hit "start", write down:
Which signals you will take without second‑guessing
Which situations require human review (major news, tech issues, extreme volatility)
Your hard stop conditions:
Max daily loss
Max drawdown
Max number of consecutive losses
Your review schedule (weekly, monthly) for performance and logic
If your rules only live in your head, your emotions will rewrite them in real time.
Emotional Hacks for the AI Era
Trade Smaller Than You Think You Should
If you can't sleep, size is too big. No psychology trick beats position sizing.
Check Less Often
Every peek at P&L triggers a reaction.
Schedule times to review, rather than watching every tick.
Journal Your Urges, Not Just Your Trades
Write down: "Wanted to stop the bot after 3 losses, didn't."
Or: "Overrode this signal, why?"
Separate Process From Outcome
Good process + bad short‑term outcome is still a win .
Bad process + good short‑term outcome is a landmine.
Your Mind Is Still the Edge
AI can:
Scan faster
Execute cleaner
Track more variables than you ever could
But only you can decide:
What risk you are truly willing to take
When a drawdown is "normal" vs unacceptable
Whether the system still makes sense in the current regime
In the AI trading era, the real edge is a calm, knowledgeable person who knows when to trust the system - and when to step back.

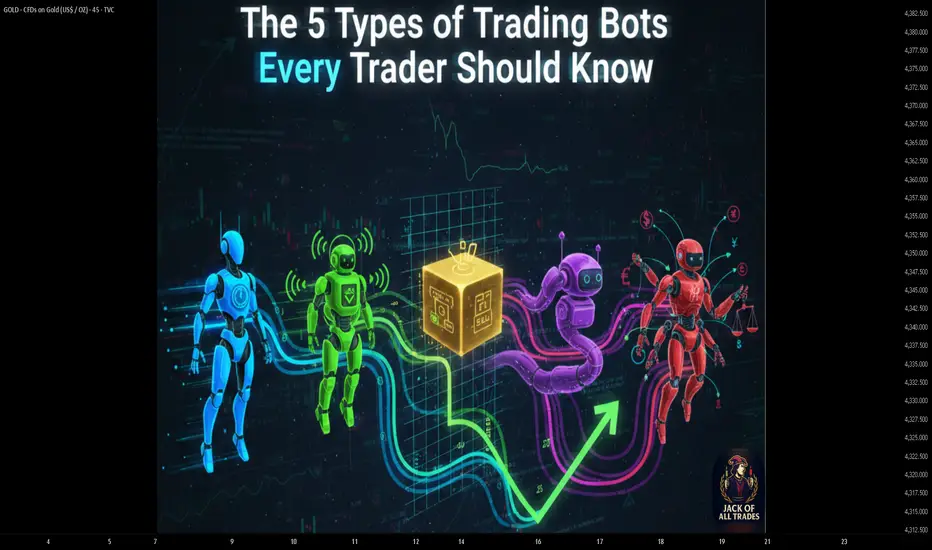
The 5 Types of Trading Bots Every Trader Should Know
Not All Trading Bots Are the Same - Some Amplify Your Edge, Some Amplify Your Pain
Saying "I want a bot" is like saying "I want a vehicle":
A Formula 1 car
A delivery truck
A scooter
A helicopter
All are vehicles. None are interchangeable.
In the era of AI‑assisted trading, bots are execution engines for your ideas. This post breaks down five major bot archetypes so you can stop hunting for "the best bot" and start matching the right structure to your market, risk profile, and skill set.
First Cold Truth: Bots Don't Create Edge — They Scale It
Before we talk types, it’s worth being brutally honest:
If your strategy has no edge, a bot just lets you lose money faster, more consistently, and with perfect discipline.
Bots are about discipline , speed , and scalability . The edge still has to come from your logic, testing, and risk framework.
Quick Map of the 5 Bot Types
Trend‑Following: Ride directional moves, ignore the noise.
Mean‑Reversion: Fade extremes, bet on snap‑backs.
Grid: Harvest volatility inside a range.
Signal‑Based: Turn ideas/alerts into consistent execution.
Arbitrage: Exploit price differences between related markets.
From here, you want to ask two things: What structure is the market in? and What structure is my brain comfortable with?
Type 1 – Trend‑Following Bots
These bots try to behave like a disciplined trend trader that never hesitates and never gets emotional.
Core idea: Buy strength in uptrends, sell weakness in downtrends.
Typical tools:
Moving‑average crossovers (fast vs slow)
Breakouts above recent highs or below recent lows
Momentum filters (e.g., ADX, rate of change, volatility filters)
Shine in: Clean, directional markets where pullbacks are shallow.
Struggle in: Sideways chop where price crosses the same levels repeatedly.
Main risk: A long sequence of small whipsaw losses when there is no real trend.
In the AI era, you can use models to classify regimes (trending vs ranging) and only let the trend bot run when the environment actually supports it.
//@version=6
indicator("Simple Trend Filter", overlay=true)
fast = ta.ema(close, 20)
slow = ta.ema(close, 50)
trendUp = fast > slow
trendDown = fast < slow
// Simple visual trend filter
plot(fast, color=color.teal)
plot(slow, color=color.orange)
bgcolor(trendUp ? color.new(color.teal, 90) : trendDown ? color.new(color.orange, 90) : na)
This kind of logic is usually just one piece of a full bot, but it shows how a trend‑following engine "sees" the market.
Type 2 – Mean‑Reversion Bots
Mean‑reversion bots assume that, most of the time, price doesn't drift off to infinity — it oscillates around some reference value.
Core idea: Fade overextended moves and bet on a return to the mean.
Typical tools:
RSI or Stochastic extremes ("overbought" / "oversold")
Touches or pierces of Bollinger Bands
Deviation from a moving average (z‑score, % distance)
Shine in: Ranging markets, stable channels, and mean‑reverting pairs.
Struggle in: Strong trends where "oversold" keeps getting more oversold.
Main risk: One big runaway move can erase many small wins if sizing and stops are not controlled.
These bots can feel smooth until they don't. AI can help here by measuring when volatility/range structure changes and cutting exposure before that "one big trend" shows up.
Type 3 – Grid Bots
Grid bots are volatility harvesters. They care less about direction and more about price oscillating through pre‑defined levels.
Core idea: Place a ladder of buy and sell orders above and below price.
Profit engine: As price bounces through the grid, the bot systematically buys lower, sells higher, and repeats.
Shine in: Sideways but active markets that revisit levels frequently.
Struggle in: Strong one‑way moves that blow through the grid and never mean‑revert.
Main risk: Deep, unrealized drawdowns if price trends hard against the grid without a safety mechanism.
Smart grid design in the AI era often includes:
Dynamic grid width that widens or tightens based on volatility
Max drawdown or margin‑usage limits that trigger a partial or full shutdown
Regime filters that turn the grid off when a strong trend is detected
Type 4 – Signal‑Based Bots
Signal bots don't "think" on their own – they are pure executors. Their job is to turn a human or model‑generated signal into consistent, rules‑based action.
Core idea: Separate idea generation from order execution .
Signal sources can include:
Multi‑indicator confluence (trend + volume + volatility)
Pattern recognition (breakouts, candle patterns, structures)
Order‑flow or whale‑tracking alerts
On‑chain, macro, or sentiment data for crypto and indices
Shine in: Any market where the underlying signal logic has been tested and proven.
Struggle in: Environments where the signal is over‑fitted, delayed, or not monitored.
Main risk: Blind faith in a black‑box signal without understanding its limits.
This is where AI often plugs in directly – models generate scores or labels, and the bot simply acts when the score crosses a threshold.
Type 5 – Arbitrage Bots
Arbitrage bots focus on relationships instead of single charts. They look for small, temporary mispricings and try to lock them in.
Core idea: Buy where something is cheap and sell where it's expensive, as close to simultaneously as possible.
Common approaches:
Same asset, different exchanges (spot vs spot or spot vs perp)
Triangular FX arbitrage between three currency pairs
Statistical arbitrage between correlated assets that have diverged
Shine in: Fragmented, less efficient markets with occasional big gaps.
Struggle in: Highly efficient markets where spreads and latency competition eat the edge.
Main risk: Execution risk – slippage, fees, and delays can flip a theoretical "risk‑free" trade into a losing one.
These are the most infrastructure‑heavy bots. Latency, connectivity, fee structure, and capital sizing matter as much as the model itself.
Choosing Your Bot in the AI Era
Instead of asking "Which bot makes the most?", ask:
What market structure am I actually trading most of the time?
How much drawdown and variance am I truly comfortable with?
Am I more aligned with riding trends or fading extremes?
What is my technical and infrastructure level right now?
Where can AI realistically help me – signal quality, risk controls, or execution?
AI can support you by:
Classifying regimes (trend vs range) and routing orders to the right bot type
Monitoring portfolio‑level risk across multiple bots and symbols
Detecting when performance degrades and suggesting parameter reviews
But the decision of which bot to run, when to turn it off, and how to size it is still your responsibility.
Your Turn
Which of these five bot types actually fits your temperament and the markets you trade right now?
If you had to upgrade one layer of your automation with AI today - signal generation, risk management, or execution - which one would move the needle the most for you?
Share it below. The clearer you are about what kind of bot you’re running and why , the less you’ll ever have to blame "the bot" when the outcome doesn’t match the plan.
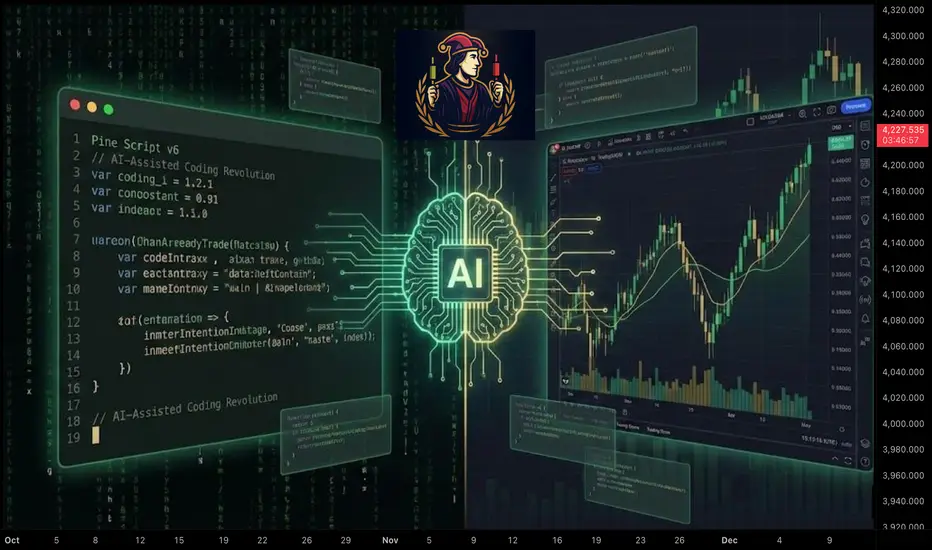
Pine Script v6: The AI-Assisted Coding RevolutionAI Isn't Replacing Pine Script Developers, It's Creating More of Them
For years, if you wanted custom tools on $TRADINGVIEW, you had two options:
Spend months learning to code, or
Settle for whatever public indicators were available
The era of AI assisted Pine Script changes that. You don't have to choose between "coder" and "trader" anymore, you can be both, with AI as your quiet co‑pilot.
Why Pine Script + AI Is a Big Deal
In the new AI trading era, edge comes from:
Being able to test ideas quickly
Turning those ideas into rules
Automating those rules in a language the platform understands
AI can't give you edge by itself. But it can remove almost all of the friction between the idea in your head and a working NYSE:PINE script on your chart.
Instead of:
Googling syntax
Copy‑pasting random snippets
Debugging mysterious errors at 2am
you can describe your logic in plain language and let AI handle the boilerplate, while you stay in control of the trading logic.
The Modern Pine Script Workflow (AI Edition)
Old workflow:
Learn programming basics from scratch
Read documentation line‑by‑line
Write every line of code yourself
Fix every typo and bug manually
New workflow:
Define the strategy in plain English
Ask AI to draft the first version in Pine Script v6
Review and understand what it wrote
Refine, test, and harden it on your charts
The difference isn't "AI does everything" it's AI accelerates everything . You move from "How do I code this?" to "Is this idea actually good?" much faster.
What AI Is Great At in Pine Script
Syntax and Structure - Getting the small details right:
`indicator()` declarations
`strategy()` settings
Inputs, colors, line styles
Common functions like `ta.sma`, `ta.rsi`, `ta.crossover`
Boilerplate Code - The parts that repeat across almost every script:
Input sections
Plotting logic
Alert conditions
Explaining Code Back to You - You can paste a snippet and ask:
"What does this variable do?"
"Why is this `if` statement here?"
"Can you rewrite this more clearly?"
This is how you learn Pine Script by doing , instead of from a dry textbook.
What AI Is NOT Good At (If You Rely on It Blindly)
Designing Your Edge - AI doesn't know your risk tolerance, timeframe, or style. You still have to define the actual trading idea.
Protecting You From Over‑Optimization Ask it to "improve" a strategy and it may add 20 inputs that look perfect on past data and fail live.
Understanding Market Context - It can code the rules, but it doesn't "feel" what a trend, rotation, or macro regime shift means to you.
Use AI as a smart assistant, not an oracle.
Core Pine Script Concepts You Still Need
Even in the AI era, a few fundamentals are non‑negotiable. Think of them as the alphabet you must know, even if AI writes the sentences:
1. Data Types
float // prices, indicator values
int // bar counts, lengths
bool // conditions (true/false)
string // labels, messages
color // styling
2. Series Logic
Every variable in Pine is a time series . You don't just have `close`, you have `close `, `close `, etc.
close // current bar close
close // previous bar close
high // high from 5 bars ago
3. Built‑In Indicator Functions
You don't need to reinvent moving averages and RSI:
ma = ta.sma(close, 20)
rsi = ta.rsi(close, 14)
longCondition = ta.crossover(close, ma)
If you understand what these do, AI can handle how to wire them together.
A Clean AI‑Assisted Workflow to Build Your Next Indicator
Write the idea in plain language
"I want a trend filter that only shows long signals when price is above a 200‑period MA and volatility is not extreme."
Ask AI for a first draft in Pine Script v6
Specify: overlay or separate pane, inputs you want, and what should be plotted.
Read every line
Use AI as a teacher: "Explain this variable", "Explain this block".
Test on multiple markets and timeframes
Does it behave the way you expect on CRYPTOCAP:FOREX , $CRYPTO, and stocks?
Does it break on higher timeframes or very illiquid symbols?
Iterate, don't chase perfection
Tweak one idea at a time.
Avoid adding endless inputs just to fix old trades.
The Bigger Picture: Coders, Traders, and the AI Era
The old split was:
"Coders" who could build things but didn't trade
"Traders" who had ideas but couldn't code them
In the AI era, that wall disappears. The trader who can:
Describe ideas clearly
Use AI to generate Pine code
Understand enough to test and refine
…gets a massive edge over both pure coders and pure discretionary traders.
You don't need to be perfect. You just need to be dangerous, one well‑tested script at a time.
Your Turn
If you could build one custom tool this month with AI's help, what would it be?
An entry signal? A dashboard? A risk overlay?
Drop your idea below and consider this your sign to finally turn it into code.
AI Trading: The Revolution You Can't IgnoreThe Era of AI Trading Has Arrived And It's Only Getting Started
Forget the movie version of AI glowing red eyes flawlessly predicting every tick. The real story is colder, quieter, and way more powerful:
We are moving from a world where humans look at charts to a world where machines digest every tick, every candle, every flow of data… and feed you the edge you couldn't see on your own.
Right now, as you read this, AI is already sitting inside:
Execution algorithms routing institutional orders across venues
Risk engines stress testing portfolios in milliseconds
News and sentiment scanners parsing thousands of headlines a minute
Retail tools that turn a paragraph of English into working NYSE:PINE Script
This isn't science fiction. This is the baseline. And the baseline is rising.
The traders who survive this decade won't be the ones fighting AI. They'll be the ones partnering with it.
So What Exactly Is "AI Trading"?
At its core, AI trading is simply using algorithms that can learn from data to make parts of the trading process smarter.
That can mean anything from a small script that filters charts for you, all the way up to full stack systems managing billions. The spectrum looks like this:
AI Assisted Analysis You still click the buttons, but AI does the heavy lifting.
Pattern recognition on charts (trend, ranges, breakouts)
Scanning hundreds of symbols for your exact conditions
Sentiment analysis on news and earnings headlines
Idea generation: "Show me all large‑cap stocks breaking out with above‑average volume"
AI‑Generated Signals The machine tells you what it would do; you decide whether to listen.
Multi‑indicator models that output clear long/short/flat signals
Quant models that score each asset from 0-100 based on your rules
Bots that push alerts when high‑probability setups appear
Fully Automated Trading The system trades end‑to‑end while you supervise.
Execution from signal → order → risk control with no manual clicks
Self adjusting position sizing and risk controls
Strategies that re‑train on fresh data as regimes shift
Wherever you are on that spectrum, you're already in the AI game. The question isn't "Will I use AI?" it's "How deeply will I let it into my process?"
How AI Actually "Sees" the Market
Humans see a chart. AI sees a dataset.
Human view:
One instrument at a time
A couple of timeframes
A handful of indicators you like
Heavily filtered through emotion and bias
AI view:
Thousands of symbols at once
Dozens of timeframes and derived features
Years of historical data compressed into patterns
Zero fear, zero FOMO, zero boredom
Feed a model clean data and it can uncover:
Regimes you feel but can't quantify (trend, chop, grind, panic)
Relationships between assets that hold statistically
Behavioral patterns like "late‑day reversals after gap‑up opens"
Execution patterns in the order book around key levels
But here's the crazy part: AI is completely unforgiving about your assumptions.
If the data is noisy, biased, or poorly structured, the model will happily learn the wrong thing and apply it with perfect discipline. "Garbage in, garbage out" gets amplified at machine speed.
The Era We're Entering: Human + AI, Not Human vs AI
Over the next decade, expect three shifts to accelerate:
From Intuition First → Data‑First
Traders will still have hunches, but they'll validate them against hard data.
Instead of "this looks extended", you'll ask the system: "How often do moves like this actually continue?" and get an answer in seconds.
From Single‑Indicator Thinking → Multi‑Signal Models
No more worshiping one magic oscillator.
AI will blend technicals, fundamentals, flows, and sentiment into a unified view.
From Static Systems → Adaptive Systems
Instead of one set of parameters forever, models will adapt as volatility, liquidity, and structure change.
Think of it as a trading playbook that rewrites itself when the game changes.
Technologies like larger language models, specialized chips, and eventually quantum‑accelerated optimization won't magically "solve" markets, but they will make it cheaper and faster to test ideas, build systems, and manage risk.
The edge shifts from "Can I code this?" to "Can I ask the right questions, define the right constraints, and manage the risk around what the models tell me?"
Where You Fit In As a Trader
In the era of AI, your job becomes less about staring at every tick, and more about designing the rules of the game your tools play.
You define what "good" trades look like.
You choose which markets, timeframes, and risks matter.
You decide when a model is behaving, and when it's time to shut it off.
AI gives you:
Speed: scanning what you could never cover alone
Consistency: executing the plan without emotional drift
Feedback: showing you what really works in your own data
You bring:
Context: macro, narrative, and common sense
Values: what risks you refuse to take
Adaptability: knowing when to step back or switch regimes
Put together, that's where the edge lives.
Getting Started in the AI Era (Without Getting Overwhelmed)
You don't need a PhD, a server rack, or a lab full of quants. You can start small and intelligent:
Audit Your Current Process
Where are you slow? (Scanning, journaling, testing?)
Where are you emotional? (Entries, exits, sizing?)
Those are prime targets for AI assistance.
Add One AI Tool at a Time
Maybe it's an AI screener.
Maybe it's an NYSE:PINE Script assistant that helps you code and backtest.
Maybe it's a journaling tool that tags your trades automatically.
Learn to Read the Data Behind the Magic
Look at win rate, drawdown, expectancy.
Compare AI filtered setups to your old ones.
Keep what clearly improves your edge; drop the rest.
Respect the Risks
Over‑fitted models that look perfect on the past.
Black‑box systems you can't explain.
Over‑reliance on automation with no kill switch.
Is AI Going to Take Over Trading Completely?
In some corners of the market, AI and automation already dominate . High‑frequency execution, index rebalancing, options market‑making, these domains are machine territory.
But markets are more than math. They are human fear, greed, regulation, politics, liquidity constraints, structural changes and unexpected shocks. That messy mix is exactly where human oversight still matters.
The most realistic future isn't "AI replaces traders" it's AI replaces undisciplined, unstructured traders who bring nothing but guesses to the table.
Traders who can think in systems, understand risk, and collaborate with machines? They don't get replaced. They get leverage.
Your Turn
Where are you right now in this evolution?
Still fully manual, doing everything by hand?
Using a few AI assisted tools but not trusting them yet?
Already running bots and systematic strategies?
What part of AI trading are you most curious or skeptical about?
And the big question: Do you think the future of trading belongs to AI, or to traders who know how to use it?
Drop your thoughts in the comments this era is just beginning.

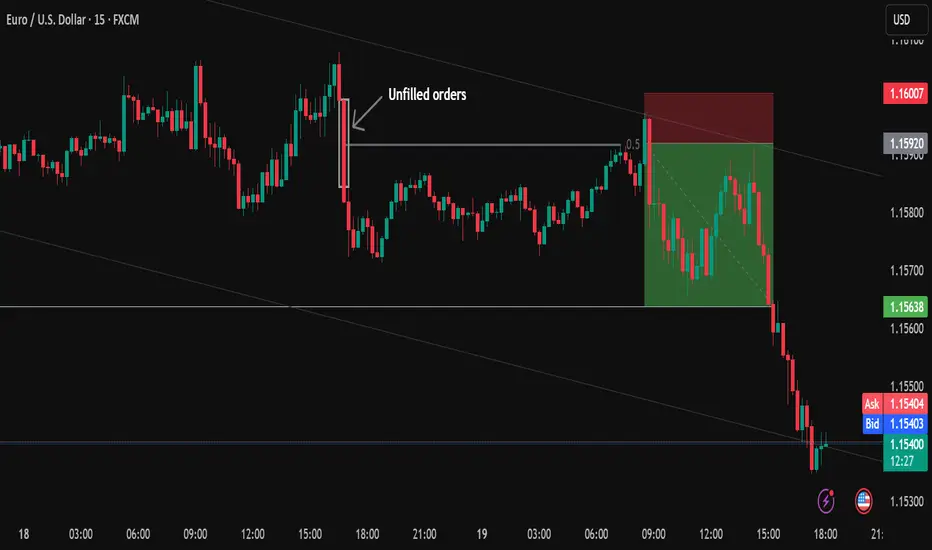
The market isn’t random. It’s driven by algorithms.The market is not arbitrary. It is powered by algorithms that essentially accomplish just two tasks:
either push the price in the direction of the next liquidity pool or pull it back to fill the orders they missed en route, such as leftover blocks, imbalances, and unfulfilled orders.
Understanding that basic behavior is the foundation of everything I trade.
Since it indicates where the algorithm is attempting to go next, I begin with the higher-timeframe trend.
Then, in order to determine which side is in control, I wait for a powerful push, a distinct, quick displacement.
The algorithm nearly always retraces slowly after that push because it must return to correct imbalances and complete the orders it overlooked.
Additionally, that gradual decline indicates that the trend is still going strong.
A quick or forceful pullback indicates that the algorithm is probably changing course because it is creating new imbalances rather than going back to correct the previous ones.
I therefore only accept trades when the price gradually returns to my order blocks, imbalances, or prior liquidity areas before moving on to the next pool of liquidity.
I don't forecast highs or lows.
I do not oppose the market.
All I'm doing is following the algorithm as it shifts from one liquidity pool to the next, making any necessary corrections before moving on.
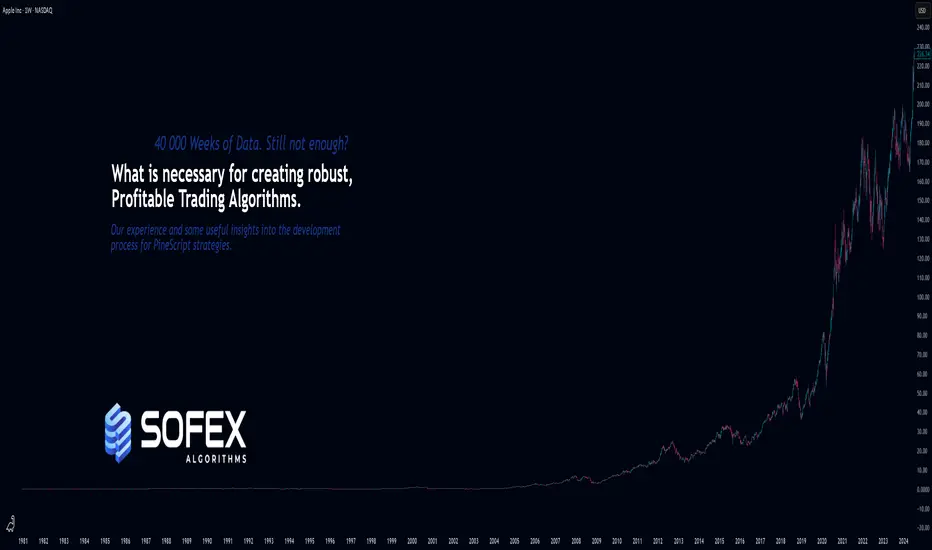
A few important steps for creating robust and winning StrategiesAs the title says, I want to share knowledge & important insights into the best practices for creating robust, trustworthy and profitable trading Strategies here on TradingView.
These bits of information that my team I have gathered throughout the years and have managed to learn through mostly trial and error. Costly errors too .
Many of these points more professional traders know, however, there are some that are quite innovative for all levels of experience in my opinion. Please, feel free to correct me or add more in the comments.
There are a few strategic and tactical changes to our process that made a noticeable difference in the quality of Strategies and Indicators immediately.
Firstly and most importantly, we have all heard about it, but it is having the most data available. A good algorithm, when being built NEEDS to have as many market situations in its training data as possible. Choppy markets, uptrends, downtrends, fakeouts, manipulations - all of these are necessary for the strategy to learn the possible market conditions as much as possible and be prepared for trading on unknown data.
Many may have heard the phrase "History doesn't repeat itself but rhymes well" - you need to have the whole dictionary of price movements to be able to spot when it rhymes and act accordingly.
The TradingView Ultimate plan offers the most data in terms of historical candles and is best suited for creating robust strategies.
___
Secondly, of course, robustness tests. Your algorithm can perform amazingly on training data, but start losing immediately in real time, even if you have trained it on decades of data.
These include Monte-carlo simulations to see best and worst scenarios during the training period. Tests also include the fundamentally important out-of-sample checks . For those who aren’t familiar - this means that you should separate data into training sets and testing sets. You should train your algorithm on some data, then perform a test on unknown to the optimization process data. It's common practice to separate data as 20% training / 20% unknown / 20% training etc. to build a data set that will show how your algorithm performs on unknown to it market movements. Out of sample tests are crucial and you can never trust a strategy that has not been through them.
Walk-forward simulations are similar - you train your algorithm on X amount of data and simulate real-time price feeds and monitor how it performs. You can use the Replay function of TradingView to do walk-forward tests!
When you are doing robustness tests, we have found that a stable strategy performs around 90% similarly in terms of win rate and Sortino ratio compared to training data. The higher the correlation between training performance and out of sample performance, the more risk you can allocate to this algorithm.
___
Now lets move onto some more niche details. Markets don’t behave the same when they are trending downward and when they are trending upwards. We have found that separating parameters for optimization into two - for long and for short - independent of each other, has greatly improved performance and also stability.
Logically it is obvious when you look at market movements. In our case, with cryptocurrencies, there is a clear difference between the duration and intensity of “dumps” and “pumps”. This is normal, since the psychology of traders is different during bearish and bullish periods. Yes, introducing double the amount of parameters into an algorithm, once for long, once for short, can carry the risk of overfitting since the better the optimizer (manual or not), the better the values will be adjusted to fit training data. But if you apply the robustness tests mentioned above, you will find that performance is greatly increased by simply splitting trade logic between long and short. Same goes for indicators.
Some indicators are great for uptrends but not for downtrends. Why have conditions for short positions that include indicators that are great for longs but suck at shorting, when you can use ones that perform better in the given context?
___
Moving on - while overfitting is the main worry when making an algorithm, underoptimization as a result of fear of overfitting is a big threat too . You need to find the right balance by using robustness tests. In the beginning, we had limited access to software to test our strategies out of sample and we found out that we were underoptimizing because we were scared of overfitting, while in reality we were just holding back the performance out of fear. Whats worse is we attributed the losses in live trading to what we thought was overfitting, while in reality we were handicapping the algorithm out of fear.
___
Finally, and this relates to trading in general too, we put in place very strict rules and guidelines on what indicators to use in combination with others and what their parameter range is. We went right to theory and capped the values for each indicator to be within the predefined limits.
A simple example is MACD . Your optimizer might make a condition that includes MACD with a fast length of 200, slow length of 160 and signal length of 100. This may look amazing on backtesting and may work for a bit on live testing, but these values are FUNDAMENTALLY wrong (Investopedia, MACD). You must know what each indicator does and how it calculates its values. Having a fast length bigger than the slow one is completely backwards, but the results may show otherwise.
When you optimize any strategy, manually or with the help of a software, be mindful of the theory. Mathematical formulas don’t care about the indicator’s logic, only about the best combination of numbers to reach the goal you are optimizing for - be it % Return, Profit Factor or other.
Parabolic SAR is another one - you can optimize values like 0.267; 0.001; 0.7899 or the sort and have great performance on backtesting. This, however, is completely wrong when you look into the indicator and it’s default values (Investopedia, Parabolic SAR).
To prevent overfitting and ensure a stable profitability over time, make sure that all parameters are within their theoretical limits and constraints, ideally very close to their default values.
Thank you for reading this long essay and I hope that at least some of our experience will help you in the future. We have suffered greatly due to things like not following trading theory and leaving it all up to pure mathematical optimization, which is ignorant of the principles of the indicators. The separation between Long / Short logic was also an amazing instant improvement.
View the linked idea where we explain the psychology of risk management and suggest a few great ways to calculate and manage your risk when trading - just as important as the strategy itself!
What do you think? Do you use any of these methods; Or better ones?
Let us know in the comments.
HOW TO Master Algo Trading: Essential Skills for Modern Trading🤖 Algo trading isn’t just about letting robots do the heavy lifting.
It’s also not letting a machine take over your trading.
Algo trading uses computer programs to help you to automate buying and selling in financial markets based on set rules.
So if you have a mechanical system with a track record, you’re on your way of becoming an algo trader.
BUT… There are always ways to improve your trading and there are elements you can use to become a more proficient algo trader.
Let’s get into them.
🔢 Element #1: Experience with Database Management and Data Analysis
Data is your best friend when it comes to algo trading.
You need to know the trading game plan before you take your first trade.
It’s like building your city with an end goal.
You need a map, you need the tools, you need a worst-case scenario plan etc…
Data analysis, on the other hand, allows you to extract meaningful insights from this data.
You need to know how back, forward and real test your system, strategy and results.
The more data you have, the more significant edge you’ll have over those who rely on gut feeling alone.
📊 Element #2: Knowledge of Statistical Analysis
Statistical analysis and machine learning are the backbone of successful algo trading.
They empower you to create models that predict market movements and optimize trading strategies.
This is where your important rules, criteria and decisions come.
E.g.
When do you halt trading after a drawdown.
When do you consider a medium and high probability trade.
When do you consider a medium to high probability day.
What do you consider high, medium and low probability markets.
Do you know how to handle Pre-market movers?
Remember, markets are influenced by countless factors, and understanding these relationships requires robust statistical tools.
💹 Element #3: Understand Financial Markets and Trading Strategies
While technology drives algo trading, understanding the financial markets is crucial.
You need to grasp how different markets operate, from stocks, indices, commodities and Forex with their unique characteristics of each.
Each market has it’s own personality and demeanor. For example, for the life of me my system does NOT work with the EUR/USD – The most popular currency of all time. And I’ve accepted that.
Without this understanding, you might as well be throwing darts at a board while blindfolded.
🕵️ Element #4: Strong Analytical and Problem-Solving Skills
Markets are unpredictable.
They are also random and uncertain.
They throw curveballs when you least expect them.
Your winning streaks can last longer than you think.
But so can your drawdowns.
And that period where the market moves sideways, can make a trader go crazy.
That’s why strong analytical and problem-solving skills are vital.
When an algorithm isn’t performing as expected, you need to diagnose the issue swiftly and effectively.
Think of it like being a detective in the trading world.
You need to analyze patterns, identify anomalies, and adjust your strategies to stay on top. This requires a sharp, analytical mind and a knack for solving complex problems under pressure.
🧠 Element #5: Attention to Detail and Ability to Work Under Pressure
In algo trading, the devil is in the details.
One small error in your system can lead to significant financial losses.
One wrong parameter in your moving average or indicator, and it could determine a failed strategy.
Therefore, meticulous attention to detail is non-negotiable.
And you need to adapt like a robot because trading is definitely working under pressure.
This is a skill that we are NOT born with but one must learn through sheer will and hard experience.
Financial markets operate at lightning speed, and decisions often need to be made in real-time.
The ability to stay calm and focused in such an environment can make or break your trading success.
Final words:
Mastering algo trading requires a blend of technical skills, market knowledge, and the right tools.
Let’s sum up what it is and what you need to master the skills.
Algo trading, or algorithmic trading, involves using computer algorithms to automate trading decisions based on predefined criteria and market data analysis. It aims to execute trades at optimal speeds and prices, leveraging technology to minimize human error and emotional bias.
The skills you need to master are:
Element #1: Experience with Database Management and Data Analysis
Element #2: Knowledge of Statistical Analysis
Element #3: Understand Financial Markets and Trading Strategies
Element #4: Strong Analytical and Problem-Solving Skills
Element #5: Attention to Detail and Ability to Work Under Pressure
USDJPY FXAN & Heikin Ashi exampleIn this video, I’ll be sharing my analysis of USDJPY, using FXAN's proprietary algo indicators with my unique Heikin Ashi strategy. I’ll walk you through the reasoning behind my trade setup and highlight key areas where I’m anticipating potential opportunities.
I’m always happy to receive any feedback.
Like, share and comment! ❤️
Thank you for watching my videos! 🙏

Automated Execution: TradingView Alerts → Tradovate using AWS LaI’ve built a fully automated pipeline that takes live TradingView alerts and turns them into real orders in Tradovate. Here’s how it works, step by step (I will provide a video on it):
PineScript Alerts
My indicator/strategy in TradingView fires alert() with a JSON payload (symbol, side, qty, price, ATR, ENV).
Webhook to AWS
Alerts hit an API Gateway endpoint in AWS, invoking a Lambda function.
Lambda Processing
Parse the JSON from TradingView.
Calculate Stop‐Loss & Take‐Profit using ATR.
Authenticate to the Tradovate API (demo & live environments).
Place an OCO order (placeOSO) with proper bracket legs.
Send a confirmation message to my Telegram channel.
Tradovate REST API
Auth: POST /auth/accesstokenrequest → accessToken
List accounts: GET /account/list → find accountId
Place OCO: POST /order/placeOSO with entry, SL, TP
Testing & Monitoring
Local smoke tests of Telegram bot.
Lambda console test events for sample payloads.
CloudWatch logs for debugging & alerts on errors.
Why it matters:
Zero manual steps from signal to fill.
Consistent risk management via ATR‐based SL/TP.
Clear audit trail: logs in AWS + Telegram notifications.
Educational resource for anyone building similar setups
Feel free to ask questions or suggest improvements! Please leave comments.

Volume Speaks Louder: My Custom Volume Indicator for Futures
My Indicator Philosophy: Think Complex, Model Simple
In my first “Modeling 101” class as an undergrad, I learned a mantra that’s stuck with me ever since: “Think complex, but model simple.” In other words, you can imagine all the complexities of a system, but your actual model doesn’t have to be a giant non-convex, nonlinear neural network or LLM—sometimes a straightforward, rule-based approach is all you need.
With that principle in mind, and given my passion for trading, I set out to invent an indicator that was both unique and useful. I knew countless indicators already existed, each reflecting its creator’s priorities—but none captured my goal: seeing what traders themselves are thinking in real time . After all, news is one driver of the market, but you can’t control or predict news. What you can observe is how traders react—especially intraday—so I wanted a simple way to gauge that reaction.
Why intraday volume ? Most retail traders (myself included) focus on shorter timeframes. When they decide to jump into a trade, they’re thinking within the boundaries of a single trading day. They rarely carry yesterday’s logic into today—everything “resets” overnight. If I wanted to see what intraday traders were thinking, I needed something that also resets daily. Price alone didn’t do it, because price continuously moves and never truly “starts over” each morning. Volume, however, does reset at the close. And volume behaves like buying/selling pressure—except that raw volume numbers are always positive, so they don’t tell you who is winning: buyers or sellers?
To turn volume into a “signed” metric, I simply use the candle’s color as a sign function. In Pine Script, that looks like:
isGreenBar = close >= open
isRedBar = close < open
if (not na(priceAtStartHour))
summedVolume += isGreenBar ? volume : -volume
This way, green candles add volume and red candles subtract volume, giving me positive values when buying pressure dominates and negative values when selling pressure dominates. By summing those signed volumes throughout the day, I get a single metric—let’s call it SummedVolume—that truly reflects intraday sentiment.
Because I focus on futures markets (which have a session close at 18:00 ET), SummedVolume needs to reset exactly at session close. In Pine, that reset is as simple as:
if (isStartOfSession())
priceAtStartHour := close
summedVolume := 0.0
Once that bar (6 PM ET) appears, everything zeroes out and a fresh count begins.
SummedVolume isn’t just descriptive—it generates actionable signals. When SummedVolume rises above a user-defined Long Threshold, that suggests intraday buying pressure is strong enough to consider a long entry. Conversely, when SummedVolume falls below a Short Threshold, that points to below-the-surface selling pressure, flagging a potential short. You can fine-tune those thresholds however you like, but the core idea remains:
• Positive SummedVolume ⇒ net buying pressure (bullish)
• Negative SummedVolume ⇒ net selling pressure (bearish)
Why do I think it works: Retail/intraday traders think in discrete days. They reset their mindset at the close. Volume naturally resets at session close, so by signing volume with candle color, I capture whether intraday participants are predominantly buying or selling—right now.
Once again: “Think complex, model simple.” My Daily Volume Delta (DVD) indicator may look deceptively simple, but five years of backtesting have proven its edge. It’s a standalone gauge of intraday sentiment, and it can easily be combined with other signals—moving averages, volatility bands, whatever you like—to amplify your strategy. So if you want a fresh lens on intraday momentum, give SummedVolume a try.

Behind the Buy&Sell Strategy: What It Is and How It WorksWhat is a Buy&Sell Strategy?
A Buy&Sell trading strategy involves buying and selling financial instruments with the goal of profiting from short- or medium-term price fluctuations. Traders who adopt this strategy typically take long positions, aiming for upward profit opportunities. This strategy involves opening only one trade at a time, unlike more complex strategies that may use multiple orders, hedging, or simultaneous long and short positions. Its management is simple, making it suitable for less experienced traders or those who prefer a more controlled approach.
Typical Structure of a Buy&Sell Strategy
A Buy&Sell strategy consists of two key elements:
1) Entry Condition
Entry conditions can be single or multiple, involving the use of one or more technical indicators such as RSI, SMA, EMA, Stochastic, Supertrend, etc.
Classic examples include:
Moving average crossover
Resistance breakout
Entry on RSI oversold conditions
Bullish MACD crossover
Retracement to the 50% or 61.8% Fibonacci levels
Candlestick pattern signals
2) Exit Condition
The most common exit management methods for a long trade in a Buy&Sell strategy fall into three categories:
Take Profit & Stop Loss
Exit based on opposite entry conditions
Percentage on equity
Practical Example of a Buy&Sell Strategy
Entry Condition: Bearish RSI crossover below the 30 level (RSI oversold entry).
Exit Conditions: Take profit, stop loss, or percentage-based exit on the opening price.

Algorithmic vs. Quantitative Trading: Which Path Should You TakeI’ve always wondered why anyone would stick to traditional trading methods when algorithms and mathematical models could do all the heavy lifting.
I started questioning everything:
• Why do so many mentors still swear by discretionary trading when algorithms could handle all the heavy lifting?
• Do they really have solid proof of their “own” success, or is it just talk?
• Or are they keeping things complex and discretionary on purpose, to confuse people and keep them as members longer?
• Why deal with the stress of emotions and decisions when an algorithm can take care of it all?
• Imagine how much further ahead you could be if you stopped wasting time on manual trades and instead focused on market research and developing your own models.
When I first got into trading, I thought Algorithmic Trading and Quantitative Trading were basically the same thing. But as I dug deeper, I realized they’re two completely different worlds.
Algorithmic Trading: It’s simple – you set the rules and the algorithm executes the trades. No more sitting in front of the screen “controlling your emotions” and trying to manage every little detail. Instead, you let the algorithm handle it, based on the rules you’ve set. It frees up your time to focus on other things rather than staring at price charts all day.
But here’s the thing – it’s not perfect. You’ll still need to test the rules to make sure the data and results you’re getting aren’t overfitted or just random.
Quantitative Trading: A whole different level. It’s not just about executing trades; it’s about understanding the data and math behind market movements. You analyze historical price, economic, and political data, using math and machine learning to predict the future. But it can be complex – techniques like Deep Learning can turn it into a serious challenge.
The upside? This is the most reliable way to trade, and it’s exactly what over 80% of hedge funds do. They rely on quant models to minimize risk and to outperform the market.
So, which path should you choose?
Quantitative Trading can feel overwhelming at first, I recommend starting with the basics. Begin with Pine Script coding in TradingView—start building a foundation with simple strategies and indicators. As you grow more confident, start coding your own ideas into rules and refining your approach to eventually automated your trading strategy.
TradingView is a great tool for this, and I’d highly suggest grabbing the Premium plan. This will give you access to more data and features to make your learning journey smoother.
Dive into the Pine Script documentation , and begin bringing your ideas to life.
I promise, the more you focus on this, the better and more independent you’ll become in trading.
Every day, aim to get just 1% better.
To Your success,
Moein

Options: Why the Odds Are Stacked Against YouThe Hidden Challenges of Options Trading:
Options trading may seem like an exciting way to profit from market movements, but beneath the surface lies a trading environment that is heavily biased against individual traders. Many retail investors jump into options trading unaware of the many disadvantages they face, making it more of a gamble than a calculated investment. In this post, we’ll explore the major challenges that make options trading so difficult for individual traders and why you need more than luck to succeed.
1. The Odds Are Biased: Complex Algorithms Unlevel the Playing Field
The first thing to understand is that the playing field is not even. Professional traders and market makers use complex algorithms that evaluate a wide range of factors—volatility, market conditions, historical data, time decay, news and more—before they even think about entering a trade. These systems are designed to assess risks, manage exposure, and execute trades with a precision that most individual traders simply can’t match.
For an individual trader, manually analyzing these factors or using basic tools available online is nearly impossible. By the time you’ve analyzed one factor, the market may have already shifted. The reality is that unless you have access to these advanced algorithmic systems, you're trading with a massive handicap.
2. Market Makers Hold the Upper Hand: Your Trades Are Their Game
Market makers play a critical role in options trading by providing liquidity. However, they also hold an unbeatable advantage. They see both sides of the trade, control the bid-ask spreads, and use their position to ensure they’re on the winning side more often than not. For them, it’s not about making speculative bets; it’s about managing risk and profiting from the flow of orders they receive.
When you trade options, you're often trading against these market makers, and their strategies are designed to maximize their advantage while minimizing their risk. This means your trades are, in essence, a bad gamble from the start. The house always wins, and in this case, the house is the market maker.
3. They Will Fool You Every Time: Bid-Ask Spreads and the Math You Don’t See
One of the most overlooked challenges in options trading is understanding the bid-ask spread. This spread represents the difference between the price you can buy an option (ask) and the price you can sell it (bid). While this may seem straightforward, it’s an area where professionals easily outsmart retail traders.
Advanced traders and market makers use complex mathematical models to manage and manipulate these spreads to their advantage. If you don’t have the mathematical skills to properly evaluate whether the spread is fair or skewed, you’re setting yourself up to overpay for options, leading to unnecessary losses.
4. Information and Tools: A Professional-Only Advantage
Another critical challenge is the vast difference in information and tools available to retail traders versus professionals. Institutional traders have access to data streams, proprietary tools, and execution platforms that the average trader can only dream of. They can monitor market sentiment, analyze volatility in real-time, and execute trades at lightning speed, often milliseconds faster than any retail investor.
These tools give professionals an enormous edge in identifying trends, hedging positions, and managing risk. Without them, individual traders are flying blind, trying to compete in an arena where the best information is reserved for the pros.
5. Volatility and Time Decay: The Ultimate Account Killers
Two of the most critical factors in options trading are volatility and time decay (known as theta). These are the silent killers of options accounts, and pros use them to their advantage.
Volatility: When volatility increases, option prices go up, which might sound great. However, volatility is unpredictable, and when it swings in the wrong direction, it can destroy your position’s value almost overnight. Professionals have sophisticated strategies to manage and hedge against volatility; most individual traders don’t.
Time Decay: Time is constantly working against you in options trading. Every day that passes, the value of an option slowly erodes, and as expiration approaches, this decay accelerates. For most retail traders, this is a ticking time bomb. Pros, on the other hand, know how to structure trades to profit from time decay, leaving amateurs at a disadvantage.
Conclusion: Trading Options Is No Easy Game
The challenges of options trading are real and significant. Between the advanced algorithms, the market makers’ advantages, the mathematical complexities of bid-ask spreads, and the tools and information reserved for professionals, the odds are stacked against you. Add to that the constant threat of volatility and time decay, and it’s clear that options trading is a difficult and often losing game for individual traders.
If you’re thinking about jumping into options trading, it’s crucial to understand the risks involved and recognize that the deck is stacked. To succeed, you need more than just a basic understanding—you need tools, strategy, and a deep awareness of how the pros operate. Without that, you're gambling, not trading.

AlgoTrading Basics for Beginners and Advanced StrategiesHello,
1 Introduction
Algotrading or Algorithmic trading has brought about a revolution in the financial markets: automation of trades with the help of complex algorithms. These algorithms execute trades according to predefined rules and are quicker in capturing market opportunities compared to manual trading. HFT in gold HFT-based algotrading has also greatly skewed the transaction volumes in recent years, but even though these trades are very short-term, they can tell us something about longer-term trading strategies.
---
2 What is Algorithmic Trading?
Algorithmic trading is a method of executing orders using automated, pre-designed trading instructions that account for variables such as trade timing, price, and volume. The platform has found application in the work of large financial institutions, hedge funds, and individual traders to facilitate the ease of trading strategy selection and optimization.
One might be, a set of rules that tells it to buy the gold if it falls below a certain level and sells as soon as the price of that gold hits a specified level. Traders can take advantage of small price movements without sitting in front of their screens all day.
---
3 Why use Algorithmic Trading?
There are various reasons as to why one would engage in Algotrading:
Speed: It is obvious that technology is used to carry out trades and computers do this faster than people. This proves extremely useful in fast markets like gold trading where prices may change in milliseconds.
Emotionless Trading: An individual does not deviate from the proposal; emotional elements like fear and greed that affect traders do not affect its operation.
Backtesting: Trading systems risk analyses can be done using test histories which access the performance of trading systems on historical figures, thus preventing any risk when trading.
Precision and Consistency: Algorithms maintain accuracy levels in trade initiation with almost never deteriorating without human intervention as only information is required regarding trading and no emotions.
---
4 Core Principles of Algorithmic Trading
Apart from trading in shares, forex or even taking a position in gold (XAUUSD) there are a few primary principles common to all algorithmic trading:
a Data Mining And Data Management
Technical Indicators – Besides backtesting and strategy optimization, algorithms employ very prominent technical indicators such as Moving Averages (MA), Relative Strength Index (RSI), Bollinger Bands, or other indicators associated with detecting trends or momentum.
Price Patterns – Other factors that might be of influence include pattern recognition algorithms which can be trained to identify specific shapes such as heads and shoulders, flags, or triangles, and thereby predicting price movements.
Volume Analysis – Volume analysis can be instrumental in price movement validation. Volumes increase during up-trend or down-trend and their analysis is essential when confirming trends or reversals.
b Machine Learning Models
Machine learning models aim to work in this way in modern algorithms with a view to predicting price changes in the near future. Algorithms that one develops or wires are fed with data sets and they learn patterns and devise methods of trading faster or more efficiently anyway as the case might be. There are other strategies like SVM, Random Forests, and Neural Networks that one can use to enhance predictive power.
c High-Frequency Trading
HFT involves placing numerous orders and getting them executed in split seconds and on some occasions microseconds. That is particularly attractive in cash markets like a gold market where there are narrow price bands in which one can place determinants and capitalize on the fluctuations.
---
5 Advanced Techniques in Gold (XAUUSD) Algorithmic Trading
Trading gold presents unique challenges and opportunities in the algorithmic trading world. Here are some advanced techniques tailored to the XAUUSD market:
Reinforcement learning has emerged as a powerful technique in gold trading. RL works as the trading systems interact with the market and improvise over the strategy by solving the problem by trying it in the market. This is useful for gold trading, as RL strategies are adaptable to external shocks such as economic news or investor sentiment changes.
They include sentiment predictions around precious metals.
Gold as an asset class has a unique character because it is a ‘safe-hoard’ asset and hence its price is subject to global and domestic conditions, military conflicts and general investor feel. Sentiment algorithms incorporate news, social networks, and reports on economics and stock markets to identify the mood of the investor's community. If there is a piece of news pointing to some uncertain or negative times ahead, then the algorithm predominantly directed by the sentiment may initiate purchases of gold.
---
6 The Future of Algorithmic Trading
Although this form of trading has not yet reached widespread use, the potential of quantum computing in investment strategies including gold markets is promising. Quantum calculations have been demonstrated to outperform classical computation in solving combinatorial optimization problems and processing big data. This can allow the development of new and better trading strategies and more effective utilization of unnecessary.
---
7 Practical Use of the Traders on Platforms like TradingView
With the inception of platforms like TradingView, algorithmic traders have been aided with a design, a test, and an automated strategy submission in the most reliant fashion.
a Algorithmic Strategies Implemented Using Pine Script
On its part, TradingView accepts user-written trading algorithms. Pine Script programming language is based on TradingView. These traders favor strategies resting on either technical indicators, patterns, or custom conditions. For instance, one can formulate a strategy to place a gold (XAUUSD) order whenever the price rises above its 50-day moving average and a closing order whenever the price goes down.
b Strategic Testing
Strategies (algorithms) are tested using back-testing methods incorporated in the trading software, this process is known as back-testing. A feature of the TradingView platform is that a trader can run their algorithms on record and see how those algorithms would have played out on historical data. This is important for adjusting the entry and exit plus the risk control parameters and further the performance of a strategy.
c Community Insights
Another benefit of using the TradingView platform is the community of traders around it who can post their strategies, exchange ideas, and learn from each other. You will be able to learn how other traders have taken to algorithmic trading with gold and other assets and be able to develop better strategies.
---
8 Tactics to Consider for New and Intermediate Trading Positions
The strategies provided for algorithmic trading may vary from simple to complex in levels. Below are some typical strategies that every trader should consider implementing in their trading practice:
a Trend Following
This is perhaps the most basic type of algorithmic trading. The idea is very simple; one buys those assets that are on the uptrend (bullish) and sells those that are on the downtrend (bearish). For example, in gold trades, a strategy for a trader may be quite simple: moving averages. For instance, an algorithm could be designed in such a way that it buys gold whenever the 20-day moving average of gold crosses the 50-day moving average upwards and sells when this situation is reversed.
b Arbitrage
Arbitrage strategies, as the very definition suggests, enable traders to exploit all such situations which emerge, due to the mispricing corrects routinely. In gold trading, for instance, this would refer to the action of selling short shares in an exchange retrieved in one exchange, where that price, would include a premium orchestrated by other markets.
c Mean Reversion
Mean reversion strategies originate from the classic concept that there is a high likelihood of prices returning to their average or mean. For instance, an algorithm buys an asset such as gold if its average is lower than the over its certain period moving average and sells whenever it is above that average.
d High-Frequency Trading (HFT)
HFT although it calls for many resources, there are traders who have this kind of approach to gold markets in that they seek to benefit from price changes within seconds or rather milliseconds HFT. This strategy also calls for other aspects such as having very good network connectivity to enable very fast execution of trades as well as high volume trades.
---
9 Conclusion
Algorithmic trading opens a world of opportunities for all kinds of traders. It doesn't matter whether you're a beginner looking into simple tactics such as trend-following or a seasoned trader putting more sophisticated approaches to work with gold (XAUUSD), there has never been a time that the tools and methods are more readily available to you for successful algotrading. Traders can use existing platforms such as our TradingView to develop, back & optimize their strategies to keep up with today’s fast-moving financial markets.
The financial world is evolving and staying up to date with these new breakthroughs in technology, including machine learning, sentiment analysis, and quantum computing will help give the traders the edge. Algorithmic trading can become everyone’s thing if one is patient, disciplined, and keeps learning.
Regards,
Ely

Harnessing the Power of Artificial Swarm Intelligence in TradingI) Introduction
Artificial swarm intelligence (ASI) has come in as the latest disruptor in trading and other industries in this world. This advanced technology, inspired by the sociobiology of social organisms like bees, birds, and fish, leads to the latest innovations and efficiencies found in the financial markets. Herein lies an informative overview of ASI, underscoring its principles and its utilities and advantages in trading.
II) What is Artificial Swarm Intelligence?
Artificial swarm intelligence makes one mimic the decision-making behavior of natural swarms. Swarms of bees, schools of fish, or flocks of birds in nature make group decisions that are often superior to those made by individuals in the same field. It exploits this relationship through algorithms and dynamic sharing of data to allow collaborative decision-making in artificial systems.
III) How Does ASI Work?
ASI has three basic components :
1) Agents: These are members of the swarm, often represented by single algorithms or software programs that take part, such as trading bots or software applications that analyze the market for many different data sources.
2) Communication Protocols: These protocols enable agents to relay information and together make decisions. Thus, good communication will enable all agents to receive the most current data and thus be aware of market trends.
3) Decision Rules: These are predetermined rules that guide agents regarding how to interpret data and make decisions. These rules usually imitate the simple behavioral rules present within the natural swarms-for example, either to align with neighboring swarming agents or to strive for consensus.
IV) Applications of ASI in Trading
1) Market Prediction: ASI systems can process enormous market datasets, recognize historical patterns, and analyze real-time news to make informed market predictions. By providing agents with a common perspective, this system is capable of forecasting stock prices, commodities, or any other financial instruments much more effectively compared with conventional techniques.
2) Risk Management: In trading, effective management of risk is a very important aspect. ASI facilitates the comprehensive examination of the volatility of the market and how individual investors behave to identify possible risks. In this way, the risk assessment will benefit from the wisdom of the crowds and its falling human error rate.
3) Algorithmic Trading: ASI controls technological trading as it is in constant evolution by the market and the traders. This evolution is beneficial in the aspect of lowering the costs of the trading algorithms concerning the costs of the transactions carried out.
4) Sentiment Analysis: ASI technologies monitor and examine the social networks, news, and traders’ discussions within trader communities to analyze these markets. Such up-to-date information avails the traders of the present atmosphere of the markets which is useful in making forecasts at the right time.
V) Merits of ASI in Trading
1) Increased accuracy: The inherent ASI decision-making characteristics increase the accuracy of market forecasts and trading decisions.
2) Greater efficiency: ASI digests material far more rapidly than older methodologies – enabling quicker actionable measures and therefore earning better trades by the traders.
3) Ongoing learning: ASI systems can learn and refresh their knowledge of the markets on an ongoing basis further increasing their adaptability.
4) Lower subjectivity: The incorporation of crowds helps to curb individual limitations and therefore results in a more objective analysis of the market that is devoid of personal bias.
VI) The Future of ASI
With the development of artificial swarm intelligence, its application in trading will surely diversify. More sophisticated agent communication systems will probably be necessary, faster information processing systems in real-time and systems with more capacity. All these will see the integration of ASI more into trading.
VII) In conclusion
Artificial swarm intelligence is a revolutionary method for making decisions in trading. The collective intelligence of the system allows traders to form better predictions accurately, increase their efficiency, and manage their risks. With future technological advancement, the role of ASI in trading will continuously see increased emphasis, leading the financial market into the future.
- Ely