Ascending channels trading applied to Gold current situation🔼 Ascending Channel – Explained Simply
An ascending channel is a bullish pattern — but not always a bullish ending.
It shows a market climbing step by step between two parallel rising lines:
the lower trendline (support) and the upper trendline (resistance).
🧠 Market Psychology
Buyers dominate, but sellers still show up at every swing high.
Each dip gets bought, keeping the trend alive —
until one side finally breaks the rhythm.
⚙️ How to Trade It
• Inside the channel:
Buy near the lower rail, take profit near the upper rail.
• Breakout play:
Go long on a confirmed close above resistance,
or short on a clean break below support.
• Stops:
Just outside the opposite rail — below support for longs, above resistance for shorts.
• Targets:
Use the channel height projected from the breakout point.
⚠️ What to Watch Out For
• False breakouts happen often.
• Too-steep channels usually fail faster.
• Volume must confirm — low volume = fake strength.
• Statistically, breakdowns occur slightly more often than breakouts.
________________________________________
Key takeaway:
An ascending channel isn’t a promise of a bull run —it’s a structured climb that eventually ends.
Trade the rhythm, not the hope. 🎯
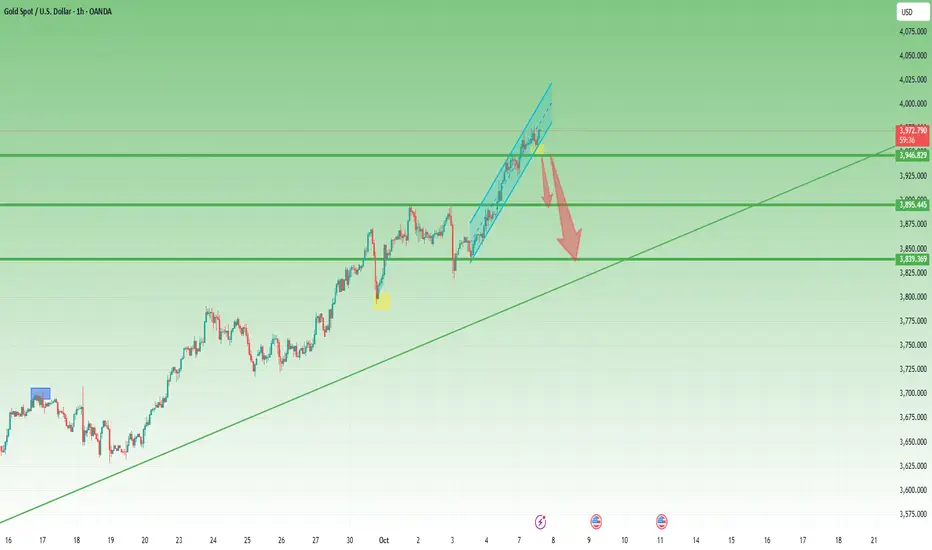
Statistically, in 57% of cases, up channels are broken to the downside
Gold now situation: the recent 1k pips is way-way-way to steep
Confirmation came with a drop under 3950 zone
Usually, in the case of such a steep channel, all the move is negated, so a drop to the 3850 zone.
However 3900 zone is strong support now, so a break under 3950 zone could lead to "only" a drop to this support.
Ascending Channel
How I Nailed a Perfect Breakout Trade Using a Simple Strategy*The following Analysis is made by my Trading BOT*
Analysis of Your Trade:
Descending Channel:
Formation and Breakout: The descending channel is well-defined, indicating a corrective phase following an impulsive move. The breakout above the channel suggests a potential reversal or continuation of the prior trend, which appears bullish.
Entry Timing: You entered the trade after the breakout from the descending channel. This entry aligns with a strategy to buy at the break of a corrective pattern, capitalizing on the resumption of bullish momentum.
Resistance Zone (Blue Area):
Initial Resistance Encounter: The blue horizontal line represents a resistance zone where price consolidated and failed to break higher on the first attempt. This is a good spot to watch for confirmation of a breakout or reversal.
False Breakouts: There are some upper wicks visible in this resistance zone, indicating possible false breakouts or liquidity grabs. This suggests that many traders might have been stopped out before the true breakout occurred.
Price Action Post-Breakout:
Sharp Move Down: After the breakout, price made a sharp move down to retest the previous resistance (now turned support), which aligns with the principles of market structure where old resistance becomes new support.
Correction and Continuation: The downward move appears corrective in nature, forming a series of lower highs and lower lows within a descending channel, after which the price breaks out and moves upwards sharply.
Risk and Reward Considerations:
Stop Placement: If your stop loss was placed below the previous swing low or the bottom of the descending channel, this would be a strategic placement to avoid being stopped out by market noise.
Take Profit: Your target seems to be well-placed, considering the previous highs or a key Fibonacci level. The green area likely represents the take-profit zone.
Volume Analysis:
Confirmation with Volume: The volume spike during the breakout from the descending channel and the subsequent move up indicates strong buying interest, which is a good confirmation signal.
Key Takeaways for Future Trades:
Pattern Recognition: Identifying descending channels and their breakouts is a strong skill that can be leveraged in various time frames.
Risk Management: Your trade shows a good understanding of risk management, especially if stops were placed beyond significant levels to avoid market noise.
Confirmation Signals: Waiting for volume confirmation during breakouts is an excellent strategy to avoid false moves.
Suggestions:
Multiple Time Frame Analysis: Ensure that your lower-time-frame trades are aligned with the higher-time-frame trends or setups to increase the probability of success.
Post-Trade Analysis: Continue reviewing your trades like this to refine your entry and exit strategies, especially around key zones like support and resistance.

XAU/USD Strategy: Pattern Recognition and Trade ExecutionComprehensive Market Breakdown for XAU/USD (Gold Spot) Based on Multi-Time Frame Analysis
Overview:
The analysis of XAU/USD across multiple time frames (15-minute, 30-minute, 1-hour, and 4-hour) indicates a complex market structure with both bullish and bearish signals. This detailed breakdown will provide insights into the current market conditions, key patterns to watch, potential trading strategies, and risk management considerations.
1. 15-Minute Time Frame: Symmetrical Triangle Pattern
Pattern Details:
Symmetrical Triangle: This pattern is characterized by converging trend lines connecting lower highs and higher lows, indicating indecision in the market.
Apex Proximity: The price is nearing the apex of the triangle, suggesting a potential breakout is imminent.
Implications:
Neutral Bias: The symmetrical triangle does not inherently suggest a bullish or bearish bias but indicates a potential breakout in either direction depending on market sentiment.
Volume Confirmation: A breakout with a significant surge in volume will confirm the direction of the move.
Trading Strategy:
Bullish Breakout: If the price breaks above the upper trendline with strong volume, consider entering long positions targeting previous resistance levels.
Bearish Breakout: Conversely, if the price breaks below the lower trendline with increased volume, consider short positions targeting previous support levels.
Stop-Loss Placement: Place stops just outside the opposite side of the breakout point to mitigate risks from false breakouts.
2. 30-Minute Time Frame: Mixed Channels (Descending and Ascending)
Patterns Observed:
Descending Channels: Suggest bearish continuation if in a downtrend or a potential reversal if broken to the upside.
Ascending Channels: Suggest bullish continuation if in an uptrend but signal a potential reversal if broken to the downside.
Market Implications:
Corrective Phase: The presence of both descending and ascending channels indicates the market is in a corrective phase, oscillating between support and resistance levels.
Range-Bound Trading: Until a significant breakout occurs, the market is likely to remain range-bound.
Trading Strategy:
Range Trading: Consider buying at the lower boundaries of the channels and selling at the upper boundaries.
Breakout Preparation: Prepare for a potential breakout by setting alerts around key levels (upper and lower boundaries of the channels).
Stop-Loss Placement: Place stops just outside the channels to protect against unexpected breakouts.
3. 1-Hour Time Frame: Rising Wedge Pattern
Pattern Details:
Rising Wedge: This pattern is characterized by higher highs and higher lows within a narrowing upward slope, typically a bearish reversal pattern.
Implications:
Bearish Reversal: The rising wedge suggests that upward momentum is weakening, and a potential breakdown could follow.
Reversal Zone: The price is near the upper boundary of the wedge, which may serve as a reversal zone, especially if a breakout to the downside occurs on high volume.
Trading Strategy:
Short Entry on Breakdown: Enter short positions if the price breaks below the lower trendline of the wedge with confirming volume.
Target Levels: Target the lower boundary of the larger ascending channel or previous support levels as take-profit points.
Stop-Loss Placement: Set stops above the most recent high within the wedge to protect against false breakouts.
4. 4-Hour Time Frame: Broader Rising Channel and Nested Patterns
Patterns Observed:
Broad Rising Channel: Indicates a larger uptrend is intact, providing a bullish bias.
Nested Descending Channels: Smaller corrective patterns within the broader uptrend suggest temporary pauses or consolidation phases before potential continuation moves.
Key Levels to Watch:
Resistance at 2,540: A break above this level would suggest a bullish continuation and potential for new highs.
Support at 2,470: A break below this level would indicate a significant shift in market sentiment towards bearishness.
Market Implications:
Potential Continuation or Reversal: The larger rising channel gives more weight to potential continuation moves, but the presence of smaller corrective patterns within suggests caution.
Echo Phase: The nested descending channel could represent an echo phase, a corrective move within the larger uptrend.
Trading Strategy:
Long Positions on Break Above 2,540: Enter long positions if the price breaks above this resistance level with confirming volume.
Short Positions on Break Below 2,470: Consider short positions if the price breaks below this support level with increased volume.
Volume Confirmation: Ensure any breakout is confirmed with a surge in volume to avoid false signals.
Risk Management: Use wider stops given the higher time frame context to avoid being stopped out by market noise.
5. Synthesis of Multi-Time Frame Analysis:
Confluence of Patterns: The alignment of rising wedges, symmetrical triangles, and mixed channels across multiple time frames suggests a market at a critical juncture. The presence of both bullish and bearish signals indicates that the market is poised for a decisive move.
Key Takeaways for Traders:
Patience and Discipline: Wait for confirmed breakouts with volume before entering trades. Do not rush into trades without sufficient confirmation.
Adaptability: Be prepared to adapt strategies based on the direction of the breakout or breakdown. Use alerts and monitor key levels closely.
Focus on Higher Time Frame Signals: Higher time frame signals carry more weight and should be given priority when making trading decisions.
Risk Management: Employ tight stops and carefully manage position sizes to limit exposure in case of adverse market movements.
6. Final Recommendations:
Potential Bullish Scenario:
Watch for a break above 2,540 on strong volume across multiple time frames. A confirmed breakout could lead to a bullish continuation towards new highs.
Potential Bearish Scenario:
Monitor for a breakdown below 2,470, especially if supported by a break of the rising wedge and descending channel patterns. A breakdown here would signal a shift to a bearish trend.
By combining these insights with real-time monitoring of market conditions, traders can enhance their decision-making process and capitalize on high-probability trade setups in the XAU/USD market.

Making and using Stacked Channels on log scale for targets 🧠 💱Alright, so here I will explain the idea of stacked channels on a logarithmic scale. First thing you need to do is go to logarithmic on your chart. You might want to reset the scale just for convenience so it looks nice and neat. Then you go to the channel and look, obviously we're going to start at the bottom. Okay. Now what you want to do is you find your channel here, right? Let's say this was the first one. You can go here as well. You can go here. It's whatever. I'll just go here to the beginning See how it lines up at the top. Okay, then I'll extend it And you were asking when does the price break out of the channel so here I'll mark it so you see This was a fake out. But here we have a legit legitimate breakout, right? So If I highlight this area right here, you know, you have the breakout of the channel, out of the channel. So what I do now is, I'm going to copy this channel, clone it. Ok, CTRL-C, CTRL-V, just slide it up, match the top of the old channel to the bottom of the new one. And you have a nice target here. See how it touched and stayed roughly around here? So that's all there is to it. And look, perfect here. You see? Confirmation. Confirmation again. Confirmation again. That's how you do it.

📈 HOW TO: ASCENDING TRIANGLE PATTERN📍 What Is an Ascending Triangle?
This pattern emerges when the price movement allows for a horizontal line to be drawn across the swing highs, while a rising trendline is drawn along the swing lows. These two lines together form a triangle shape. Traders actively monitor triangle patterns for potential breakouts, which can occur either upward or downward.
Ascending triangles are often referred to as continuation patterns because they typically result in a breakout in the same direction as the prevailing trend that was present before the triangle formation. This pattern offers traders a clear entry point, profit target, and stop-loss level, making it a tradable opportunity. It is worth noting that an ascending triangle can be distinguished from a descending triangle.
📍 How to Identify and Use the Ascending Triangle Candlestick pattern
To identify the ascending triangle pattern, you need to look for a period of price consolidation within an ongoing uptrend. During this phase, the price will exhibit a series of lower highs and higher lows, indicating a temporary balance between buyers and sellers. The upper resistance line of the pattern can be found by connecting at least two highs within the consolidation phase, while a rising trendline is drawn by connecting at least two higher lows.
Confirming the pattern involves ensuring that the price was in a clear uptrend before the consolidation phase, the upper resistance line is horizontal or slightly slanted upward, and the rising trendline intersects with the upper resistance line. Additionally, analyzing candlestick patterns within the consolidation phase, such as doji, hammer, or engulfing patterns, can provide further confirmation of buying pressure.
Once the ascending triangle pattern is confirmed, traders can set their entry and exit points. Typically, a long position is entered when the price breaks above the upper resistance line, indicating a bullish breakout. The height of the triangle pattern can be used to estimate a target price level, and a stop-loss order should be placed below the pattern to manage risk.
💥 Key Takeaways
🔹 Ascending triangles are considered a continuation pattern, as the price will typically break out of the triangle in the price direction prevailing before the triangle, although this won't always occur.
🔹 The trendlines of a triangle need to run along at least two swing highs and two swing lows.
🔹 A long trade is taken if the price breaks above the top of the pattern.
🔹 A short trade is taken if the price breaks below the lower trendline.
🔹 A profit target is calculated by taking the height of the triangle, at its thickest point, and adding or subtracting that to/from the breakout point.
🔹 A stop loss is typically placed just outside the pattern on the opposite side from the breakout.
👤 @QuantVue
📅 Daily Ideas about market update, psychology & indicators
❤️ If you appreciate our work, please like, comment and follow ❤️

💲Catch Profits in Channels💲Hello dear traders🙋🏻; I'm Pejman & this is the "How to get fish from channels" class. I guess you've heard, "Give a man a fish, and you feed him for a day🍣; teach a man to fish🎣, and you feed him for a lifetime."
Like every other educational post, today I will teach you how to fish and make money from the Market River🏞️.
As you know, fishing requires patience and practice, and you also have to take risks and throw bait into the water⛲. But today, together, we can use all kinds of price channels that are formed in this attractive river as a fishing net.🕸️
Our tool for fishing in the market river is technical analysis, which we discussed in previous posts. You can refer to this post and pick up your fishing rod.
You must have noticed that in the financial markets, the prices have their patterns and trends, which help us to catch the best fish🐠.
These patterns and specific price movements cause various trends in the market, which I explained in the market types post.
Another feature of specific price patterns and trends is the creation of price channels. Of course, don't get me wrong, I don't mean TV channels📺.
Although these channels are as attractive as sports channels and watching the Barcelona and Real Madrid games⚽🏟️, they have other features besides attractiveness✨.
They help you to predict the area of price movement even for the future. But please don't confuse channels with a magic 8-ball🎱. Based on past trends, they can give you a sense of where the price may be headed👀.
Trading without a price channel is like fishing without a net🕸️; you just guess.🤔 So, let's check the channels more closely and catch fish from them until the river is wavy.🌊
First, we need to know what the channel is.🤷🏻
Channels are like riverbanks that guide water flow, except, in this case, the channels guide the flow of candlesticks.🕯️
Price channels are made when the price is under the pressure of two ranges of supply and demand.
A channel is a trading range between two trend lines in which the price of an asset moves in almost predictable directions💁🏻. A price channel is like a trend line with a friend; two are always better than one, right?🧑🏻🤝🧑🏻
They also say: "The trend is your friend, but the price channel is your guide🙏🏻." By drawing the channels, you can find the possible price path🛣️, and at the right time, your hook will be stuck on sweet and big dollars💰.
Channels can be formed and used in any market with trending price changes, from stocks to forex and cryptocurrencies.
Channels, like many other tools in this market, have different types. Put down your fishing rods and put on your swimsuits🩲👙; we have to dive into the next topic.🏊🏻♀️
-------------------------------------------------------------------------------------------------------------------------------------------------------------------------------------------------------------------------------------
Dear students welcome to the types of channels class.🧑🏻🏫
The first lesson is ascending channels.⬆️
The ascending channel for the price is like a staircase to heaven!
An ascending channel is the same as an upward trend line, with the difference that in addition to the aligned valleys🌄, the peaks⛰️ are also aligned and are formed parallel to the valleys. Both the peaks and valleys will be predictable.💁🏻
Of course, you cannot be sure what the next price move will be, but you can predict many possibilities.👀
Now that we climbed the stairs and got acquainted with the ascending channel, it is time to get acquainted with the descending channel⬇️ and do some skiing⛷️. They say: In the deepest water is the best fishing. So let's swim deeper and get to know the descending channel.🤿
The descending channel is like a waterfall, pulling down everything in its path. Candles are no exception, and when they are in a descending channel, they slide like fish🐠 in a waterfall and go lower and lower.
Look for a series of Lower Highs(LH) and Lower Lows(LL) to identify descending channels.
The difference between ascending and descending channels is similar to climbing🧗🏻 and skiing⛷️; Descending channels push the price down and cause lower peaks and valleys.
If you were trading in one-sided markets and encountered a descending channel, my friend, just sell and run🏃🏻. But if you were in two-sided markets, you can enjoy taking short positions🔻 and fishing in this drop.🎣
The noteworthy point✨ is that the longer a channel is and the more times⏳ the price has hit any side of this channel, the more essential and reliable this channel becomes.✅
But what if the price is too tired to climb the stairs🔺😩 and not in a good mood to play on the slide🔻😒?
In this case, it will be stuck between two✌🏻 horizontal trend lines and form a range or sideway channel.
-------------------------------------------------------------------------------------------------------------------------------------------------------------------------------------------------------------------------------------
Range channels are just like ponds. There is no exceptional water flow🌊 in a pond, and fish and other creatures can only Move inside this pond. But range channels could be more attractive and eye-catching, like ponds.🌟
Range channels make traders tired.🙍🏻 Because trading in these channels will be more difficult than in other channels, it is challenging to recognize price movements or profit from small price movements in range channels.🤷🏻
The range channel is not similar to the ascending or descending channel. Because as its name suggests, it does not have a particular trend at all and is trendless.
When the price is in a channel range, the number of buyers🟢 and sellers🔴 is almost equal, and supply and demand are virtually identical.
🙅🏻Unlike ascending and descending channels, no peaks or valleys can be seen in a range channel higher or lower than its previous peaks or valleys.
Range channel is created by considering two trend lines from one peak to another peak and from one valley to another valley.
👌🏻Actually, the difference between a range channel and other channels is that these peaks and valleys are equal and basically in the same direction.
These channels may be permanent for river fishes🐟 and have become their home🏡, but there is no permanent channel or trend line for candles.😉
Remember that candles can leave their channel just like a bird🕊️ that jumps out of its cage or a prisoner escaping prison.🏃🏻
Do you remember in the previous posts when I talked about support and resistance lines, we said that candles could finally be released from their support or resistance prison? This case is the same.💁🏻✅
If you forget or don't know about support and resistance lines, take a breath and read this post before going to the next steps.👇🏻
The longer a channel is and the longer the price is locked in it🔒, the pressure of supply and demand on the price is more significant, and you will probably see a strong movement of the candles after the failure.💪🏻
But don't worry. You can still make money trading channels and even breakouts. In the following steps👣, I will teach you how to trade with all types of channels, as well as how to trade in breakouts.😉
-------------------------------------------------------------------------------------------------------------------------------------------------------------------------------------------------------------------------------------
Now you must have questions about how to draw channels.🤷🏻
Well, obviously, with a very sharp pencil✏️ and a steady hand✍🏻. Just kidding😅, you must first recognize the trend and look for regular price movements to draw channels.
To catch a good fish, you must patiently monitor the price movements and look for peaks and valleys that move in the same direction.🕵🏻
You will find your channel by connecting these peaks and the valleys to each other. You need at least two✌🏻 parallel peaks and two valleys to draw a channel.
But how do you know that a channel has been drawn correctly?🤔 Channels have conditions, my friend. I wrote these conditions, so pay attention when drawing the channel.😊
When you draw your channel, make sure that the upper and lower lines of the channel must be parallel.
If the two channel lines are not parallel and are angled, this is a sign of your terrible drawing🤦🏻♀️. What kind of school🏫 did you go to where you can't draw two parallel lines?😐
I'm kidding😄, but if this happens, the pattern is no longer a trend channel but a triangle, which I discussed in previous posts.
Channels and trend lines create patterns by forming different shapes, which I explained in the above post.
I said the lines should be parallel but don't take a ruler📏 to measure each channel and trend line. There is nothing quite like books, my friend.😉
According to the definitions, don't expect to always find a channel 100%. In that case, you will lag behind the whole market.🙅🏻
But there is a tool with the help of which you can draw your channels correctly and lower your error percentage. ✅You can find this expression from the toolbar beside your TradingView charts. Who doesn't like to cheat sometimes?
Look to the left of your charts and click on the second one from the top. New options are displayed; the fifth option from the bottom is the Parallel Channel.
Select this tool and look at your chart. Use this tool wherever you can draw a channel.
To draw ascending channels, you have to find two valleys with a peak between them and you can look for the second peak by drawing the parallel channel. And vice versa, to draw descending channels, you must look for two peaks with a valley between them.
If you found two valleys and there were no peaks between them, something must be wrong & you should reconsider to find the right points.
Finally, the task of the range channels is also straightforward🙂 When you start drawing, from peak to peak or valley to valley, the range channel will show itself, and it will not be different.😊
By default, parallel channels are also a middle line.👀
The middle line is like a negotiator between the other two lines. When the price moves from the upper band of a channel to the bottom, the middle line can mediate and supports the price.🟢
Or when the price moves from the lower band of a channel to the top, the middle line can prevent the price from moving further.🚫
Dear students🧑🏻🏫, now you have acquired the necessary skills, and it is time to take your sticks🪝 and come with me to the river.
Before you trade and catch fish yourself, pay attention🙏🏻 to the positions I took with the help of channels to gain skills in this field because a poor worker blames his tools.
There are ✌🏻two strategies for trading using channels, both of which I will teach you.
-------------------------------------------------------------------------------------------------------------------------------------------------------------------------------------------------------------------------------------
For example, in an ascending channel, such as trading with a support line, you can buy🟢 when the price is on the lower line of the channel and wait for it to reach the upper line of the channel and exit the positioning 🔚.
In previous articles, we talked about candlestick patterns. Using these patterns, you can get help to enter and exit your positions.
You can place your stop loss below the bottom line of the channel. You must indeed lose a fly to catch a trout.🎣 But always remember to be careful.😉
They say to invest what you can afford to lose. But remember to manage your Risk-Ratio and only trade after practicing and testing your strategies several times.✅
Indeed, even if the channel is downward🔻, you should only trade in the direction of the trend; as soon as the price reaches the upper line or resistance line, enter the position and take your profit💲 when you get the lower line of the channel.
Of course, if you are facing a range channel, your general strategy should be to buy at the bottom and sell at the top of the channel, and it's like eating a piece of cake.🍰👌🏻
-------------------------------------------------------------------------------------------------------------------------------------------------------------------------------------------------------------------------------------
When the price is stuck in a channel, is it like a prisoner who can't guess whether he will finally escape by digging a tunnel or climbing over the prison walls? It is impossible to know from which side the price will eventually break its channel.🤷🏻
It seems that channels usually break against the direction of their slope, but it is always possible for a channel to break on both sides.😉 If a channel is broken, the price usually starts a significant move in the same direction as the break.🏃🏻
Did I say that the more the price is locked in a channel, the stronger it will move?💪🏻 Usually, the price can move according to the width of its channel.
You can even use both strategies to trade channels.👌🏻 For example, if the price is locked in this channel, trade in the direction of the channel trend.
Breaking channels is like breaking trend lines or support & resistance, and it comes with a breakout candle🚩 and a confirmation candle✅.
After the breakout, if you have an open position in the trend direction of the channel, you should close it.🙅🏻
After seeing the confirmation✅ of the breakout, enter the position according to your trading strategy and follow the risk management points.
For example, I would have ✌🏻two entry points. And I place my stop loss slightly above the breakout candle🔴.
My first point of entry is after seeing the confirmation candle. And if the price returns🔁 to its channel for the last kiss💋, I activate my second entry point. This will reduce my Risk-Ratio, and I will have a safer position.
To know that your channels are ending🔚, you should look for signs of weakness in price movements; for example, in an ascending channel, breaking below the low trend line or failing to reach higher peaks are signs of weakness.
It's like the price is taking a break before going higher again.
The last thing I'd like to tell you is don't try to force a price on a channel when it doesn't exist. Remember, patience is vital, and it is better to lose a trade than accept a losing trade. As said: "Sometimes the best catches are found in still waters." 🎣
-------------------------------------------------------------------------------------------------------------------------------------------------------------------------------------------------------------------------------------
Conclusion :
Price channels are the rails that keep asset prices on track.🛤️ Just like fishing in a river, trading requires patience, skill, and an understanding of your environment. Check and avoid being affected by market fluctuations.🙅🏻
Now you can take your fishing rod🎣. Whether you are fishing in a bullish, bearish, or range market, the right approach and tools can help you make big profits.😉💲
Remember that profit and loss are together. Profits are never permanent and remember that a bad day at fishing is better than a good day at work. Am I right?😊
For you to have more good trading days than bad days, remember that it's okay to make mistakes when drawing🖌️ those price channels.
You can make up for all your mistakes by practicing and finding the right strategy. Warren Buffett says: The best investment you can make is your abilities.💪🏻
Feel free to experiment and try new strategies.✨ Don't be like a fish out of water; use the channels for swimming🏊🏻♀️ towards the market river.
Remember what Jesse Livermore said: "Price channels are like guardrails on the highway🚧 - they keep you from going off track and help you stay on track."
This post is over, but the road to the technical analysis journey is not over🧳✈️. In the following posts, I will accompany you step by step👣 and teach you other tools.
Be healthy🙏🏻, profitable💲, and successful!✌🏻
Ask your questions in the comments💬 and share your opinions with me😍.

How to understand the falling wedge and rising wedgeHello dear traders,
Here are some educational chart patterns you must know in 2022 and 2025.
I hope you find this information educational and informative.
We are new here so we ask you to support our views with your likes and comments,
Feel free to ask any questions in the comments, and we'll try to answer them all, folks.
What Is a Wedge?
A wedge is a price pattern marked by converging trend lines on a price chart. The two trend lines are drawn to connect the respective highs and lows of a price series over the course of 10 to 50 periods. The lines show that the highs and the lows are rising or falling at differing rates, giving the appearance of a wedge as the lines approach a convergence. Wedge-shaped trend lines are considered useful indicators of a potential reversal in price action by technical analysts.
Understanding the Wedge Pattern:-
A wedge pattern can signal either bullish or bearish price reversals. In either case, this pattern holds three common characteristics: first, the converging trend lines; second, a pattern of declining volume as the price progresses through the pattern; third, a breakout from one of the trend lines. The two forms of the wedge pattern are a rising wedge (which signals a bearish reversal) and a falling wedge (which signals a bullish reversal).
Falling Wedge pattern:-
When a security's price has been falling over time, a wedge pattern can occur just as the trend makes its final downward move. The trend lines drawn above the highs and below the lows on the price chart pattern can converge as the price slide loses momentum and buyers step in to slow the rate of decline. Before the lines converge, the price may breakout above the upper trend line.
When the price breaks the upper trend line, the security is expected to reverse and trend higher. Traders identifying bullish reversal signals would want to look for trades that benefit from the security’s rise in price.
Rising Wedge pattern:-
This usually occurs when the security's price has been rising over time, but it can also occur in the midst of a downtrend.
Trend lines drawn above and below a price chart pattern can converge to help a trader or analyst anticipate breakout reversals. While the price can break out of either trend line, the wedge pattern has a tendency to break out from the trend line in the opposite direction.
Therefore, the ascending wedge pattern indicates a higher probability of further downside in the price after the breakdown of the lower trend line. Traders can enter bearish trades on the basis of a charted security after a breakout, either by selling the security short or by using derivatives such as futures or options. These trades will seek to profit from the possibility of a fall in prices.
Trading Profits for the Wedge Pattern:-
As a general rule, price pattern strategies for trading systems rarely produce returns that outperform buy-and-hold strategies over time, but some patterns nevertheless appear to be useful in predicting general price trends. Huh. Some studies suggest that a wedge pattern will break out toward reversal (a bullish breakout for falling wedges and a bearish breakout for rising wedges) more than two-thirds of the time, with a falling wedge being followed by a rising wedge. Is a more reliable indicator than the wedge. ,
Because wedge patterns converge in a smaller price channel, the distance between the price at the entry of the trade and the price for the stop loss is relatively smaller than at the beginning of the pattern. This means that the stop loss can be placed closer to the time the trade is initiated, and if the trade is successful, can result in a return greater than the amount of risk initially placed on the trade.
Wedge a Continuation or a Reversal Pattern:-
The wedge pattern signals a reversal. The reversal is either bearish or bullish, depending on where the trend line meets, what the trading volume is, and whether the wedge is falling or rising.
Trade with care.
If you like our content, please feel free to support our page with a like, comment
Hit the like button if you like it and share your charts in the comments section.
Thank you

OTHER PATTERNSIn this video, We talk about other patterns like the Ascending channel, Descending Channel, and Divergence.
I hope this helps us in our journey
Cheers ♥🤟🏼💡

Chart Patterns | Triangles & ChannelsChart Patterns | Triangles & Channels
1- Ascending Triangle :-
An ascending triangle is a type of triangle chart pattern that occurs when there is a resistance level and a slope of higher lows.
2- Descending Triangle :-
In descending triangle chart pattern, there is a string of lower highs that forms the upper line. The lower line is a support level in which the price cannot seem to break.
3- Symmetrical Triangle :-
A symmetrical triangle is a chart formation where the slope of the price’s highs and the slope of the price’s lows converge together to a point where it looks like a triangle.
4- Parallel Channel :-
A Parallel Channel is a chart pattern formed when the price is bounded by parallel support and resistance levels.
5- Ascending Channel :-
An ascending channel is a chart pattern formed from two upward trend lines drawn above and below a price representing resistance and support levels.
6- Descending Channel :-
A descending channel is a chart pattern formed from two downward trendlines drawn above and below a price representing resistance and support levels.
Please like the idea for Support & Subscribe for More ideas like this and share your ideas and charts in Comments Section..!!
Thanks for Your Love & Support..!!

Bullish Shark Within Bullish ChannelFrom this chart, can be found that Bullish Shark Within Bullish Channel.
This one of example for Bullish Retracement Patterns within Bullish Trend Channels shown in Harmonic Trading: Volume Two, Page 124 until Page 126 written by Scott M Carney.
Bullish Harmonic Pattern in Bullish Channel or Ascending Channel may indicate continuation pattern in Channel or rather as confirmation to show that price will go up.
To simplify, M pattern within Ascending Channel indicates that price will go up in continuation.
Noted that Shark is Harmonic Pattern that use Reciprocal AB=CD.
You may refer Link to Related Ideas for more information.
Thank you.

Detail Look into Parallel Channel In Price Action Analysis
Hello everyone:
Let's take another detailed look into some parallel channels structures/patterns in price action analysis.
Recall my previous educational video on Ascending/descending channel correction, they are higher probability reversal price action structures/patterns.
Today I want to go over the horizontal parallel channel structures/patterns as well where they are more neutral,
more advanced to analyze and forecast the potential direction of the impulse phase following after.
Let's take a look into some of these horizontal parallel channel corrections, and break them down more.
In my opinion, the longer, deeper these types of parallel channels go, the stronger the next impulsive phase will be.
Although they can be tricky depending on whether they are continuation or reversal correction.
I will go over for examples in different markets to pinpoint some of these price action structures/patterns.
Below are some of the important topics that I mentioned in the video.
Reversal Ascending/Descending Channel
Risk Management: 3 different entries on how to enter the impulsive phrase of price action
Multi-time frame analysis
Identify a correction in price action analysis
Continuation and Reversal Correction
Any questions, comments, or feedback welcome to let me know thx :)
Jojo

ASCENDING CHANNELHere we have an example of an ASCENDIN CHANNEL.
Very good Risk To Reward (1:9 = 900+ pips).
DON'T LET AGAIN a trade opportunity like this ! ! !

USDJPY Selling Signal Patterns.Taking a look at the recent price action on USDJPY, we can see how the use of patterns and structure can be used to increase the probability for any potential trade setup.
As you can see from the 15 Minute chart, USDJPY was on the rise until it ran out of steam and started to trade into an ascending channel. This ascending channel completed a bearish (selling) 3 drive pattern at the highs which can indicate price exhaustion.
Once we saw this pattern complete and start to break down, we still don't look to enter the market until we locate a lower inner trend line to also break to the downside as this can help increase the strength of the pattern holding enough to extract pips from the market. Once the trend line breaks we can look to enter on the retest on the other side.
As we saw continued weakness in USD, we were given another opportunity to enter the market for a potential continuation play, this time in the form of a bearish head & shoulders pattern. Just like the 3 drive pattern we don't look to enter the head & shoulders until we see a lower inner trend line also break to the downside on the retest.
We would look to minimise our risk to the downside in both setups by placing a stop loss not to far above the 3rd drive high of the 3 drive pattern and just above the head of the head & shoulders pattern.

Possible 30% gain on this altcoinsHello Fellas, Today is a very interesting day when we see at the market . it is all because I saw a lot of buy signals from altcoins which could lead them into a huge bullish run in the next few days.
First of all, if we look at the 4 hours chart, we can easily find an ascending triangle has been formed which usually could lead the price to go up. Beside that, I've seen a possible 5th wave is going to be formed in near future.
Because I often see a truncated 5th wave which usually lead us to the double top pattern, I will be waiting for the break out confirmation of this 4 hours pattern. and enter long position from here.
My 1st target will be between 19700 - 20000 which act as previous swing high of current pattern. My highest target for mid term is around the 25000 which is 30% up from current price. However, between 20000 - 25000, I see a lot of significant resistance is ready to fight the price back, that's why I will give you a breakdown update for those resistance ahead.
Thank you.

