Structure trainingHello friends
Well, you see that a spike has been made by the sellers and a bearish structure has formed.
So, be careful that after each spike, the price needs to take a break, so it either suffers or pullbacks, spikes again, and continues.
Now the question is, how do we know when our downtrend is over?
You need to be careful and wait for the weakness of sellers and the strength of buyers, the important signs of which I will tell you.
The first sign is the last spike, which requires our bottom to be broken by sharp sellers and the price to be reversed by sharp buyers. Here it is important that we set a higher ceiling and break this spike formed by sellers, which is also called CHOCH in a correction, which means the same change in structure.
Our second sign is the lower lows, which is also very important and of great importance because it shows the advantage of buyers and helps a lot.
And in the price pullback we can enter the trade with risk and capital management.
Our stop loss is placed below the last low or the last spike that you said and the target is double that R/R=2
*The win rate of this strategy is also 60*
*Trade safely with us*
Choch

ChoCH: The Quiet Shift Most Traders Ignore“Most traders chase price. Few notice when price quietly turns around.”
Before a trend ends, before a breakout fails, before a setup forms —
There’s often a silent clue: Change of Character (ChoCH) .
What is ChoCH?
Change of Character marks the first structural sign that the market may be reversing — not continuing.
It’s a break in the internal rhythm of price, often happening after a liquidity sweep or inside a key zone.
In simpler terms:
BoS = Continuation
ChoCH = Potential Reversal
Most traders treat ChoCH like a green light to enter... but that’s a mistake.
ChoCH alone doesn’t mean a trend is ready to reverse.
It only tells you the current trend has paused or cracked — not ended.
What matters more is:
– Where the ChoCH happens
– Why it happens
– What came before it
This is where context matters.
How I Use ChoCH in My Trading Framework:
My approach is built around multi-timeframe structure:
✅ H4 – Bias
✅ M15 – Setup Alignment
✅ M1 – Sniper Entry
So when I see a ChoCH on M15 , I ask:
Does this align with my H4 bias ?
Has price entered a key zone or swept liquidity before the shift?
If yes — I start watching closely.
If no — it’s likely just noise.
ChoCH without narrative is just confusion.
BoS vs ChoCH – Know the Difference:
• BoS (Break of Structure) confirms trend continuation
• ChoCH (Change of Character) hints at a trend shift
• They look similar on a chart — but their implications are opposite
Mistake to avoid: Entering just because ChoCH appeared
Better approach: Let it warn you , not trap you
🪞 Final Thought:
ChoCH is not an entry. It’s an invitation.
A quiet shift the market offers only to those still enough to see it.
Some notice it.
Fewer understand it.
Even fewer know what to do after.
That’s the difference between recognizing a change… and trading it with conviction.
💬 If this spoke to you, share your thoughts below.
There’s more beneath the surface — tell me what direction you'd like to explore next.
Some of the most powerful methods I use aren’t shared openly — but those who’ve seen them know why.
You’ll know where to look if it’s meant for you.
📘 Shared by @ChartIsMirror
How to Trade Smart Money Concepts (SMC)\ How to Trade Smart Money Concepts (SMC)\
\ This article explores the foundation, key tools, and practical insights of Smart Money Concepts — and why it’s worth your attention.\
In today's fast-changing financial landscape, Smart Money Concepts (SMC) has become a popular strategy among modern traders. But what is SMC exactly, and how can it improve your trading decisions? This article breaks it down in a simple, professional way for traders at all levels.
---
\ What Are Smart Money Concepts?\
SMC is a trading approach based on the belief that large institutions ("smart money") like banks and hedge funds control most of the market's movements. These institutions often move the market in ways that confuse or trap retail traders. The goal of SMC is to understand and follow the footsteps of these big players.
Instead of relying on simple patterns or indicators, SMC focuses on:
\ - Market structure\
\ - Supply and demand zones\
\ - Liquidity pools\
By aligning your trades with the behavior of smart money, you can position yourself more strategically in the market.
---
\ Key SMC Concepts Explained\
\ Order Blocks\
Order blocks are zones on the chart where large institutions have placed significant buy or sell orders. These zones often lead to strong price reactions and act as hidden support or resistance levels. Order blocks are considered more precise than traditional supply and demand areas.
Example: ()
\ Fair Value Gap (FVG)\
A Fair Value Gap occurs when price moves sharply in one direction, leaving a gap or imbalance in the price action. These areas often get filled later and can act as magnets for price.
In a bearish move, the FVG is the gap between the low of the previous candle and the high of the next one. In a bullish move, it's the reverse.
Example: ()
\ Timeframe Consideration\
If you can’t monitor charts during the day, avoid relying on 5–30 minute setups. Consider 4H or daily timeframes for clearer signals and more manageable trading decisions.
\ Liquidity\
Liquidity refers to price zones where lots of pending orders exist. These are usually at obvious highs, lows, or trendlines. Smart money often targets these areas to trigger stop-losses and generate movement.
One common tool to identify liquidity is a "pivot point," which is a candle with a lower low or higher high than its neighbors.
Example: ()
\ Break of Structure (BOS)\
BOS occurs when price breaks above or below a previous high or low, signaling a possible trend continuation.
Example: ()
\ Change of Character (ChoCH)\
ChoCH happens when the market changes direction. For example, if price breaks a higher low in an uptrend, it may signal a reversal.
Example: ()
Combined with BOS: ()
---
\ How SMC Compares to Wyckoff\
The idea of "smart money" isn't new. Richard D. Wyckoff, a pioneer in technical analysis, laid the foundation for understanding market cycles driven by institutions. His price cycle theory includes four phases:
\ 1. Accumulation\
Smart money buys while the public is unaware.
\ 2. Markup\
Price rises as smart money pushes the market.
\ 3. Distribution\
Smart money sells into public buying.
\ 4. Markdown\
Price falls as the cycle completes.
SMC borrows from this logic but focuses more on structure and liquidity zones. Still, the core idea is the same: understand what big players are doing, and follow them.
\ For deeper insights into Wyckoff, explore additional resources focused on accumulation/distribution cycles.\
---
\ Summary\
Smart Money Concepts give traders a deeper look into market mechanics. By focusing on order blocks, fair value gaps, liquidity, and structure breaks, SMC helps identify high-probability trade setups based on institutional behavior.
It may seem complex at first, but once you understand the basics, SMC can become a powerful tool in your trading strategy. Whether you’re new or experienced, aligning with smart money can improve your edge in the market.

What Is a Change of Character (CHoCH) and How Can You Trade It?What Is a Change of Character (CHoCH) and How Can You Trade It?
Navigating the nuances of Smart Money Concept (SMC) trading requires a keen understanding of market signals like the Change of Character (CHoCH). This concept can help traders detect and react to potential trend reversals. Today, we’ll delve into the mechanics of CHoCHs, explaining how they manifest in different market conditions and how they can be strategically leveraged for trading decisions.
Understanding Breaks of Structure
Understanding Breaks of Structure (BOS) is essential for traders before delving into concepts like Change of Character (CHoCH). A BOS in trading signifies a continuation within the current trend and is marked by a clear deviation from established swing points that indicate previous highs and lows.
In the context of an uptrend, a BOS is identified when the price exceeds a previous high without moving below the most recent higher low. This action confirms that the upward momentum is still strong and likely to continue as buyers push the market to new heights.
Similarly, in a downtrend, a BOS occurs when prices drop below a previous low without breaking the prior lower high, suggesting that sellers remain in control and the downward trend is set to persist.
By recognising these points where the market extends beyond its former bounds, traders can confirm that the current trend is robust and act accordingly. This foundational concept of BOS not only helps in assessing trend strength but also sets the stage for understanding more complex patterns like CHoCH, where the focus shifts from trend continuation to potential trend reversals.
CHoCH Trading Meaning
In trading, a Change of Character (CHoCH) signals a potential shift in market dynamics, often indicating a reversal from the prevailing trend. This concept is particularly valuable as it helps traders discern when the momentum is shifting, offering a strategic point to consider adjusting their positions.
A CHoCH occurs when there's a noticeable deviation in the market's price trend. For example, in a bullish trend characterised by a series of higher highs and higher lows, a CHoCH is indicated by the price failing to set a new high and subsequently falling below a recent higher low. This suggests that buyers are losing control, and a bearish trend could be emerging.
Similarly, during a bearish trend marked by lower highs and lower lows, a bullish CHoCH would occur if the price unexpectedly breaks above a recent lower high. This break indicates that sellers are losing their grip, and a bullish trend may be starting.
The Significance of CHoCHs Across Timeframes
The fractal nature of financial markets means that patterns and behaviours recur across various timeframes, each providing unique insights and implications for trading. Understanding CHoCHs in different timeframes is crucial for traders to effectively align their strategies with both short-term opportunities and long-term trend shifts.
In intraday trading, where decisions are made on lower timeframes (like minutes or hours), a CHoCH can signal a possible short-term trend reversal. For example, if a currency pair in a downtrend on a 15-minute chart suddenly posts a higher high, this could indicate a weakening of the bearish momentum, suggesting a potential bullish reversal.
Traders might use this information to close short positions or to consider a long position, capitalising on the emerging upward trend. These short-term CHoCHs allow traders to respond quickly to market changes, potentially securing returns before larger market shifts occur.
Conversely, CHoCHs observed on higher timeframes, such as daily or weekly charts, are particularly significant because they can indicate a shift in the broader market trend that might last days, weeks, or even months. Such changes can then be used by both long and short-term traders to adjust their positioning and directional bias.
How to Identify a CHoCH
The initial step to identify a CHoCH in trading involves clearly defining the existing trend on a specific timeframe. This is done by marking the significant swing highs and lows that delineate the trend's progress. These points should represent somewhat meaningful retracements in the price, providing clear markers of trend continuity or potential reversal points.
According to the Smart Money Concept (SMC) theory, the integrity of an uptrend is maintained as long as the price does not trade through the most recent significant higher low. Conversely, a downtrend is considered intact if the price does not surpass the most recent significant lower high. Therefore, traders focus their attention on these critical points.
To identify a CHoCH, traders watch for a break in these crucial high or low points. For instance, in an uptrend, a bearish CHoCH is indicated when the price achieves a higher high but then reverses to descend below the previous significant higher low.
Similarly, in a downtrend, a bullish CHoCH occurs when the price drops to a lower low before reversing to break above the previous significant lower high, setting a new high. Both types of breaks signal a potential reversal in the trend direction.
How to Trade a CHoCH
When trading a CHoCH, it’s essential to recognise that it should be integrated with other aspects of the SMC framework to get the best results. This includes the use of order blocks and imbalances, which are key components in identifying potential reversals.
Order Blocks and Imbalances
An order block is essentially a substantial consolidation area where significant buying or selling has occurred, and prices often revisit these zones before reversing. These blocks can be seen as levels where institutional orders were previously concentrated.
An imbalance, also known as a fair value gap, occurs when the price moves sharply up or down, leaving a zone that has not been traded extensively. Price often returns to these gaps to 'fill' them, establishing equilibrium before a potential reversal happens.
In practice, traders can look for a sequence where the price first approaches an order block and begins to fill any existing imbalances. This setup increases confidence in a potential reversal. As the price meets these criteria and a CHoCH occurs, this indicates that the influence of the order block is likely to initiate a price reversal.
Practical Example on GBP/USD
Consider the 4-hour chart of the GBP/USD pair above. We see the pair encounter an order block on the left, one that’s visible on the daily chart. As the price interacts with this block, it begins to retrace, attempting to fill the imbalance but moves away. Eventually, the price completes the fill of the imbalance and meets the previously established order block.
Switching to a 1-hour timeframe, this scenario unfolds similarly. After reaching the order block on the 4-hour chart, another CHoCH occurs, signalling the start of a new uptrend. This lower timeframe CHoCH, following the meeting of the order block, corroborates the potential for a reversal initiated by the higher timeframe dynamics.
This example illustrates how CHoCHs can be effectively utilised across different timeframes, tying back to the fractal nature of markets discussed earlier. By recognising these patterns and understanding their interaction with order blocks and imbalances, traders can strategically position themselves to capitalise on potential market reversals, aligning their trades with deeper market forces at play.
CHoCH vs Market Structure Shift
A Market Structure Shift (MSS) is a specific type of Change of Character that includes additional signals suggesting a potential trend reversal. Unlike a straightforward CHoCH that typically indicates a trend is shifting but may also be a false break, an MSS can be seen as a higher confluence CHoCH. An MSS occurs after the market first makes a key movement contrary to the established trend—forming a lower high in an uptrend or a higher low in a downtrend—without plotting a higher high or lower low.
Following these preliminary signals, an MSS is confirmed when there is a decisive break through a significant swing point accompanied by a strong displacement (i.e. impulse) move, creating a CHoCH in the process. This sequence not only reflects that the prevailing trend has paused but also that a new trend in the opposite direction is establishing itself.
Due to these additional confirmations, an MSS can offer added confirmation for traders, indicating a stronger likelihood that a new, sustainable trend has begun. This makes the MSS particularly valuable for traders looking for more substantiated signals in their trading strategy.
The Bottom Line
The concept of a CHoCH is instrumental in navigating the complexities of SMC trading. By identifying these crucial market signals, traders may align their strategies to capitalise on market movements efficiently.
FAQs
What Is CHoCH in Trading?
In trading, CHoCH is a technical observation that signifies a change in the trend's character, where the price movement breaks from its established pattern of highs and lows, suggesting a potential reversal or substantial shift in the market's direction.
What Is CHoCH in SMC Trading?
In Smart Money Concept (SMC) trading, a Change of Character (CHoCH) refers to a clear shift in market behaviour that indicates a potential reversal of the prevailing trend. This concept is used by traders to detect early signs of a momentum shift that might lead to significant changes in price direction, enabling strategic adjustments to their trading positions.
What Is a CHoCH in the Market Structure?
A CHoCH in market structure is identified when there is an observable deviation from established price patterns — specifically when new highs or lows contradict the current trend. It signifies that the previous market sentiment is weakening, and a new opposite trend may be starting, prompting traders to reassess their strategies.
How Do You Identify a CHoCH?
Identifying a CHoCH involves monitoring significant swing highs and lows for breaks that are contrary to the existing trend. For instance, in an uptrend, a CHoCH would be indicated by a failure to reach a new high followed by a drop below the recent higher low, suggesting a shift to a bearish outlook.
What Is ChoCH vs BOS in Trading?
While both CHoCH and Break of Structure (BOS) are critical in assessing market dynamics, they serve different purposes. CHoCH indicates a potential trend reversal by highlighting a significant change in the price pattern. In contrast, a BOS indicates a continuation of the current trend by showing the price surpassing previous significant highs or lows, reinforcing the ongoing direction.
This article represents the opinion of the Companies operating under the FXOpen brand only. It is not to be construed as an offer, solicitation, or recommendation with respect to products and services provided by the Companies operating under the FXOpen brand, nor is it to be considered financial advice.

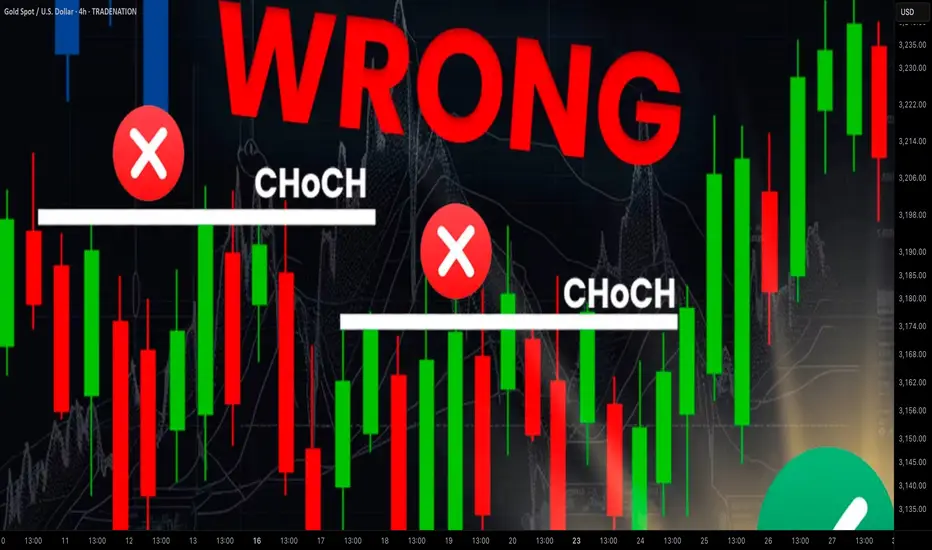
Learn Best Change of Character CHoCH Model in Trading with SMC
Most of the SMC traders get Change of Character CHoCH WRONG!
In this article, I will share with you Change of Character models that have a low accuracy and better to be avoided.
I will teach you the best CHoCH model for Forex Gold trading and show you how to identify it easily.
Let's start with the basic theory first and discuss what Change of Character signifies.
Change of Character in Bearish Trend
In a downtrend, Change of Character CHoCH is an important event that signifies a violation of a bearish trend.
CHoCH is confirmed when the price breaks and closes above the level of the last lower high.
Above, is a text book Change of Character model in a bearish trend.
For the newbie traders, such a price action provides a strong signal to buy while it fact it is NOT .
One crucial thing is missing in this model to confirm a bullish reversal.
According to basic trend analysis rules, we say that the market trend is bullish if the price forms a bullish impulse, retraces and sets a Higher Low HH , forms a new bullish impulse with a new Higher High HH.
Only then, we can say that the market is trading in up trend.
CHoCH model above confirms a bearish trend violation BUT it does not confirm a trend change.
Such a model may easily signify a deeper correction.
Look what happened with GBPNZD.
Though the price formed a confirmed bearish CHoCH, it was a false signal and just an extended correction.
That's a perfect bullish reversal model.
It combines CHoCH and conditions for a bullish trend.
Such a union is extremely accurate in predicting up movements.
Examine a price action on USDJPY.
Not only the price formed a confirmed CHoCH but also we see a start of a new bullish trend.
Change of Character in Bullish Trend
In an uptrend, Change of Character CHoCH is a significant event that signifies a violation of a bullish trend.
CHoCH is confirmed when the price breaks and closes below the level of the last higher low.
Above is a typical model of a bearish CHoCH.
For many traders, that is the signal to open short.
However, it is not that accurate and one important component is missing there.
According to basic price action rules, the market trend is bearish
if the price forms at least 2 bearish impulses with Lower Lows LL and a pullback between them with a Lower High LH.
Only when these 3 conditions are met, a bearish trend is confirmed .
Perfect bearish Change of Character model should include both CHoCH and a bearish trend price action. That will confirm a violation of a bullish trend and start of a new bearish trend.
EURCAD has a very strong potential to continue falling:
not only we see a valid bearish Change of Character but also
a start of a new bearish trend based on a price action.
Next time when you identify CHoCH on forex market, make sure that you check the preceding price action. It will help you to more accurate assess reversal probabilities and make a wiser trading decision.
❤️Please, support my work with like, thank you!❤️
I am part of Trade Nation's Influencer program and receive a monthly fee for using their TradingView charts in my analysis.
CHoCH (Change of Character) in Crypto TradingWhat is CHoCH?
CHoCH (Change of Character) is a concept from Smart Money Concept (SMC) used in technical analysis. It signals a shift in market behavior and often marks the beginning of a new trend phase, whether a trend reversal or consolidation.
Unlike Break of Structure (BoS), which confirms trend continuation, CHoCH indicates a potential change in direction.
---
How to Identify CHoCH?
1. In an Uptrend:
Price forms Higher Highs (HH) and Higher Lows (HL).
If the price breaks the last HL but fails to create a new HH, this is CHoCH, signaling a potential bearish reversal.
2. In a Downtrend:
Price forms Lower Lows (LL) and Lower Highs (LH).
If the price breaks the last LH but does not form a new LL, this is CHoCH, suggesting a bullish reversal.
---
How to Trade CHoCH?
CHoCH is a powerful tool for spotting trend weakness and entering trades early.
1. Spotting Trend Weakness:
In an uptrend, if the price fails to make a new HH and breaks the last HL, a trend shift might be occurring.
In a downtrend, if the price fails to form a new LL and breaks the last LH, expect bullish momentum.
2. Entry Strategies After CHoCH:
Wait for confirmation with a retest of the key level.
Use volume indicators to check if the breakout is significant.
Enter the trade after the retest of the broken support/resistance level.
3. Combining CHoCH with Other Tools:
CHoCH works well with Order Blocks, Liquidity Zones, and Fair Value Gaps (FVG).
Volume analysis helps confirm institutional activity in the trend change.
---
CHoCH Trading Example
Imagine an uptrend where price forms Higher Highs (HH) and Higher Lows (HL). Suddenly, the price fails to create a new HH and breaks the last HL. This is CHoCH, suggesting a potential shift from bullish to bearish.
💡 Traders can use this signal to exit long positions and prepare for short setups.

HOW TO TRADE CHOCH IN FOREX - SMART MONEY TRADERThe "Change of Character" (ChoCh) is a trading concept used to identify potential trend reversals in financial markets. It signifies a shift in market sentiment, such as from bullish to bearish or vice versa.
### Key Elements of ChoCh:
1. **Trend Breaks**: ChoCh occurs when a price trend fails to continue, such as not making a new lower low in a downtrend or a new higher high in an uptrend.
2. **Volume Spikes**: An unusual increase in trading volume accompanying a price movement can indicate a ChoCh.
3. **Candlestick Patterns**: Patterns like engulfing or doji candles can signal a shift in market sentiment.
### Trading Strategy:
1. **Identify Points of Interest (POIs)**: Use higher time frames to find significant levels like order blocks or support/resistance areas.
2. **Analyze Lower Time Frames**: Look for changes in trend around these POIs, using signs like price failing to break previous highs/lows.
3. **Entry Points**: Enter trades aggressively after a ChoCh is identified or conservatively after a return to the fair value gap created during the ChoCh.
4. **Stop-Loss and Take-Profit**: Set stop-loss orders just beyond reversal points and take-profit targets at next significant levels or using a fixed risk-reward ratio.
5. **Confirmation**: Use additional indicators like RSI or Moving Averages to confirm ChoCh signals.
ChoCh helps traders anticipate market reversals and make informed trading decisions across various markets, including forex, stocks, and cryptocurrencies.

CHOCH vs BOS ‼️WHAT IS BOS ?
BOS - break of strucuture. I will use market structure bullish or bearish to understand if the institutions are buying or selling a financial asset.
To spot a bullish / bearish market structure we should see a higher highs and higher lows and viceversa, to spot the continuation of the bullish market structure we should see bullish price action above the last old high in the structure this is the BOS.
BOS for me is a confirmation that price will go higher after the retracement and we are still in a bullish move
WHAT IS CHOCH?
CHOCH - change of character. Also known as reversal, when the price fails to make a new higher high or lower low, then the price broke the structure and continue in other direction.

Understanding Smart Money Concepts: CHoCH and BOS entriesIf you were a trader like me, that was having a hard time understanding Change of Character and Break of Structure concepts for a long time, I hope that this example gives you clarity to be able to identify entries better.
So let's begin!
The first thing you want to identify are high timeframe points of liquidity (AT, BELOW or NEAR) highs and lows.
In this example, we have identified a clear zone around 14800 and 14700 on the 4hr chart. Once price dips into that area, we take things down into the 1min timeframe to look for a structural SMC analysis.
This next chart shows you how to come up with specific structural points that will give you a better clue about a potential reversal (as in our case) or continuation. In this idea, we will specifically talk about reversals.
In any reversal near a point of interest, it is important for price to develop both a CHoCH, and BOS. The BOS is necessary so that price shows us a clear demand to continue the trend upward.
It is important to note, in the 1 min chart in my example, that once price has shown a CHoCH, price MUST come back to (or below) the price where the CHoCH broke out from, and create a new higher high (BOS).
Next, we wait for price to retrace at or below the CHoCH breakout, and RESPECT a liquidity point of entry (an FVG or an Order Block). Price must NOT confirm a CANDLE BODY below the lowest low on this retracement.
It is important to point out that there are occasions where the retracement from the high of the BOS actually comes all the way down to the low, breaks price with ONLY A WICK. This is to be understood as a grab of liquidity only, because a candle body did not confirm below the low.
From there, our entrance will either be at the high of a structure that was made WITHIN the BOS retracement, OR (like in our case there were not visible structures for entry) we can take a trade at the 50% premium discount zone, with our STOP at or a bit below the low the BOS made, target the high of our entire structure to the upside in the main chart.
I hope this tutorial helped some of you that have been struggling to understand smart money concept entries be able to have a better understanding of how and when to enter into trades at key reversal points of interest.
If you felt that this was useful, please drop a like on this idea.

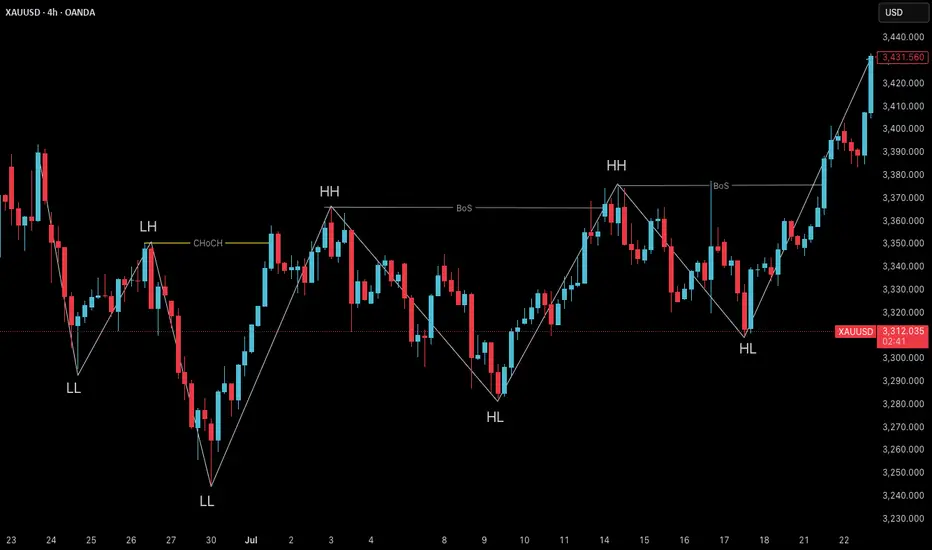
What’s CHOCH ?Whene price making LL (lower low) and lower High (LH) it’s down trend, whene price break last lower high (LH) and make new higher high (HH) and higher low (HL) trend changed and called change of character (CHOCH) and up trend

How to trade Smart Money Concepts:Smart Money Concepts is a more sophisticated way of trading price action, while taking advantage of where institutions are likely to place their orders. This makes Smart Money Concepts a usable tool whenever you are dealing with hedge funds. What you are about to read is an elaborate tutorial explaining a lot about this trading strategy, including some trading strategies (NOTE: there are many SMC indicators and the one I’ll be using is the one by LuxAlgo since I believe is the most “complete” out of all). Let's start.
1) Order Blocks:
Order Blocks are, in my opinion, the most important feature in SMC trading, as it shows where these institutions are likely to place their orders. In order for an order block to form, look at where the market is consolidating, creating an area of volume price is likely to be attracted to (some order blocks are formed due to imbalances in the market). In this image, you can see how order blocks are formed right after a ranging market has been broken. Because of this unique feature, order blocks are not the same as support/resistance zones.
In order for us to trade using order blocks, look for where an order block has been formed recently, as the longer an order block survives, the weaker it becomes. Buy when the candle that hit the order block closes and set your stop loss under that order block. In this example it worked since the volume wasn’t too high and the order block had formed a few candles before the retest. You can do this for shorts as well (NOTE: the more retests the order block gets, the weaker it becomes)
2) BOS & CHoCH:
Supports and resistances usually apply on Price Action, but they can be applied in Smart Money Concepts as well. The difference is that in Smart Money Concepts, you these supports and resistances when the price breaks through them. However, in many occasions these signals can be false and it’s only a retest of the support/resistance. In order to understand what BOS/CHoCH means, we need to look at the graph:
This is an example I made.
From the graph, a BOS or a Break of Structure is whenever the price breaks the most recent support/resistance in the direction of the trend direction(bullish/bearish). A CHoCH or a Change of Character is whenever the price breaks the most recent support/resistance in the direction opposite of the trend direction. What I mean by this is that in the example I have shown, the trend was bullish until it was not. Normally a bullish trend breaks the resistances instead of the supports, and vice-versa. This is why the name Break of Structure since the price continues going the direction it wants while solving any “issue” in its path. If this “issue” is big enough to break the support/resistance maintaining the trend intact, then it’s known as a Change of Character , since it changes the character of the trend. When this happens, there is a chance for a trend reversal to happen, which is the case for the example I’ve shown. Now I’ll show how to trade BOS/CHoCH in a real graph.
As you can see from the chart, there are a lot of Breakthroughs of Structure and Changes of Character, but this indicator actually shows which of these BOS/CHoCH are major. The trick is that if the indicator shows a BOS/CHoCH marked by a straight line instead of a bunch of lines, this means that it is more accurate. In this example, we ignore the smaller BOS/CHoCH and just look at the 2 important ones. We know they are important because they are marked by a straight line. You buy after the CHoCH/BOS label appears and when the candle that retested the broken resistance/new support closes and the volume doesn’t increase before that (unless the market is ranging after it broke). Same thing with shorts. You short after the BOS/CHoCH label appears when the candle that retested the broken support/new resistance and the volume doesn’t increase from the candle before that.
3) EQH/EQL:
In Price Action , there are chart patterns. One of the most known ones are the double top and the double bottom . Smart Money Concepts refers to these double tops/bottoms as Equal Highs and Equal Lows (EQH/EQL for short). Here’s an example:
As you can see, there is a double top (EQH) which came after an uptrend, meaning that there is a chance that the price will break the necklace (the support line made in the middle of the double tops), causing a change of character, which it did. Due to the nature of double tops and bottoms, this rarely happens. You should use this tool in confluence with other SMC tools like Order Blocks and BOS/CHoCH. Personally, I don’t use them much. I just use them to identify strong supports and resistances, as well as double tops and bottoms. They could also be used to identify trend reversals on major areas of support and resistance.
4) Premium and Discount zones:
Premium and Discount zones are ranges that form in the market when a recent major support and resistance has been established. In this example, you can see when did the premium and discount zones form. The price made a major support and resistance. The equilibrium zone is the 50% line in the Fibonacci Retracement tool if you pay close attention.
This means that price can react off of the Equilibrium zone, and if you pay close attention, you can see it was ranging for a while.
For a trading strategy, wait for the price to reach the Premium or Discount zones, and, if the market's volume decreases, enter a trade and set your take profit at the equilibrium zone. The reason why you should set your take profit at the equilibrium zone is because there is a chance the price rejects off of the equilibrium zone.
5) Fair Value Gaps:
Fair Value Gaps are imbalances that form in the market and can be good support/resistance areas. They usually form when the market is volatile and when a breakout or retest just happened.
In order to identify what a fair value gap is, look for a huge candle body like the one shown in the picture, then, draw a rectangle with its base being at the highest point of the previous candle's upper wick and with its top being the lowest point of the following candle's lower wick. Now, extend the rectangle to the right and now you have a fair value gap.
For a trading strategy, look for the line in the middle which is shown in the fair value gap. This line acts as a support, and the price can bounce off of it. For an entry point, wait for the price to react to the fair value gap, and, if the volume decreases while the reaction is happening, enter.
6) Liquidity Grabs:
Even if you think your trading strategy is amazing, you will always have to deal with scams. No matter how good your trading strategy is, all trading strategies fail to deal with hedge funds and whales. They sometimes act when the price is very close to a support or resistance, and when the people expect a bounce, they place their stop losses under the area of confluence. These hedge funds then act, and end up manipulating the market, forcing the people to panic buy or panic sell, depending on the area of confluence. One major example of market manipulation is in the Crypto Exchange. Trading Crypto is almost like gambling. Liquidity grabs perfectly reference the scam. You can spot them if, on a ranging market, there is a sudden increase or decrease in price. Always pay attention to traps like the ones in these examples shown below:
For a trading strategy, wait for the scam pump or dump to stagnate and then enter your trade in the opposite direction that the candle was going to.
In conclusion, Smart Money Concepts is a fascinating trading strategy for me, and it could be for you too. There are many aspects of it, and it is another way of trading Price Action, which itself is already fantastic.
This tutorial took me 3 hours to make, so please make sure to heart and comment your opinion on this. Thank you for reading through all of this.

📊 Market Structure: BOS VS CHOCH📊What is market structure?
Market structure is the levels that are created by the price of any currency as it moves up and down.
Price never moves in a single direction for too long. It always takes a few steps in one direction, then moves a few steps back, then a few more steps, then a few steps back.
Over time, these steps form distinct structures in the market: zones of consolidation, zones of support, zones of resistance, and zones where price impulses up and down.
Market structures that form in the past are often respected in the future, and analyzing previous market structure can form a basis for a trading plan.
BoS carries on in the same direction it was initially heading in where as a CHoCH can be viewed as the Markets turning point
🔷BOS - Break of structure forms in the direction of the trend creating continuation patterns.
Break of recent Lower Low when bearish or break of recent Higher High when bullish.
🔶CHOCH - Change of character form at the end of a trend. For example, if we see an uptrend in the market, characterized by higher highs and higher lows,
this means that the overall trend remains bullish. However, when a new high is formed and then impulsively broken to the downside,
this could signal that the bullish trend might be coming to an end, and that a possible choch transition may be happening.
👤 @algobuddy
📅 Daily Ideas about market update, psychology & indicators
❤️ If you appreciate our work, please like, comment and follow ❤️

10 Minutes Learn BOS & ChochBOS and Choch
Break Of Structure and Choch is next level of market structure.So, if you want to learn this, you need to learn market structure first
it will goes easy to find BOS and Choch when you understand or master at market structure
If you want to trend following, market structure is enough,but if you want to find reversal pattern, Choch and BOS is Usefull
What is BOS?
Break Of Structure forms in the direction of the trend creating continuation patterns for you to joint the trend
Break of recent Lower Low when bearish or Break of recent Higher High when bullish
Example:
What is Choch?
Change Of Character for at the end of a trend forming reversal patterns to give you a chance to join the new change of bias in the market.
will usually form a head and shoulders pattern also reverse head and shoulders when bearish
How to indicate, you need to find the last Lower High ( when bearish ) and Higher Low ( when bullish ).so,when the price close above
the last Lower High or Lower Low, this pattern has formed
Below, is step by step how to using Choch
1. Determine the market structure first
2. Determine the BOS correctly
3. Determine the Choch, i change the color to green because
of bullish trend require break of Choch
Note : be careful, this part is often wrong! you should watch the last BOS
to determine the Choch
4. Look! We got it
Note : The higher timeframe close above the choch,then the confirmation is getting stronger
Easy to learn ya, thanks for reading my page!
Hope it usefull!

Key to unlock the true market structure!!!Have you been struggling with marking market structure? You may have come across many Youtubers who aim to teach the market structure, but in a very wrong manner either by taking fibonacci tool or by discretion. This Video can be an eye opener for you all who are struggling in marking valid market structure.
Market structure is the backbone for every other SMC concepts. Without market structure there will be no orderblocks, breakers etc. Even if you are a beginner in market structure, that is much better since you won't be acquiring the wrong knowledge in the 1st hand.
So are you ready to uncover the real mechanical market structure?
Video will be uploaded on YT at 6:30AM GMT on 25th November 2022
Subscribe our YT channel to never miss any content from Lamda Trading.
Happy Trading!!!
-Team Lamda

CHOCH vs BOS ‼️WHAT IS BOS ?
BOS - break of strucuture. I will use market structure bullish or bearish to understand if the institutions are buying or selling a financial asset.
To spot a bullish / bearish market structure we should see a higher highs and higher lows and viceversa, to spot the continuation of the bullish market structure we should see bullish price action above the last old high in the structure this is the BOS.
BOS for me is a confirmation that price will go higher after the retracement and we are still in a bullish move
WHAT IS CHOCH?
CHOCH - change of character. Also known as reversal, when the price fails to make a new higher high or lower low, then the price broke the structure and continue in other direction.

What is CHOCH? Check out the Example below.When the price changes its direction from making LH and LL to HH and HL is called CHOCH(Change of character or change of structure). Please hit like👍 and follow. Thanks.

🤓 🤓 MARKET STRUCTURE SHIFT! SMCMarket structure in Forex trading or price action is how many people take advantage of the markets. No indicators, and no volume. Because the market does not have a centralised exchange. Forex traders often swing trade the market based on the structure to take advantage of the opportunity.
Structural market change is broadly defined as a shift or change in the way in which a market or economy functions or operates.
I have tried my best to show you in the easiest possible way to look out for. Save this to your notes for future reference.

CHOCH vs BOS ‼️WHAT IS BOS ?
BOS - break of strucuture. I will use market structure bullish or bearish to understand if the institutions are buying or selling a financial asset.
To spot a bullish / bearish market structure we should see a higher highs and higher lows and viceversa, to spot the continuation of the bullish market structure we should see bullish price action above the last old high in the structure this is the BOS.
BOS for me is a confirmation that price will go higher after the retracement and we are still in a bullish move
WHAT IS CHOCH?
CHOCH - change of character. Also known as reversal, when the price fails to make a new higher high or lower low, then the price broke the structure and continue in other direction.

Differences in Philip & CHoCH Scenarios
When an area is immediately broken we will have ( CHoCH ) . When an area on the opposite side is consumed and the price returns, we expect the area that caused the failure to be consumed at the time trigger.
When an area reacts but cannot break the surface, we have ( FILIP ) . When the price breaks the opposite areas and consumes one and returns, we expect in the time trigger to consume the area that caused the failure.
Continued ENTER
Two modes occur.
We either lost the Filip or ( CHoCH ) scenario and are waiting for it to return.
Or a high time zone is broken by a lower time trigger where we expect orders to continue flowing.
