Gold Forex Trading During Major Economic Events & News Releases
I guess you already noticed how impulsively the markets may react to economic events and news.
In this article, I will teach you a simple strategy to follow during important news release s and how to trade news.
1. Sort out the economic calendar
There are a lot of news in the economic calendar.
They are not equal in their impact.
Most of the economic calendars indicate the potential significance of each event: while some news have low importance, some have medium importance and some are considered to be extremely important.
For example, above is the list of coming UK fundamental news.
You can see that these news have different degree of importance.
My recommendation to you is to sort out the economic calendar in a way, so it would display only the most important news.
Among the news that we discussed above, only one release has high importance.
2. Know on what trading instruments does the news have an effect
While some of the news in the economic calendar may impact many financial markets and trading instruments, some news may affect very particular instruments.
For example, a FED Interest Rate decision may have a very broad effect on financial markets.
At the same time, Interest Rate Decision in Australia may affect only Australia - related instruments.
3. Don't trade one hour before the news and one hour after the release
Once you see the important fundamental news coming, don't trade the trading instruments that can be affected by the new s 1 hour before and after the release.
For example, in 5 minutes we are expecting important UK news - CPI data.
I stopped trading GBP pairs 1 hour before the release of the news, and will resume trading them one hour after the release.
4. Protect your trading positions 5 minutes ahead of the news
If you have an active trading position and related important news are expected, move your stop loss to entry 5 minutes ahead of the release of the news.
For example, I have a short trade on GBPAUD. I see that in 5 minutes important UK data is coming. I will move stop loss to entry 5 minutes ahead of the news and make a position risk-free.
I always say to my students, that news trading is very complicated. Due to a high volatility, it is very hard to make wise decision during the news releases.
The approach that I suggest will help you to avoid all that and trade the markets when they are calm.
❤️Please, support my work with like, thank you!❤️
I am part of Trade Nation's Influencer program and receive a monthly fee for using their TradingView charts in my analysis.
Fundamental-analysis

How to Build a Consistent Execution Checklist on TradingViewMost trading mistakes don’t come from bad strategy, they come from inconsistent execution.
An execution checklist removes guesswork and replaces it with structure.
When your actions follow a routine, your results stabilize.
TradingView gives you everything you need to build a checklist that stays visible, actionable, and tied directly to your chart.
1. Define Your Core Conditions
Before any trade, the bigger picture must be clear.
Start your checklist by answering three questions:
What is the higher-timeframe direction
Where is price relative to key levels
Is price approaching with strength or weakness
Use TradingView’s drawing tools to mark support, resistance, value zones, and session highs and lows.
Add a simple text note on the chart listing your core conditions so they are always visible.
If the market context fails this first screen, the trade is already invalid.
2. Build Confirmation Criteria
Once structure is confirmed, you move to evidence.
Mark confirmation areas directly on your chart:
Liquidity pools
Fair value zones or imbalances
Previous session highs and lows
Asian range or New York open
If your strategy uses indicators, document exact conditions:
Moving average position and slope
Volume behavior
VWAP location
Volatility expansion or contraction
Define rules that don’t change based on emotion.
Confirmation should prove your bias, not justify your urge to trade.
3. Validate Risk Before Execution
Every setup must survive a risk checkpoint before it’s allowed to go live.
Your checklist must answer:
Where is my invalidation level
How much capital am I risking
Does this violate any daily limits
Is the reward worth the risk
Use TradingView’s long or short position tool to visualize risk directly on the chart.
Save it as a template so your risk process stays uniform across all trades.
No trade is valid if risk isn’t clean.
4. Create a Pre-Execution Routine
A checklist only works if you actually follow it.
Add a short pre-trade process directly to your chart notes using checkboxes or bullet points:
Example execution checklist:
Market phase confirmed
Level identified
Confirmation present
Risk valid
Entry condition active
Walk through this list before clicking buy or sell.
If one item fails, the trade fails.
Over time, this routine removes emotional impulse completely.
5. Review and Refine Weekly
Your checklist isn’t static, it evolves.
Every week ask:
Where did I break my rules
What conditions led to losses
Which confirmations work best
What rules saved me from bad trades
Use TradingView’s trade replay and journaling features to review execution quality, not just profit.
Consistency improves when your system evolves with you.
Final Thought
A checklist doesn’t restrict your trading, it frees you from emotion.
When your process is clear, your confidence increases.
When your confidence increases, discipline follows.
Good traders make decisions.
Great traders execute procedures.
Stay Green!
Risk Management for Automated SystemsAutomation gives you speed, consistency, and emotionless execution, but it also has a dark side.
A bot can follow rules perfectly, but if the rules are risky, it will amplify the danger with mechanical precision.
That’s why risk management is the backbone of every successful automated strategy.
It doesn’t matter how good your code is — without proper risk control, even the smartest system can fail fast.
Below are five core pillars of risk management that every trader should build into their automation framework.
1. Know Your Maximum Drawdown
Every trading system, even the best one, goes through losing streaks.
What matters isn’t avoiding them, but controlling how deep they cut.
Setting a maximum drawdown limit defines the exact point where your bot pauses or shuts down.
Whether it’s 5%, 10%, or 20%, this boundary protects your capital and your mindset.
Why it matters:
Prevents “death spirals” during high volatility
Stops the system if market conditions change
Forces you to step back and evaluate logic
Protects the account from black swan trends
A bot that can’t stop itself, is a bot that will eventually blow up.
A bot that knows when to stop, survives.
2. Position Sizing Is Everything
You can have the best entry logic in the world, but if your position sizes are inconsistent or too large, the system becomes unstable.
Smart position sizing adapts to:
Account balance
Market volatility
Asset liquidity
A fixed-percentage model, such as risking 1–2% per trade, keeps performance steady even during rough periods.
It also allows your system to grow naturally without taking oversized risks.
Think of sizing as the volume knob of your bot — turn it too high, and you distort everything.
3. Avoid Correlated Exposure
Running several bots doesn’t automatically mean you are diversified.
Many traders make the mistake of running multiple strategies that all rely on the same market behavior.
For example:
Three momentum bots on BTC, ETH, and SOL are still highly correlated
Two trend systems may fail at the same time if the market suddenly ranges
Several “dip-buying” strategies will all get hit hard during a crash
True diversification means mixing:
Uncorrelated assets
Different signal types
Varying timeframes
Both trend and mean-reversion logic
The goal is for your bots to perform differently, not identically.
4. Review Your System’s Risk Profile
Markets change, and so should your risk model.
Volatility increases and decreases, spreads widen, volume dries up, and certain assets become more unpredictable.
Regular reviews ensure your system stays aligned with real conditions.
What to check:
Has drawdown increased over the last quarter?
Are trades becoming larger than planned due to volatility shifts?
Has your system entered a new market phase it wasn’t designed for?
Are win rates or profit factor weakening?
A quarterly or monthly audit reveals issues before they explode.
Risk management isn’t a one-time setup — it’s a continuous process.
A strategy tester can be very good tool to help you manage risk properly and evaluate risk.
Here is an example from one of our strategies.
5. Let Risk Management Be Automated Too
If your entries are automated but your risk controls aren’t, you’re only half-protected.
Risk management logic you can automate:
Stop-loss placement
Progressive stop tightening
Position scaling
Reducing size after a losing streak
Pausing after reaching a daily or weekly limit
Complete shutdown at max drawdown
This turns your bot into a self-regulating system that responds to both opportunity and danger.
The more risk rules you automate, the less emotional interference you’ll face — and the more consistent your results become.
Building a Trading System: From Idea to ExecutionEvery trader starts with an idea — a setup, a pattern, a theory that seems to work.
But until that idea becomes a structured system, it’s just intuition.
A trading system gives your ideas rules, logic, and repeatability.
That’s the difference between a trader who hopes, and a trader who executes.
Define the Core Idea
Every system begins with an observation.
Maybe you notice breakouts after volume spikes, or reversals after RSI divergence.
Whatever the logic, write it down.
A system has to be specific, if you can’t define it clearly, you can’t test it.
Set Your Entry and Exit Rules
Your system should answer three things precisely:
When to enter a trade
When to exit a trade
How much to risk
Ambiguity is the enemy.
Rules make your strategy repeatable, testable, and objective.
Backtest the Logic
Before going live, test your rules on past data.
You’re not looking for perfection, you’re looking for consistency.
If your logic survives bull, bear, and sideways markets, it’s valid.
Track win rate, drawdown, and profit factor — they’ll tell you what’s working.
Execute With Discipline
A system only works if you do.
Follow the rules exactly as tested, even when it feels uncomfortable.
Consistency turns probability into profit — emotions destroy both.
Application
Here we have a very good example from our trading signals where we executed one of our strategies for 10 days. The strategy was designed with detailed inputs, logic and executed with a precise setup in a trading bot.
Refine and Evolve
Once live, keep notes.
Track how the system performs under real conditions.
Make small, measured improvements based on data, not emotion.
A system should evolve, not change its identity.
Redefining and tuning is a part of the process, there is no strategy that lasts forever, everything needs to evolve and adjust!
Backtesting 101: How to Turn an Idea Into a Tested StrategyEvery trader has thought it:
“If I’d just followed that setup every time, I’d be up big.”
That’s where backtesting steps in, it separates luck from logic.
It’s how you find out whether your strategy has a real edge, or just worked in hindsight.
Most traders skip it, not because it’s useless, but because it forces them to face the truth.
But if you can handle that truth, backtesting will make you a far more confident trader.
What Backtesting Really Is
Backtesting means applying your trading rules to historical data to see how your system would have performed.
It’s not about predicting the future, it’s about proving whether your idea works in different market conditions.
When done properly, it gives you three key insights:
Profitability: does your edge actually exist?
Risk: how deep are the drawdowns, and can you handle them?
Consistency: does it work across bull, bear, and sideways markets?
A solid backtest gives you confidence, not because it guarantees profit, but because it exposes weakness before the market does.
The Most Common Mistakes
Curve-fitting: tweaking rules until the past looks perfect.
Ignoring fees and slippage: small costs that quietly erase profits.
Testing too little data: short periods create false confidence.
Focusing on one market: edges must survive different conditions.
If your backtest looks too clean, it’s probably lying to you.
Why It Matters
Backtesting builds trust in your system and discipline in yourself.
When you know your data, you stop second-guessing every trade.
Losing trades stop feeling like failure, because you understand they’re part of a proven edge.
Even bots rely on backtesting. Without it, automation is just random execution.
With it, every trade follows structure, not emotion.
All of these points make a difference between a winning or losing strategy.
From Idea to System
Every strategy starts as a hypothesis.
Backtesting turns that hypothesis into data.
Data turns into structure.
Structure turns into consistency.
That’s the real path to professional trading - logic first, emotion second.

Trading Bots: The Future of the Markets?Let’s be real, the idea of a trading bot sounds like the holy grail.
Set it up, go to bed, and wake up to profit.
If only it were that simple.
Most bots don’t fail because of bad code, they fail because of bad logic.
A bot is only as good as the rules you give it.
What a Trading Bot Actually Does
A bot doesn’t predict the market, it reacts to it.
It follows a defined strategy:
Buy when X happens, sell when Y is confirmed, cut losses if price breaks Z.
That’s all.
No fear. No greed. No “maybe I’ll wait for one more candle.”
The power of bots isn’t in magic,it’s in consistency.
They do what most traders can’t: follow the plan exactly as written, every single time.
Why Most Bots Fail
The truth?
Most traders plug in random bots they find online without understanding what’s inside.
They win a few trades, feel invincible… and then lose it all when volatility spikes.
The reason isn’t the bot, it’s the lack of testing and understanding.
If you don’t know your system’s weak spots, you’ll eventually find them the hard way.
That’s why backtesting matters.
Backtesting: Your First Line of Defense
Backtesting shows how your logic performs over hundreds of trades — across bull, bear, and sideways markets.
It reveals your system’s strengths, weaknesses, and drawdowns before you risk a dollar.
A good backtest should tell you:
Your average win rate and risk/reward ratio.
How your system handles volatility.
How often it hits consecutive losses.
Whether your edge actually holds over time.
If your bot looks good in backtests and performs similarly in live conditions — you’re onto something real.
*Example of one of our indicator
How Bots Can Enhance Your Trading
You don’t have to hand everything over to automation.
In fact, many great traders use bots to handle the mechanical side, while keeping the decision-making human.
Here are a few examples:
Trade Execution: Let the bot enter trades instantly after your setup triggers.
Risk Management: Bots can move stop-losses, take partial profits, or scale positions automatically.
Signal Filtering: Use automation to scan hundreds of pairs and alert you only when conditions align.
Backtesting Sandbox: Test new ideas safely with data before deploying them live.
Bots don’t replace traders, they multiply efficiency.
They free your mind from execution so you can focus on refinement.
The Real Lesson
A trading bot isn’t a shortcut.
It’s a mirror, it reflects your discipline, your rules, and your logic.
If your plan is solid, a bot will make it unstoppable.
If your plan is weak, it’ll just lose money faster.
Automation doesn’t fix bad habits, it exposes them.
So learn the logic, test it hard, then let the system do what humans struggle with most: follow the plan.

Indicators and Trading Signals — How It WorksWhen you first start trading, indicators feel like the secret sauce.
RSI, MACD, EMA, Volume every line promises to reveal what the market will do next.
You start stacking them like LEGO blocks, thinking more confirmation = more accuracy.
But here’s the hard truth: indicators don’t predict they react.
The real skill isn’t using more of them, it’s knowing when to listen and when to ignore.
The Role of Indicators
Indicators are tools, not magic formulas.
They exist to translate price action into structure. That’s it.
RSI tells you about momentum.
Volume shows commitment.
Moving averages reveal trend direction.
Volatility indicators show risk zones.
The power isn’t in the tool itself, it’s in how consistently you interpret it.
That’s why two traders can look at the same RSI line and do completely opposite things.
The Trap: Signal Hunting
Every trader falls into this phase: jumping from one setup to another, waiting for that “perfect signal.”
The problem?
There isn’t one.
Even the best indicators will fail if your execution and mindset aren’t aligned.
Signals don’t make money! Systems do.
Systems combine momentum, volume, volatility, and trend logic, so signals confirm each other, not contradict.
Signal vs Execution
Let’s be real, getting a signal is the easy part.
Following it correctly is where most traders fall apart.
You get a buy signal… but wait for “one more candle.”
You see a sell alert… but hold, just in case it bounces.
You close early because “it already moved enough.”
That’s why automation matters.
It doesn’t second-guess, it executes.
From Noise to System
If your screen looks like a Christmas tree of indicators, you’re not trading, you’re guessing.
Clean it up.
Pick a few tools that complement each other, build rules around them, and stick to those rules.
That’s how professionals think: less emotion, more structure.
2008 Crisis and How the Banking System Has Changed Since:
⚠️These headlines serve as a reminder that despite the Basel I, II, and III global banking regulations, we have not been spared from systemic risks originating within the financial system itself
🏦After the 2008 crisis, banks became heavily overregulated. As a result, many of their most lucrative investment and financing activities shifted into affiliated offshore hedge funds — entities that remain very much part of the same global financial machinery. They are simply no longer called “banks,” and therefore escape almost all regulation.
💵These hedge funds lend, repackage loans, buy and sell exotic financial instruments, re-hypothecate, and re-collateralize. They use questionable collateral to issue risky loans , which are then resold, repackaged, and used again as collateral again.
💰 Exotic derivatives, curreny swaps, REPO operations, outright fraud,risky options market-making, — you name it — all thrive offshore , far from regulatory oversight yet just a click away for clients. And make no mistake: these so-called “non-banks” are deeply interconnected with the global financial system. If they fail, the shockwaves will be felt everywhere.
📈 The next financial tsunami will begin offshore — but it’s the onshore world that will be hit the hardest . So don’t keep large sums of money in the bank, guys. Once your funds are in the bank, they’re no longer truly yours — they belong to the bank. Your account can be frozen, blocked, seized, taxed, or even converted into shares (as happened in Spain in 2011).
⚠️And remember: banks can fail. They will fail. And when they do — the government won’t save you.
Yours truly,
Greg🌹

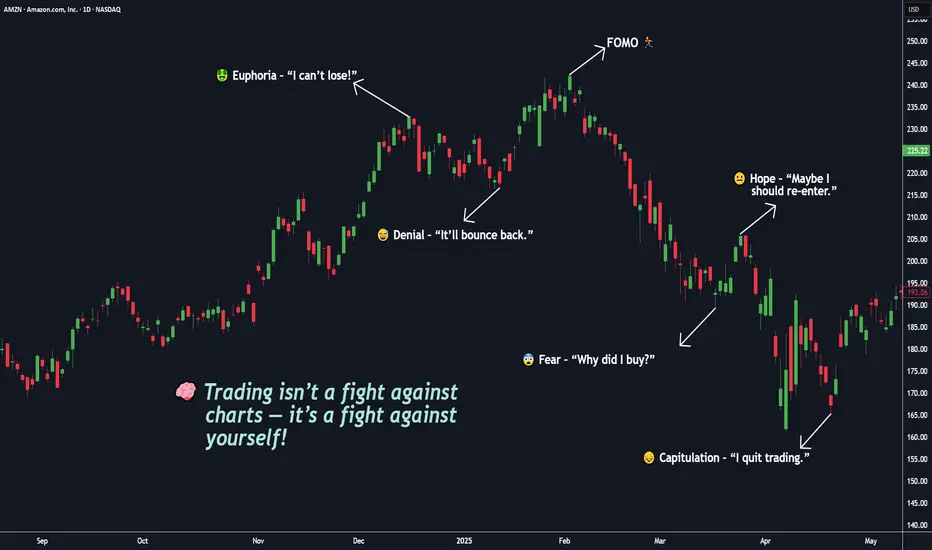
You’re Not Competing With the Market, You’re Competing With Self🧠 Trading isn’t a fight against charts — it’s a fight against yourself.
If you’ve ever told yourself “I’ll just take one more trade”, you already know this battle.
But in truth — the real battle happens inside your mind.
You start your day with discipline: BITSTAMP:BTCUSD , NASDAQ:AMZN , OANDA:XAUUSD , NASDAQ:META
📋 “ Two setups max. 1% risk. No emotions. ”
But then the market shows you something that looks perfect.
Price moves fast. Your pulse jumps. You click “BUY BUY BUY.”
Seconds later , the candle reverses — and suddenly, you chase a candle, break a rule, or move your stop just to “ give it a little more space ,” you’re not losing to the market my friend, You’re losing to your own impulses. ⚔️
You’re not trading the chart anymore — you’re trading your hope. And that’s what makes trading beautiful — it’s not a test of intelligence, it’s a mirror of your self-awareness.
That’s when the market does what it always does: it punishes emotional decisions and rewards patient ones.
💭 Emotionally! You start bargaining with yourself:
“It’ll come back.” ( When you’re greedy → it exposes it. )
“I’ll just move my stop a little.” ( When you’re fearful → it magnifies it. )
“Let me add to average out.” ( When you’re calm → it rewards it. )
The market doesn’t care if you win or lose. It simply amplifies your inner state.
You Digest it or not!, the truth most don’t want to accept:
You can’t control the market.
You can’t control news, indicators, or price spikes.
But you can control your reactions.
The moment you stop reacting and start observing — your trading transforms.
Clarity comes only when emotion leaves. 💎
⚡ Trading isn’t about predicting moves — it’s about managing yourself during those moves.
🎯 Real-Life Example:
Think back to the last time you made money on a random FOMO entry. It felt good, right?
That “instant win” wired your brain to believe impulsiveness works.
But the next time, that same instinct cost you twice as much.
That’s recency bias — one of trading’s silent killers.
Your brain craves the last emotion it felt, not the right decision.
💎 True mastery begins when you stop asking:
“Why did the market do that?”
and start asking:
“Why did I react like that?” ( 👉 “ Am I reacting, or am I responding ?” )
The market has no emotions . It’s just reflecting yours back at you — amplified, delayed, and multiplied by leverage. ⚔️
🧩 Here’s the mindset shift, that changes everything:
You don’t need to win every trade. You need to trade as if you already know yourself.
You don’t need a better indicator. You need a clearer mirror.
The edge isn’t on the screen — it’s inside your head.
When you realize that, trading becomes peaceful and You stop chasing, You start choosing.
Master that single question, and you’ll outperform 90% of traders who never will.
💬 What’s one emotion you think costs you the most trades —
👉 Fear 😨
👉 Greed 🤑
👉 Impatience ⚡
🧩 Drop it below 👇 and let’s talk about how to overcome it — build awareness together as traders, not competitors.
If this Idea gave you a value information then please, Boost it, share your thoughts in comments, and follow for more practical trading!
Happy Trading & Investing!
Team @TradeWithKeshhav
Peace Headlines Are Here — But Markets Have Already Moved OnA Russia-Ukraine peace deal making headlines right now is historic news — politically and emotionally.
But for the forex and commodities markets?
The real money already left this story behind months ago.
🧠 Smart Money Knows: Markets Price in the Future, Not the Past
Two years ago, the war sent shockwaves through oil, gas, wheat, and risk currencies.
By late 2023, price action had already normalized — the "war premium" faded out quietly.
Commodities stabilized. Forex volatility shifted. Safe havens lost their edge.
Traders adapted, recalibrated, and moved on to new battlegrounds.
Bottom Line:
The market already priced in a future where this conflict would eventually fade — peace or no peace.
📊 What Actually Drives Forex Now
While peace headlines grab attention, the real macro drivers today are:
🔥 Tariff escalation and global trade wars
🔥 Sticky inflation battles (core services inflation still high)
🔥 Central bank pivot games (Fed, ECB, BoJ)
🔥 Global growth fears (China slowdown, EU stagnation)
This is where new money is flowing.
Not into a two-year-old headline finally catching up.
🛡️ "Buy the Rumor, Sell the Fact" in Action
For two years, markets have priced in an eventual end (or fade) to the Ukraine conflict.
A peace agreement now?
→ It confirms expectations, not shocks them.
→ It may trigger a short-lived risk-on pop (EUR, AUD, NZD up, gold down) —
→ But unless it unleashes massive new money flows (unlikely), that pop gets sold.
🔥 Final Thought:
If you're still trading the last war, you're already late.
The next major moves won't come from peace headlines — they'll come from tariff escalations, inflation battles, and central bank pivots.
Focus forward.
That's where opportunity lives.
💬 Question for Serious Traders:
Which macro theme are you really watching into summer 2025?
Peace headlines... or the new fires already burning?
Drop your insights below. 👇

9 Simple Ratios Every Great Investor Uses - Buffett Included!Forget the hype, headlines, or hope. These 9 financial ratios are what real investors actually use to pick winners, but...
P/E? ROE? EPS? 🧐
- What are they, or better yet, WHO are they? 🤯
- How high is “too high”?
- Is a low number always good, or just a trap?
- Do all industries follow the same rules… or is that another myth?
Buffett. Greenblatt. Graham. Lynch.
They didn’t rely on vibes — they trusted fundamentals
After years of relying on charts, I built a 9-point fundamentals checklist to filter stocks faster and smarter. Now I’m sharing it with real-life examples and key insights to help you spot what really makes a stock worth owning:
Easy enough for new investors diving into fundamentals
Sharp enough to level up seasoned pros
Real enough to avoid hype
…but the truth is: these numbers did flag companies like Amazon, Apple, and Nvidia before the market gave them credit.
-----------------------------------------------------
✅ Quick Reference Table
Scan the table, then dive into the stories…
First Pro Tip: Bookmark this. You’ll check these before every stock pick.
-----------------------------------------------------
📊 1. P/E Ratio | Price-to-Earnings
What it tells you: How much you pay for each dollar of a company’s profit.
Short Example: A P/E of 20 means you pay $20 for $1 of profit. High P/E? Expect big growth or risk overpaying.
Strong: Between 15 and 25
Caution: Above 30 (unless fast growth)
Industry Averages:
- Tech: 25–40
- Utilities: 10–15
- Consumer Staples: 15–20
- Energy: 10–20
- Healthcare: 20–30
Story: In early 2023, NVIDIA’s P/E ratio hovered around 25, near the low end for tech stocks. Investors who saw this as a steal amid the AI boom were rewarded—NVIDIA’s stock made 4x by the end of 2024 as AI chip demand soared.
Contrast that with Tesla in Q1 2025, when its P/E spiked above 40 with slowing sales and Tesla’s stock dropped 50% in weeks.
Pro tip: A low P/E is not always good. If growth is weak or falling, it's often a trap.
Example: A utility company with a P/E of 30 is probably overpriced. A tech stock with 35 might still be fair — if growth justifies it.
-----------------------------------------------------
🧠 2. PEG Ratio | Price-to-Earnings-to-Growth
What it tells you: If a high P/E is worth it based on future profit growth. Whether the earnings growth justifies the price.
Short Example: A PEG below 1 means you’re getting growth at a fair price. High PEG? You’re overpaying.
Strong: Below 1
Caution: Above 2
Industry Averages:
- Software: below 1.5 is solid
- Consumer Goods: Below 2 is more realistic
- Tech: Below 1
- Consumer Staples: Below 1.5
- Healthcare: Below 1.2
- Financials: Below 1.5
- Energy: Below 1.3
Story: In mid-2022, Salesforce’s PEG was 0.8 (P/E 35, forward EPS growth 45%) as cloud demand surged. Investors who spotted this steal saw the stock climb 130% by the end of 2024. Meanwhile, Peloton in 2023 had a P/E of 20 but near-zero growth (PEG above 3). Its stock cratered -50% as fitness trends faded.
Story: NVIDIA’s PEG hit 0.9 in Q3 2023 (P/E 30, growth 35%) during AI hype, a steal for tech (average PEG below 1.2).
PEG filters hype. A stock can look expensive until you factor in growth.
-----------------------------------------------------
🧱 3. P/B Ratio | Price-to-Book
What it tells you: How much you pay compared to what the company owns (like buildings or cash).
Short Example: A P/B below 1.5 means you’re paying close to the company’s asset value. High P/B? Expect strong profits or risk.
Strong: Below 1.5
Caution: Below 1 + poor earnings = value trap
Industry Averages:
- Banks: Below 1.5
- Insurance: Below 1.3
- REITs: Use NAV (aim below 1.2)
- Tech: Often ignored
- Energy: Below 2
Story: In 2024, JPMorgan Chase’s P/B was 1.4, solid for banks (average below 1.5). Investors who bought enjoyed 100% gains.
n 2023, Bed Bath & Beyond’s P/B fell below 1 with collapsing earnings. It looked cheap but filed for bankruptcy that year.
Tip: Only use this in asset-heavy sectors like banking or real estate.
-----------------------------------------------------
⚙️ 4. ROE | Return on Equity
What it tells you: How well a company turns investor money into profits.
Short Example: An ROE above 15% means the company makes good money from your investment. Low ROE? Weak returns.
Strong: Above 15%
Caution: Below 10% unless in slow-growth industries
Industry Averages:
- Tech: 20–30%
- Consumer Staples: 15–25%
- Utilities: 8–12%
- Financials: 10–15%
- Healthcare: 15–20%
Story: Coca-Cola (KO) has kept ROE above 35% for years, a sign of brand power and pricing strength.
Eli Lilly’s (LLY) ROE stayed above 25% from 2022–2024, a healthcare leader (average 15–20%). Its weight-loss drug Mounjaro drove consistent profits, lifting the stock 150%+ in two years. Checking ROE trends helped investors spot this winner.
Tip: If ROE is high but D/E is also high, be careful, it might just be leverage.
-----------------------------------------------------
💰 5. Net Margin | Profitability
What it tells you: How much profit a company keeps from its sales or what % of revenue ends up as pure profit.
Short Example: A 10% margin means $10 profit per $100 in sales. Low margin? Tough business or high costs.
Strong: Above 10-15%+
Caution: Below 5%
Industry Averages:
- Software: 20–30%
- Retail: 2–5%
- Manufacturing: 8–12%
- Consumer Staples: 10–15%
- Energy: 5–10%
- Healthcare: 8–15%
Story: Walmart’s (WMT) 2% net margin looks tiny — but it’s expected in retail.
A software firm with 5%? That’s a warning — high costs or weak pricing.
In 2023, Zoom’s (ZM) net margin fell to 5% (down from 25% in 2021), well below software’s 20–30% average. Pricing pressure and competition crushed its stock quite a lot. Meanwhile, Apple’s 25% margin in 2024 (tech average 20%) remained a cash cow.
Tip: Margins show whether the company owns its pricing or competes on price.
-----------------------------------------------------
💣 6. D/E Ratio | Debt-to-Equity
What it tells you: How much debt a company uses compared to investor money.
Short Example: A D/E below 1 means more investor cash than debt. High D/E? Risky if profits dip.
Strong: Below 1
Caution: Above 2 (except REITs or utilities)
Industry Averages:
- Tech: 0–0.5
- Industrials: 0.5–1.5
- REITs: 1.5–2.5 (manageable due to structure)
- Utilities: 1–2
- Energy: 0.5–1.5
Story: In 2024, Tesla’s D/E dropped below 0.3 (tech average 0–0.5) as it paid down debt, signaling strength despite sales dips - a massive rally afterward.
Tip: Rising debt + falling profits = a storm coming. Always check both.
-----------------------------------------------------
💵 7. Free Cash Flow (FCF)
What it tells you: Cash left after paying for operations and growth investments.
Short Example: Apple’s $100 billion cash pile in 2024 funded stock buybacks, boosting shares. Low cash? Trouble looms.
Strong: Positive and growing
Caution: Negative for multiple years
Sector notes:
- Tech: Lots of cash (think billions)
- Industrials: Up and down, check trends
- REITs: Look at FFO (cash from properties), aim high
- Energy: Has cash, but swings with oil prices
- Healthcare: Steady cash, not too high
Story: Netflix had negative FCF while scaling content. Once costs stabilized, FCF turned positive and stock re-rated sharply.
Pro tip: Profits don’t mean much without real cash. FCF is often more honest.
Cash is king: Companies need cash to pay bills, reduce debt, or fund growth. If FCF is falling, they might be burning through cash reserves or borrowing, which isn’t sustainable.
Potential issues : This mismatch could signal problems like poor cash collection, heavy spending, or even accounting tricks to inflate profits.
-----------------------------------------------------
🚀 8. EPS Growth | Earnings Power
What it tells you: How fast a company’s profits per share are growing.
Short Example: EPS up 10% yearly means more profit per share, lifting stock prices. Flat EPS? No growth, no gains.
Strong: Above 10%
Caution: Below 5%, flat/negative for 3+ years
Industry Averages:
- Tech: 15–30%
- Staples: 5–10%
- REITs: 3–6% (via FFO growth)
- Healthcare: 10–15%
- Financials: 5–10%
- Energy: 5–15% (cyclical)
Story: In Q1 2024, NVIDIA’s forward EPS growth of 30% (tech average 20%+) fueled a rally as AI chips dominated. Checking forward estimates helped investors avoid traps like Intel, with flat EPS and a drop.
Pro tip: A stock with flat EPS and no dividend? There’s no reason to own it.
-----------------------------------------------------
💵 9. Dividend Yield | Passive Income
What it tells you: How much cash you get yearly from dividends per dollar invested.
Short Example: A 3% yield means $3 per $100 invested. High yield? Check if it’s sustainable.
Good: ~3–4%
Red Flag: Above 6% with a payout ratio above 80-90%
Industry Averages:
- Utilities: 3–5%
- REITs: 3–6%
- Consumer Staples: 2–4%
- Tech: 0–2%
- Energy: 2–5%
-----------------------------------------------------
💡 Final Thought: How to Use All of This
Top investors don’t use just one metric. They look at the whole picture:
Good growth? Check PEG.
Good profits? Confirm with ROE and margin.
Safe balance sheet? Look at D/E and cash flow.
Fair valuation? P/E + FCF Yield + P/B.
Real power = Combining metrics.
A company with P/E 15, PEG 0.8, ROE 20%, low debt, and positive FCF? That’s your winner.
A stock with P/E 8, but no growth, high debt, and negative cash flow? That’s a trap.
-----------------------------------------------------
Real-World Combos
🎯Winners:
Tech Gem: P/E 20, PEG 0.8, ROE 25%, D/E 0.4, growing FCF, EPS 20%+ (e.g., NVIDIA 2023: AI-driven growth, stock soared).
Energy Steal: P/E 15, P/B 1.5, FCF positive, Dividend Yield 3.5% (e.g., Chevron 2023: Cash flow king).
⚠️Traps:
Value Trap: P/E 8, flat EPS, D/E 2.5, negative FCF (e.g., Peloton 2023).
Overhyped Tech: P/E 50, PEG 3, Net Margin 5%, D/E 1.5 (e.g., Rivian 2024).
-----------------------------------------------------
🚀 Share your own combos!
What do you personally look for when picking a stock?
If you spotted something off in the numbers, or have a valuable insight to add — please, drop it in the comments.👇
💡 Let’s turn this into a thread that’s not just good but superb and genuinely helpful for everyone.
-----------------------------------------------------
Final Thought
“Buy great companies at fair prices, not fair companies at great prices.” – Warren Buffett
This guide gives you the map.
Charts, tell you when.
These numbers tell you what, and why.
And this post?
It’s just the beginning!
These 9 metrics are part one of a bigger series I’m building — where we’ll go even deeper, with more advanced ratios, smarter combos, and real case studies.
If this guide helped you see financial numbers a little clearer, there’s a good chance it’ll help your investor friend too, especially if they’re just starting their journey...🤝Share it with them!
I built this as much for myself as for anyone else who wants to get better.👊
If you made it this far — thank you! 🙏
...and super thankful if you hit "The Boost" on this post 🚀
Cheers,
Vaido

Understanding Market Activity in CryptoMarket activity measures the level of trading intensity in a market. It includes transaction volume, price fluctuations, supply and demand, and how different participants interact. In crypto, this is reflected in metrics like trading volume, liquidity, and order book depth.
Example: Bitcoin ( BTC ) trading volume spikes when major news (e.g., ETF approvals) or macroeconomic events occur. This increased activity shows how market sentiment drives price movement.
Who Are the Market Participants?
Market participants are anyone buying or selling an asset. In crypto, this includes:
- Retail traders (individuals buying BTC, ETH, etc.)
- Institutional investors (hedge funds, large companies)
- Market makers (liquidity providers ensuring smooth order flow)
- Miners & validators (securing the network and earning rewards)
The more participants in a market, the more liquid it becomes, making price movements smoother and reducing volatility.
Example: Bigger CEX have a deeper liquidity than a small DEX, meaning orders execute faster with less slippage.
Price + Time = Value (Crypto Perspective)
One fundamental rule in markets is:
➡️ Price + Time = Value
This means that an asset’s value is determined not just by its price but also by how long people are willing to hold or trade it.
Example: A long-term BTC holder who bought at $1,000 and held for 5 years sees a much different "value" than a day trader who flips BTC in minutes.
Additionally, crypto markets always have price levels that attract buyers and sellers (support and resistance levels).
Example: Bitcoin's $20,000 level in past cycles acted as both strong support and resistance, attracting buyers when the price dipped and sellers when it surged.
Market Analysis & Price Patterns (Normal Distribution in Crypto)
To analyze market activity, traders break price movements into time segments. One useful tool is the normal distribution curve, which shows where most trades happen.
Example: In on-chain analysis, if most Bitcoin transactions happen between $40,000–$45,000, this becomes the value area where market participants agree on price.
Crypto analogy: Think of a whale buying BTC in chunks over days, forming a distribution pattern. If they stop buying, price trends shift.
Supply & Demand in Crypto (Using a Bakery Analogy)
Markets function based on supply and demand. Imagine a bakery:
In the morning, fresh bread (high demand, low supply) = higher prices
By evening, leftover bread (low demand, excess supply) = discounted prices
The same happens in crypto:
New altcoin launch: Limited supply, high hype = price pumps
Token unlocks: More supply enters the market = price dumps
Example: When a project like Aptos (APT) unlocks millions of tokens, supply increases, and the price often drops due to selling pressure.
Short-Term vs. Long-Term Market Trends
Markets move in different timeframes—hourly, daily, weekly, and even yearly trends.
Short-term example: Ethereum’s price swings daily based on trader speculation.
Long-term example: Bitcoin halving cycles create multi-year trends that drive overall growth.
Example: In 2020, BTC was under $10K, but by 2021, it reached $69K due to long-term macro factors.
Crypto Market Makers (Real-World Examples)
Bitcoin Miners: Similar to a car company adjusting production, Bitcoin miners decide whether to sell mined BTC or hold it for higher prices.
2️⃣Whales & Institutions: Like property developers adjusting prices, whales accumulate crypto at low prices and distribute at highs.
3️⃣Liquidity Pools in DeFi: Like restaurants pricing meals based on demand, liquidity providers adjust fees and slippage in Uniswap pools.
Example: Alameda Research (before FTX collapsed) was a key market maker, providing liquidity across major crypto exchanges.
Long-Term Disruptions (Crypto Example: Ethereum vs. Bitcoin)
Long-term players reshape entire markets over time.
Example:
Bitcoin ( CRYPTOCAP:BTC ) was the first mover, dominating the crypto market for years.
Ethereum (ETH) introduced smart contracts, shifting activity from BTC to DeFi, NFTs, and Web3.
Now, new chains like Solana challenge ETH, forcing changes in network fees and scalability.
This mirrors how Japanese car companies disrupted the U.S. market, forcing competitors to evolve.
How to Spot Fair Prices in Crypto?
Markets always seek equilibrium—a price where buyers and sellers agree.
Example:
If a new altcoin doubles in price, but trading volume drops, it signals overvaluation.
If on-chain data shows steady BTC accumulation, it suggests a fair price floor forming.
➡️ Traders watch repeated transactions to gauge market sentiment.
Consumer Awareness in Crypto
As investors, we naturally understand how price and time impact value. However, we also need to watch long-term market participants like:
Whales (Smart Money): Who is accumulating?
On-Chain Data: Are large wallets buying or selling?
Institutional Trends: Are hedge funds moving into crypto?
📌 Example:
When Tesla bought #bitcoin in 2021, it signaled institutional confidence, but when they sold, market sentiment shifted.
Final Thoughts
Crypto markets follow the same supply and demand principles as traditional markets but with 24/7 trading, higher volatility, and unique tokenomics. Understanding market activity helps traders anticipate moves and make better investment decisions. 🚀
Hope you enjoyed the content I created, You can support with your likes and comments this idea so more people can watch!
✅Disclaimer: Please be aware of the risks involved in trading. This idea was made for educational purposes only not for financial Investment Purposes.
---
• Look at my ideas about interesting altcoins in the related section down below ↓
• For more ideas please hit "Like" and "Follow"!

Bitcoin: Don't be blind to the world (Trump inauguration)Regular readers will know that we avoid fundamental analysis In these reports - we stick to the price.
But that doesn’t mean being blind to the world around us.
On Monday January 20, Donald Trump will be inaugurated as US President.
I’m sure many of you have your political views about Trump - but just keep those away from your trade ideas!
The crypto market - and Bitcoin especially - has been on a huge rally since Trump spoke at a Bitcoin conference in favour of cryptocurrencies last year.
There’s a chance President Trump could mention Bitcoin in his inaugural speech but even if he doesn’t, the prospect of favourable regulation is broadly positive for Bitcoin - or if we’re more honest - the idea of better regulation could be enough justification to keep the crypto bull run going for now.
Bitcoin
On the weekly chart, we can see Bitcoin (BTC/USD) has been trading sideways around the $100,000 level - with roughly $90,000 as support.
But bigger picture it’s a huge uptrend and we want to trade in line with the trend (as always)
Importantly - it just closed the week back over the critical $100K mark - and it did so with a bullish engulfing candlestick that engulfed the previous 3 weeks.
As a reminder - where the week closed is more important than the high or low of the week - and a weekly close is more significant than a daily close. You can think of the closing price as the price that everybody agreed was the right price for that period.
The final missing piece to the bullish breakout is a weekly close at a new record high.
On the daily chart we are watching the broken trendline as well as the $100k level as support that needs to hold if the breakout is going to happen soon.
But while the price trendline is not especially reliable with only two ‘touches’ or swing points the broken RSI trendline is much more significant and shows a big pickup in momentum that will be needed if the price is to break out.
If the breakout does happen, the first barrier that needs to break is $110,000 but after that $120k then even $130k could come quite quickly given Trump’s inauguration this week.
But - as always - that’s just how my team and I are seeing things, what do you think?
Share your ideas with us - OR - send us a request!
Send us an email or message us on social media.
cheers!
Jasper

US Interest Rates: Impact on Global Markets and StrategiesUS interest rates are a cornerstone of the global financial system, wielding significant influence over markets worldwide. Set by the Federal Reserve (Fed), these rates dictate the cost of borrowing, the return on savings, and overall liquidity in the economy. However, the impact of US interest rates goes far beyond American borders, affecting currency pairs, stock markets, and global investment strategies.
This article explores how changes in US interest rates shape global markets, including their effect on currencies like EUR/USD and USD/JPY, stock prices, and the strategies investors can adopt to navigate rate hikes and cuts.
The Role of US Interest Rates in Global Markets
US interest rates, specifically the federal funds rate, are a crucial tool for managing the US economy, but they also play a critical role in global financial stability. When the Federal Reserve adjusts interest rates, it signals shifts in economic conditions, such as inflation control or economic stimulation, to investors and central banks worldwide.
Effective federal funds rate - Bank of New York
The influence of US interest rates extends beyond domestic policy. A higher US interest rate often attracts global capital, strengthening the US dollar as investors seek better returns. This shift in investment flows impacts foreign currencies, stock markets, and global economic growth, making US monetary policy a key factor in global financial strategies.
For example, a rise in US interest rates can strengthen the dollar and increase borrowing costs for emerging markets holding dollar-denominated debt. On the other hand, lower US interest rates can boost global liquidity, prompting investment in riskier assets like foreign equities or bonds. As such, US interest rates serve as a global benchmark, shaping monetary policy decisions and influencing investment strategies worldwide.
Inflation and US Interest Rates
Inflation is a central consideration in the Fed’s interest rate decisions. When inflation rises, the Fed typically raises interest rates to cool the economy by making borrowing more expensive, which in turn curbs consumer spending and business investment. Conversely, when inflation is low or the economy is struggling, the Fed cuts interest rates to encourage borrowing, boost spending, and stimulate economic growth.
The US Dollar Currency Index (DXY) dropped during the coronavirus pandemic despite the Fed raising interest rates.
However, the relationship between inflation and interest rates is a balancing act. If rates are cut too much or inflation rises while rates remain low, purchasing power can be eroded, causing instability in financial markets. In the global context, rising inflation in the US can weaken the dollar, affecting currency pairs like EUR/USD and USD/JPY, while inflation-related volatility in commodities like oil and gold can ripple across global markets.
For global investors, tracking US inflation trends and the Fed’s response is crucial for understanding potential shifts in exchange rates and market stability.
Impact on Currency Pairs
US interest rates have a direct impact on the US dollar’s value relative to other major currencies. When the Fed raises interest rates, the US dollar usually strengthens because higher rates offer better returns on dollar-denominated investments. This increase in demand for the dollar causes currency pairs like EUR/USD, GBP/USD, and USD/JPY to move in favor of the dollar, making these currencies weaker relative to the USD.
On the flip side, when the Fed lowers interest rates, the dollar typically weakens as investors look for higher returns in other currencies. As a result, other currencies gain strength relative to the USD, leading to significant shifts in global currency markets.
Moreover, interest rate differentials—the gap between interest rates in different countries—create opportunities for strategies like the carry trade, where investors borrow in a currency with low interest rates (such as the Japanese yen) and invest in a currency offering higher yields (like the US dollar). These strategies add further volatility to currency markets, especially when central banks adjust their policies unexpectedly.
Impact on Global Stock Markets
US interest rates have a profound influence on global stock markets. When the Federal Reserve raises interest rates, yields on US Treasury bonds increase, making them more attractive to investors seeking safer returns. This can lead to a shift away from equities, especially in riskier markets like emerging economies, and into bonds, causing stock prices to fall.
US Government Bonds 5 Years
US Government Bonds 2 Years
United State Interest Rate
Higher interest rates can also hurt sectors that are sensitive to borrowing costs, such as technology and consumer discretionary, which rely heavily on debt to finance growth. In contrast, financial stocks, particularly banks, often benefit from rising interest rates as they can charge more for loans, improving their profitability.
Conversely, when the Fed cuts interest rates, borrowing costs decrease, which can lead to a rally in stock markets. Sectors like technology and consumer discretionary tend to perform well in a low-interest-rate environment, as companies find it cheaper to borrow and expand. At the same time, dividend-paying stocks and real estate investment trusts (REITs) become more attractive as investors seek better returns than those offered by bonds.
Possible Market Reactions to a Fed Rate Cut
A Federal Reserve rate cut can trigger several reactions across global markets:
--Stock Market Rally: Lower interest rates reduce the cost of borrowing for businesses, potentially boosting economic activity and stock prices. Sectors like technology and consumer discretionary often benefit, while investors may also flock to dividend-paying stocks due to their relatively higher yields.
--Weaker US Dollar: A rate cut usually weakens the dollar, as lower rates make the currency less attractive to investors. This depreciation can benefit exporters and companies with significant foreign revenues but can hurt importers.
--Increased Inflation Risk: While rate cuts stimulate growth, they can also fuel inflation if demand exceeds supply. Investors may turn to inflation-protected assets like commodities or inflation-linked bonds.
--Emerging Markets: Lower US interest rates reduce borrowing costs for emerging markets, encouraging investment in their higher-yielding assets. However, a weaker dollar can lead to currency appreciation in these markets, impacting their export competitiveness.
--Bond Market Dynamics: A Fed rate cut can lead to lower yields on short-term US government bonds, pushing investors to seek better returns in long-term bonds or riskier assets.
Strategies for Managing Interest Rate Volatility
In periods of fluctuating interest rates, investors must adjust their strategies to protect portfolios and capitalize on new opportunities.
During Interest Rate Hikes:
--Shift to Bonds and Fixed-Income Assets: As interest rates rise, bonds, particularly short-term ones, offer higher yields, making them an attractive addition to portfolios.
--Focus on Financial Stocks: Banks and financial institutions benefit from higher rates, as they can charge more for loans, increasing their profits.
--Reduce Exposure to High-Growth Stocks: High-growth sectors, like technology, are more sensitive to rising borrowing costs and may underperform during rate hikes.
During Interest Rate Cuts:
--Increase Equity Exposure: Rate cuts often lead to stock market rallies, particularly in growth-oriented sectors like technology. Increasing equity exposure during rate cuts can help capture gains.
--Look for Dividend-Paying Stocks: In a low-rate environment, dividend-paying stocks become more attractive as investors seek yield.
--Consider Real Estate Investments: Lower rates reduce borrowing costs, making real estate and REITs more appealing as an investment.
Managing Volatility in Your Portfolio
To navigate the volatility caused by interest rate changes, diversification is essential. A well-diversified portfolio, spanning stocks, bonds, commodities, and currencies, can help mitigate the impact of rate fluctuations on overall returns.
Currency hedging is another key tool for managing volatility. When US interest rates rise, the dollar strengthens, potentially eroding the value of foreign-denominated investments. Hedging strategies using currency futures or options can protect against adverse currency movements.
Lastly, a focus on defensive stocks—such as utilities and consumer staples—can provide stability in uncertain times. These companies tend to have stable earnings and are less affected by interest rate changes.
Conclusion
US interest rates wield significant influence over global markets, affecting everything from currency pairs to stock prices. Investors must stay informed about the Fed's actions and adapt their strategies to reflect the current interest rate environment. By incorporating risk management tools like diversification, currency hedging, and a focus on defensive stocks, investors can better protect their portfolios and capitalize on opportunities that arise from interest rate fluctuations.

Stock feedback loopStock market is a adaptive system or a stock, with feedback loops (for inflow, outflow function). Where nobody knows the outcome or future, but feedbacks (corrections or resistance) gives tells (makes inflows or outflows). Without a common leader.
Economists think in models (price is the result of supply-demand, or inflow-outflow) that helps to explain system behavior (short term moves), but models are just ideas to explain complex world (models work until they dont). System thinkers study the stock not aggregate behavior .
Looking at markets trough perspective of "eco system" helps better understand the drivers or moving forces?

How to Perform Fundamental Analysis of StocksHow to Perform Fundamental Analysis of Stocks
In the dynamic world of financial markets, traders seek every available edge to make informed decisions. Among the numerous tools at their disposal, two approaches stand out: technical analysis and fundamental analysis of stocks. In this article, we will explore what fundamental analysis is, how it applies to stocks, and why it is a crucial tool for traders. Traders have the option to open an FXOpen account to perform fundamental analysis on numerous stocks available at FXOpen.
Understanding Fundamental Analysis
Before diving into the intricacies of fundamental analysis, it's essential to grasp the basics of technical and fundamental analysis.
Technical analysis primarily focuses on historical price and volume data to predict future price movements. Traders using this approach rely on charts, trendlines, and indicators like moving averages and Relative Strength Index (RSI) to make trading decisions.
Fundamental analysis, on the other hand, takes a more holistic view. It delves into the financial statements of a firm, examines economic indicators, and assesses industry trends. The goal is to determine the intrinsic value of an asset and whether it is overvalued or undervalued in the market.
Key Fundamental Analysis Components
Fundamental analysis involves several key components that traders must understand to make informed decisions:
Financial Statements
Fundamental analysis begins with a deep dive into a company's financial statements. These documents provide a wealth of information that is critical for assessing a company's financial performance. The three primary financial statements to consider are:
Balance Sheet: This statement offers an overview of a company's assets, liabilities, and shareholders' equity at a specific point in time. It acts as a quick overview of the company's financial standing.
Income Statement: Also known as the profit and loss statement, the income statement details a company's revenue, expenses, and profitability over a specific period. These ratios evaluate a company's capability to fulfil its immediate commitments.
Cash Flow Statement: The cash flow statement tracks the inflow and outflow of cash from the company's operating, investing, and financing activities. It offers valuable information about the company's liquidity and cash management.
Ratios and Metrics
To gain deeper insights into a company's financial health, fundamental analysts use various financial ratios and metrics. Some of the key ratios and metrics include:
Liquidity Ratios: These ratios evaluate a company's capability to fulfil its immediate commitments. Notable examples include the Current Ratio and Quick Ratio.
Profitability Ratios: These ratios measure a company's ability to generate profit relative to its revenue and assets. Examples include the Gross Margin, Net Profit Margin, Return on Equity (ROE), and Return on Assets (ROA).
Solvency Ratios: Solvency ratios evaluate a company's ability to meet its long-term financial obligations. The Debt-to-Equity Ratio and Interest Coverage Ratio are significant in this category.
Efficiency Ratios: These ratios assess how efficiently a company manages its resources to generate income. Examples include Inventory Turnover, Receivables Turnover, and Payables Turnover.
Growth Metrics
Understanding a firm's growth trajectory is essential for projecting its future potential and assessing its investment attractiveness.
Earnings Per Share (EPS) Growth: This metric indicates the rate at which a firm's earnings per share are increasing or decreasing over time.
Revenue Growth: It measures the growth in a firm's revenue compared to a specific period.
Book Value per Share Growth Rate: This metric assesses the increase in the firm's Book Value Per Share over the last five years.
Steps to Perform Fundamental Analysis
Here are the most essential steps to perform fundamental analysis.
Company Selection
The first step of fundamental analysis in the stock market is selecting the companies you want to analyse. Criteria for selection may include factors like the company's industry, market capitalisation, and growth potential. It's crucial to consider the broader industry landscape and market trends to identify promising candidates.
Collecting Financial Data
Gathering accurate and relevant financial data is paramount. Sources of financial data include the company's website, authority filings, and financial news outlets. Ensuring the data's accuracy and timeliness is essential for making informed decisions.
Analysing Financial Statements
In-depth analysis of a company's financial statements is the heart of fundamental analysis. Such metrics as a balance sheet and income and cash flow statements that were mentioned above are widely used by traders and investors to determine companies’ strengths and weaknesses.
Calculating and Interpreting Ratios
Utilising financial ratios is a critical aspect of fundamental analysis. These ratios provide a quantitative basis for evaluating a company's performance. Comparing the ratios with industry benchmarks helps identify areas of strength or weakness.
Evaluating Business Strategy
Assessing the quality of a company's management and its strategic decisions is another crucial element of fundamental analysis. This involves evaluating factors such as corporate governance, competitive positioning, and market share.
Economic and Industry Analysis
Understanding the broader economic landscape and industry dynamics is essential for contextualising a company's performance. Identifying macroeconomic trends and the stage of the industry lifecycle is critical.
Valuation Techniques
Fundamental analysts employ various valuation techniques to determine whether a stock is overvalued or undervalued. These techniques help traders make informed decisions about whether to buy, sell, or hold a particular asset. Common methods include:
Discounted Cash Flow (DCF) Analysis: This method calculates the present value of a company's future cash flows to estimate its intrinsic value.
Price-to-Earnings (P/E) Ratio Analysis: Comparing a company's stock price to its earnings per share, relative to industry peers, to assess its valuation.
Price-to-Book (P/B) Ratio Analysis: Comparing a company's market capitalisation to its book value per share to determine undervalued and overvalued companies.
Risk Factors and Limitations
Fundamental analysis, while a powerful tool, comes with its own set of challenges and limitations:
1. Incomplete Data: Many firms, especially in less regulated markets, may not disclose full financial information, thus hindering comprehensive analysis.
2. Future Uncertainty: Even though it's grounded in thorough research, fundamental analysis relies heavily on historical economic data. This approach also makes assumptions about future geopolitical and macroeconomic events, which can be unpredictable, thereby carrying a degree of inherent uncertainty.
3. Subjectivity: Different analysts may interpret the same data in various ways, leading to different conclusions about a currency's value.
4. Overemphasis on Long-term: Fundamental analysis typically focuses on long-term economic cycles and trends, potentially missing out on short-term trading opportunities.
5. Political Instabilities: Unexpected political events, like elections, conflicts, or diplomatic tensions, can have sudden and significant impacts on a stock value.
6. Global Events: Natural disasters, pandemics, or major technological breakthroughs can all have unforeseen effects on the stock market, making predictions based on fundamental analysis challenging.
7. Market Perception: Even if all fundamentals point towards a particular trend, market perception and investor sentiment can drive the market in the opposite direction.
8. Lagging Nature: By the time certain economic indicators are published, the market might have already reacted, making it a lagging tool.
By understanding these limitations, traders can complement their fundamental analysis with other techniques to make more informed decisions in the forex market.
Conclusion
Fundamental analysis is pivotal for traders who aim to make judicious decisions in the financial landscape. It extends beyond just scrutinising financial statements, encompassing the assessment of crucial ratios, metrics, and the overarching economic and industry environment to gauge an asset's inherent worth. FXOpen enhances this analytical journey with its suite of resources.
You can combine fundamental and technical tools on the TickTrader platform to conduct a comprehensive analysis, allowing you to navigate the intricate realm of financial markets with bolstered confidence and insight.
This article represents the opinion of the Companies operating under the FXOpen brand only. It is not to be construed as an offer, solicitation, or recommendation with respect to products and services provided by the Companies operating under the FXOpen brand, nor is it to be considered financial advice.

The Problem of Fundamental Analysis in the Crypto MarketFundamental analysis in the traditional financial markets involves evaluating a company's intrinsic value through a variety of metrics, such as earnings, revenue, and growth prospects. However, applying this same approach to cryptocurrency networks presents unique challenges. Cryptocurrencies operate on decentralized networks, and their value often stems from factors that don't align with conventional financial metrics.
Key Challenges:
Traditional Metrics Fall Short:
Cryptocurrency networks are not companies with revenues, profits, or physical assets. Therefore, traditional metrics like price-to-earnings (P/E) ratios or revenue growth don’t apply.
Misleading Social Media Data:
Social media presence and subscriber count might seem like indicators of a project’s popularity or potential, but these figures are easily manipulated. Fake followers, bots, and exaggerated engagement can create a false impression of legitimacy and success.
Isolated On-Chain Metrics:
While on-chain metrics provide valuable insights, they can be misleading if analyzed in isolation. For instance, a high number of active addresses might suggest widespread usage, but without context, it doesn't reveal whether these addresses represent genuine users or automated bots.
Relevant On-Chain Metrics:
Number of Transactions: Indicates the level of network activity, but doesn’t differentiate between meaningful transactions and spam.
Transaction Cost: Reflects the cost of using the network, which can indicate demand, but also congestion or inefficiency.
Active Addresses: Shows how many unique addresses are participating, but could be skewed by the creation of multiple addresses by a single entity.
Commissions (Fees): High fees might indicate network demand, but can also point to issues like scalability problems.
Hashrate or Coins in Staking: High hashrate or staking levels suggest network security and confidence, but can also centralize control if dominated by a few large players.
Design Indicators:
Whitepaper: This document outlines the project's goals, technology, and roadmap, but its value depends on the technical understanding of the reader and the honesty of the team.
Project Team: The experience and reputation of the team are crucial, but the anonymous or pseudonymous nature of many crypto projects complicates assessment.
Competitors: Understanding a project's competitors helps gauge its potential, but the fast-paced nature of the crypto space means that new competitors can emerge quickly.
Tokenomics: The economic model of the token, including supply, distribution, and incentives, is vital, but poorly designed tokenomics can lead to inflation or lack of demand.
Financial Indicators:
Capitalization: Market cap is often used as a quick measure of a project’s size and importance, but can be misleading in low-liquidity markets.
Liquidity: High liquidity indicates that an asset can be traded quickly without affecting its price, but low liquidity can lead to price manipulation.
Emission Method: The way tokens are issued (e.g., through mining, staking, or ICOs) affects supply dynamics, which can influence price stability and long-term viability.
In summary, while fundamental analysis in the crypto market is challenging, a multi-faceted approach combining on-chain metrics, design indicators, and financial indicators can offer valuable insights. However, these should always be interpreted with caution and in context, given the unique dynamics and rapid evolution of the cryptocurrency landscape.
Hope you enjoyed the content I created, You can support with your likes and comments this idea so more people can watch!
✅Disclaimer: Please be aware of the risks involved in trading. This idea was made for educational purposes only not for financial Investment Purposes.
---
• Look at my ideas about interesting altcoins in the related section down below ↓
• For more ideas please hit "Like" and "Follow"!

Insider Knowledge: Exploiting the House Money EffectIntroduction
In trading and investing, psychological biases significantly influence decision-making. One such bias is the "House Money Effect." Understanding this effect can help traders avoid common pitfalls and take advantage of this phenomenon.
What is the House Money Effect?
The House Money Effect is a psychological phenomenon where individuals are more likely to take risks with money they have won rather than their initial capital. In trading, this means traders become more risk-tolerant after experiencing gains, treating profits as "house money" and taking on higher risks than they would with their own capital.
Why Does It Happen?
The House Money Effect occurs due to several psychological factors:
Mental Accounting : People tend to treat money differently based on its source. Profits are often seen as less valuable than initial capital.
Overconfidence : After a winning streak, traders may become overconfident in their abilities, leading to riskier trades.
Loss Aversion : Gains are perceived as a buffer, reducing the fear of losses and encouraging riskier behavior.
Example of the House Money Effect on Crypto
In the 2021 Crypto Bull Market, we saw Bitcoin soar to all time highs. This subsequently caused many altcoins to rally really hard resulting in some 100-500x and numerous 2-3x tokens. If you observed at what point in the timeline this happened, this happened towards the end of the bull run, when everyone already knew about crypto and everybody was seemingly getting rich by buying cryptocurrencies. This was the peak of retail activity, which includes newcomers as well as those who got rich from holding tokens earlier.
This is a perfect example of the phenomenon with several key characteristics
Was after a period of extreme gains
Was causing risk assets to outperform, suggesting a higher risk tolerance in the market
Immediately after the markets tanked, clearly indicating this was a massive retail loss
By understanding and spotting the House Money Effect, traders can better manage their emotions and make more rational trading decisions. Recognizing this bias is the first step toward mitigating its impact and maintaining a disciplined trading strategy. We hope you enjoyed reading this idea.

Economic Calendar: Top Market Events You Should Watch Out forMarkets tend to get especially volatile whenever there’s an economic report or some data dump that takes investors by surprise. That’s why we’re spinning up this Idea where we highlight all the major market-moving events you should watch out for when you do your trading.
Today, we look at the Economic Calendar .
🏦 Central Bank Meetings and Announcements
• Federal Reserve (Fed) Meetings
The US Federal Reserve holds Federal Open Market Committee (FOMC) meetings roughly every six weeks,or ( eight times a year ), to talk about monetary policy, including interest rates. Setting interest rates is arguably the most significant event with long-lasting consequences for markets.
Each of these meeting takes two days and wraps up with a speech by the gentleman who moves markets with a simple “Good afternoon” — Fed boss Jay Powell.
• European Central Bank (ECB) Meetings
Similar to the Fed, the ECB holds regular meetings to decide on monetary policy and borrowing costs for the Eurozone.
ECB officials’ decisions sway financial markets, especially those based in the old continent. Indexes such as the Stoxx 600 Europe (ticker: SXXP ) and the European currency tend to fluctuate wildly during ECB events.
• Bank of England (BoE) Meetings
The BoE's Monetary Policy Committee (MPC) frequently meets to discuss and set interest rates and other monetary matters.
Decisions made by BoE policymakers mainly affect the UK corner of the financial markets. That means elevated volatility in the British pound sterling and the broad-based UK index, the FTSE 100, among other UK-based trading instruments .
• Bank of Japan (BoJ) Meetings
The BoJ holds policy meetings to decide on interest rates and monetary stimulus, among other central-bank topics.
Until recently, the Japanese central bank was the only one to sport a negative interest rate regime .
📝 Economic Data Releases
• Nonfarm Payrolls
In the US, the Bureau of Labor Statistics releases the Employment Situation Summary on the first Friday of every month. The data package includes the non-farm payroll print , which tracks how many new hires joined the workforce, the unemployment rate, and average hourly earnings.
• Consumer Price Index (CPI)
Monthly CPI measures the rate of inflation at the consumer level. The reading is closely monitored by the Fed in order to gauge the temperature of the economy. A reading too hot indicates an expanding economy, and vice versa.
• Producer Price Index (PPI)
Similar to CPI, PPI measures inflation at the wholesale level and can provide signals about inflation trends.
• Gross Domestic Product (GDP)
Quarterly GDP churns out a comprehensive measure of a country's economic activity and growth.
• Retail Sales
Monthly retail sales indicate consumer spending patterns, which are a critical component of economic activity. The data shows whether consumers pulled back from spending or splurged like there’s no tomorrow.
• Purchasing Managers' Index (PMI)
PMI reports for manufacturing and services sectors lay out insights into business activity and economic health.
🏢 Corporate Earnings Reports
Publicly traded companies around the world release earnings reports every quarter. The hottest ones are America’s corporate giants, such as tech stocks , banking stocks , and more.
The quarterly earnings figures include financial performance for the most recent three months and forward-looking guidance, which comprises earnings and revenue expectations.
🌐 Geopolitical Events
Political developments, such as Presidential elections, and geopolitical tensions can have immediate and significant impacts on financial markets. These events are less predictable but are closely monitored by market participants and can quickly fuel volatility across asset classes, prompting investors to shuffle their portfolio holdings.
Final Considerations
Pay attention to these reports, events, and economic data and you’ll get to understand what moves markets. Anytime you witness a sharp reaction in gold ( XAU/USD ) or a quick reversal in the US dollar ( DXY ), it’s likely that the underlying factor is an economic report you didn’t know about.
If you do track them — which one is your favorite market report or economic news release? Let us know in the comments below!

Understanding the Differences Between Stock Market and Crypto P2Thank you very much for your support, as I told when we will get 20+ likes on Part 1, than I will make Part 2. Here you get the summary of each, with the other points:
10. Market Infrastructure: The infrastructure supporting traditional stock markets, including trading platforms, clearing systems, and market data providers, is well-established and interconnected, whereas the infrastructure for the crypto market is still evolving and fragmented, with multiple competing platforms and protocols.
11. Market History: Traditional stock markets have a long history dating back centuries, with well-documented market cycles and economic trends, whereas the crypto market has a relatively short history, with significant price movements driven by technological developments and market speculation.
12. Regulation of Investment Products: Traditional stock markets offer a wide range of investment products, including stocks, bonds, mutual funds, and exchange-traded funds (ETFs), all subject to regulatory oversight, whereas the crypto market primarily offers cryptocurrencies and tokenized assets with varying degrees of regulatory clarity.
13. Market Correlation: Stocks and traditional financial assets often exhibit correlations with broader economic indicators such as GDP growth and interest rates, whereas the crypto market may demonstrate correlations with factors such as Bitcoin dominance, market sentiment, and technological developments.
14. Market Participants: Traditional stock markets attract a diverse range of participants, including retail investors, institutional investors, hedge funds, and pension funds, whereas the crypto market has a more diverse participant base, including retail traders, technology enthusiasts, speculators, and early adopters of blockchain technology.
15. Market Fragmentation: The stock market operates as a unified marketplace with standardized trading rules and regulations, whereas the crypto market is fragmented across multiple exchanges, each with its own trading protocols, liquidity pools, and pricing mechanisms.
16. Market Impact of News Events: News events such as corporate earnings releases, economic data reports, and geopolitical developments have a significant impact on stock market movements, whereas the crypto market may react more strongly to news related to regulatory developments, technological advancements, and adoption trends.
17. Market Efficiency: The efficiency of traditional stock markets is supported by established trading mechanisms, liquidity providers, and market makers, leading to relatively stable price discovery and reduced arbitrage opportunities, whereas the crypto market may experience inefficiencies due to lower liquidity, market manipulation, and regulatory uncertainties.
Stock Market:
Pros:
Stability: Stock markets have a long history and are generally stable investment options.
Regulation: They are heavily regulated, providing a level of security for investors.
Diversification: Investors can choose from a wide range of stocks across various sectors and industries.
Dividends: Many stocks offer dividends, providing a source of passive income.
Access to Information: There is a wealth of financial information available for analysis and research.
Cons:
Limited Trading Hours: Stock markets operate during specific hours on weekdays, limiting trading opportunities.
High Entry Barriers: Some stocks may require a significant investment, making it inaccessible for small investors.
Market Volatility: While generally stable, stock markets can still experience significant volatility during economic downturns or market crises.
Slow Settlement: Settlement times for stock transactions can take several days, delaying access to funds.
Limited Accessibility: Access to certain stocks may be restricted based on geographical location or regulatory requirements.
Crypto Market:
Pros:
24/7 Trading: Cryptocurrency markets operate 24/7, allowing for round-the-clock trading.
Accessibility: Anyone with internet access can participate in the crypto market, promoting inclusivity.
Potential for High Returns: The crypto market has seen explosive growth, offering the potential for high returns on investment.
Decentralization: Cryptocurrencies operate on decentralized networks, reducing dependency on centralized authorities.
Technological Innovation: The crypto market is at the forefront of technological innovation, with developments in blockchain and decentralized finance (DeFi).
Cons:
Volatility: Cryptocurrencies are highly volatile and can experience rapid price fluctuations.
Lack of Regulation: Regulatory uncertainty in the crypto market can lead to investment risks and market manipulation.
Security Risks: Cryptocurrency exchanges and wallets are susceptible to hacking and cyberattacks.
Limited Adoption: Despite growth, cryptocurrencies still face challenges in widespread adoption as a mainstream form of payment.
Complexity: Understanding cryptocurrencies and blockchain technology can be challenging for newcomers, leading to potential investment mistakes.
Summary:
Both the stock market and the crypto market offer unique opportunities and challenges for investors. The stock market provides stability, regulation, and a wide range of investment options, while the crypto market offers accessibility, potential for high returns, and technological innovation. Deciding which market is better depends on individual preferences, risk tolerance, and investment goals. Diversification across both markets may provide a balanced approach to building an investment portfolio.

📈Mastering Stock Selection:A Journey to Long-Term Wealth💰Part1Interested in selecting high-quality stocks and growing your wealth through long-term investing? Today, I'll guide you through effective stock selection methods, including the top-bottom and bottom-top approaches. Remember, as Warren Buffett famously said, "The stock market is designed to transfer money from the active to the patient." 💼📈
Let's start with the top-bottom approach. First, you choose an economy, such as Indian, US, or UK. Next, select a sector within that economy, like Financial Services, IT, or Pharma. From there, narrow down to an industry within the sector, such as AI, Clean-technology, or Hardware. Finally, choose a company within the industry. Don't worry if it seems complex – I'll provide examples and guidance throughout. 💡🔍
Conversely, the bottom-top approach flips this order. We start by selecting a company, then move up to its industry, sector, and finally, the economy. 💼🔄
Let's put theory into practice with the top-bottom approach: (a random example)
1. Choose India as the economy.
2.Select the IT sector for its promising future.
3. Opt for AI as the industry due to its potential.
4. Select Infosys as a company.
Now, it's your turn! Share examples of top-bottom or bottom-top approaches in the comments for practice. 💬💡
In the upcoming discussions, we'll delve into the fundamentals of sector, industry, and company analysis. Don't worry—I'll explain everything from market cap and cash flow to return on equity (ROE). 📊✨
Target of likes (boosts): 25+ (if we achieve our target than I will make Part 2) 🎯🚀
Follow for more such ideas & learning content! 🔍

Stock Market Logic Series #9Two Daggers Buy Pattern EXPLAINED
This is a super powerful pattern for a buy. Especially if you are a value investor.
What do you want to look for?
1. You must see TWO daggers to the downside.
A dagger is an extremely abnormal drop in price with a HUGE volume.
You want to see the first dagger, and then pray for the price to continue falling at a normal rate.
Normal rate = people are trying to pick the bottom (without success).
Then you want to look for (wait = put alerts) for the SECOND DAGGER.
Then after the second dagger arrives and you get a second sharp drop in price, then you want to expect a rejection up and a new strong trend up should emerge.
2. Exterme volume on the daggers!
Ideally, you want the volume of the second dagger to be bigger than the first one.
This means that someone is loading all he can get since he KNOWS KNOWS KNOWS that the price is going to get higher for sure.
I bet you would have done the same... if you KNOW KNOW KNOW its going UP!
This pattern does not happen all the time, and it is more likely to happen near the end of a bear market. But prices get so unreasonably cheap, that its obviously for fundamental reasons that they are wrong! so someone who KNOWS will take all the money he can get to load into this stock at this price.

Getting Paid? With the USD/TRY Carry Trade?The USD/TRY has one of the highest Roll Over Interest out there should you choose to take on this highly volatile pair. It isn't so much that it is volatile, it has to do more with price just moves one direction, and that is up. The way we want to go is down (short) or at least sideways (ranging). Why is this interesting? It is because the Rollover Interest for going short stands at a whopping annualized rate of 28.94%. With 1:4 Margin Requirement for trading a standard lot on the TRY (based off the broker I use), $25,000 could earn me $28,940 yearly, which would be a staggering 115% return at the end of the year. Compounded, I would be a multimillionaire in no time, Buying up yachts, private jets, gourmet food, luxury cars, a pony that shoots lasers, Space X Starship, and countless other items.
But hold up, is there a downside or something that makes this too good to be true? Yes, there is price movement as well as changes in interest rates as well as capital in the account. Having only $25,000 in the account, going full throttle and placing one huge position is sure to activate a margin call within seconds (as price can move thousands of pips against you quickly) and/or cause you to lose more than you put in. Now, we don't want that. You would need to have at least double the amount in the account in order to allow for price movement. The return would be halved, but making over 50% yearly isn't too bad either, is it? With price movement, the USD/TRY (I just call it the TRY), price moved higher over 57,000 pips in 2022, and over 100,000 pips in 2023; that is $18,240 and $32,000 respectively. Interest have just reached 45%, so things definitely would not have been good. Now, with funds in your account, not to many of us have $25,000 lying around to utilize in the markets, nor do we want to just tie up $25,000 into something really risky.
Yet if used correctly and price does stabilize, then the TRY carry trade could payout (similar to the EUR/HUF). What could be done to reduce the risk? For starters, position sizing. Don't use the full force of your account and go "YOLO." Manage expectations. With a $25,000 account size, only getting into a position at around $3,750 (which is about 15% of the account used and a 15k position), would be around $3,650 return, which would be about a 14.6% return (still not bad. How many people can do this). If things go sour and price does move up at the end the year by 100,000 pips against you ($0.05 move per pip), that would be -$5,000 reduced to $1,350 because of the gained rollover interest (which would be only a 5% hit to your account instead of 20%). Putting some hedges in could also reduce some of the risk. Additionally, research and analysis, this could push you to make a more informative speculation on if getting into the pair is a good idea. Furthermore, to really ensure you don't lose any money, is to not get into the pair at all.
For myself, I am utilizing around 41% of my Forex account in this pair, about 14% of my overall accounts. There are hedges in place to reduce the impact of price moving against me as well as my position being small enough to not cause any traumatic moves, even if price moves 100,000 pips against me (of course don't want that to happen). The decision is also made to stay in this pair for the long term or until there is some major changes. There is additional funds in reserves if needed, if things don't go well, in order to put another plan into play to get out of my positions in an orderly fashion.
You all have some great trading out there.
