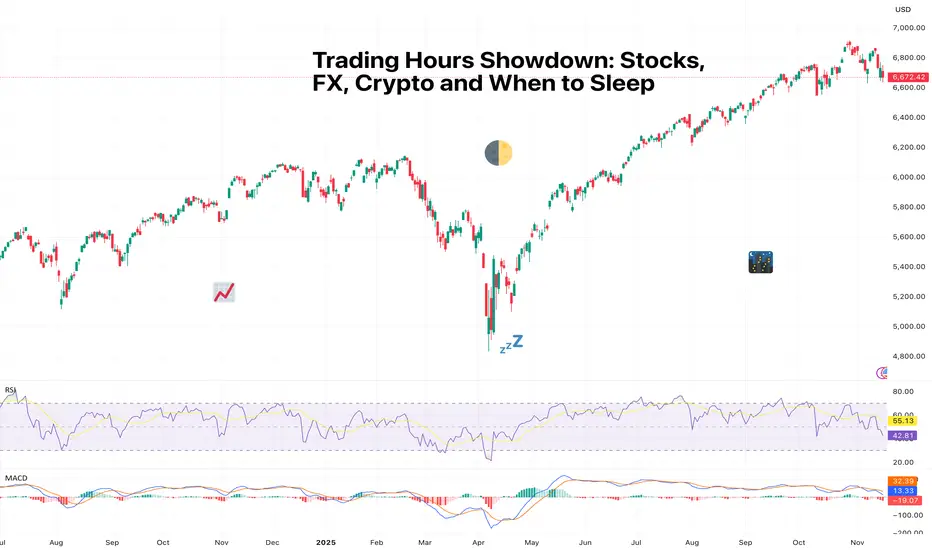
Trading Hours Showdown: Stocks, FX, Crypto and When to SleepSome markets close, some don’t, and some don’t care that you need rest.
If financial markets were people, they’d each have wildly different sleeping habits. Stocks tuck themselves in usually at 4 p.m. (that is, where they originate from), FX stays up all night but insists it’s “fine,” and crypto is that friend who messages you at 3 a.m. with a life-changing idea (and a 12% move for fun).
Understanding when each market is awake, liquid, and volatile is one of the most underrated skills a trader can have. It’s not just about timing entries; it’s about managing risk while you’re away from your devices.
Let’s break down the global sleep schedule and why your portfolio should care.
🌅 Stocks: The 9-to-5ers of the Financial World
US stocks like routine. They open at 9:30 a.m. ET, close at 4 p.m., and observe weekends and holidays like well-behaved citizens.
There’s also pre-market and after-hours trading, but liquidity dries up real fast and moves tend to be exaggerated.
Why it matters:
Limited hours = overnight gap risk
Most volume typically happens in the first and last 30 minutes
Big news after hours can cause violent opens the next day
Stops can’t protect you when price jumps over your level
Every trader eventually experiences the heartbreak of a perfect setup ruined by an overnight earnings surprise. Consider it a rite of passage.
🌍 Forex: The Market with No Bedtime
FX ( forex or foreign exchange) trades 24 hours a day, five days a week, rotating through global sessions:
Asia (Tokyo)
Europe (London)
US (New York)
That’s a 120-hour work week with no break. Think of it like a global relay race where someone is always awake and analyzing inflation differentials.
Why traders love it:
Continuous liquidity = fewer gaps
Beautiful macro-driven trends
Volatility waves follow session overlaps (London–NY especially)
But…
FX weekends could be silent killers. You’re unprotected from Friday close to Sunday open. That’s plenty of time for geopolitical headlines, surprise events, central bank drama, or a country deciding to unpeg its currency.
🔥 Crypto: The Market That Never Sleeps or Blinks
The cryptocurrency market trades 24/7/365. No days off, no weekends, no holidays, no rest. Just pure, unfiltered price action around the clock.
This sounds great until you realize you can never fully unplug. Bitcoin BITSTAMP:BTCUSD does not respect your circadian rhythm.
Why it’s unique:
No “overnight gaps” because it never closes
But liquidity gaps may appear during low-volume hours
Late-night moves can be extreme due to thin order books
Leverage unwinds can trigger liquidation cascades at 3 a.m.
Global retail participation exaggerates emotional spikes
Crypto doesn’t gap like stocks, but it drifts, snaps, and rips through levels and can make your stomach churn.
🧭 Liquidity: The Real Story Behind the Sleep Schedule
Across markets, the one concept that ties them all together is liquidity. That is, how deep the order book is and how efficiently your trades can execute.
Stocks
Thick liquidity during US hours
Thin, jumpy after-hours
Prone to large news-driven gaps
Forex
Deep liquidity almost 24 hours a day
Most volume during London–NY overlap
Macro news instantly reflected in price
Crypto
Liquidity pockets vary wildly
Exchanges differ in depth
Weekends and Asia-over-US crossovers can trigger whipsaws
😴 The Question of Sleep (And How Traders Manage It)
Traders eventually learn a few things about trading various asset classes.
If you:
Hate surprises → Avoid overnight stock positions
Love macro trends → FX is your playground
Enjoy volatility → Crypto keeps things interesting
Value sleep → Choose an asset class that aligns with your time zone and day trade it
Choosing a market to trade isn’t just about your strategy, but also about your lifestyle.
Volatility doesn’t just depend on the asset. It depends on when you’re watching.
Off to you : How do you deal with trading different assets in different time zones? Are you a niche player or a broader market maven? Share your comments below!
Fx
Mechanical rangesMany traders will talk about things like "Smart Money Concepts" (SMC) and think they have found something new.
The truth is, everything in trading stems back to Liquidity.
There is no "Algo" nobody is out to get you specifically. The market is always right, where you position yourself is your own choice.
I have written several posts on mechanical trading, recorded a number of streams. The more mechanical you can make the process, the less the emotions have a chance to kick your ass.
Let me give you a very simple method of being able to identify the ranges. Ignore the timeframes as this will work on any of them, on most instruments. (I say most, as some behave differently due to how it attracts liquidity). Lets assume high end crypto such as Bitcoin (BTC) and of course Forex in the general sense, stocks, commodities etc.
This is simple - only 2 rules.
You start by zooming out and giving yourself a general feel for the trend.
Let's say this looks to be an uptrend - we now need to understand the rules.
An opposing candle can simply be defined by a different colour. If the trend is up (Green) and we see a red candle - then it's an opposing candle.
The inverse is true, if we are down and the trend is Red. Then a Green candle would be opposing.
This is only half of the story. The second rule is a pullback candle or even a sequence of candles. This simply means either the very same opposing candle that doesn't make a new high or low (depending on the trend up not making fresh highs or down not taking new lows).
In this image, you can see we have in one candle both an opposing and pullback in one candle. This means we can now mark the high of the range. Working backwards to identify the swing range low.
This easy method means I can draw a range exactly the same and mechanically every single time.
Giving me a mechanical range.
We could then get a lot more technical by looking for liquidity, 50% of the range or places such as supply or demand areas.
But these are all for other posts.
For now, getting a range on the higher timeframes means you can work down and down into a timeframe you are likely to want to trade on.
These ranges will give clues to draws and runs of liquidity.
This will also help identify changes in the character and fresh breaks of structure.
Here's another post I posted on the mechanical structures and techniques.
More in the next post.
Have a great week!
Disclaimer
This idea does not constitute as financial advice. It is for educational purposes only, our principal trader has over 25 years' experience in stocks, ETF's, and Forex. Hence each trade setup might have different hold times, entry or exit conditions, and will vary from the post/idea shared here. You can use the information from this post to make your own trading plan for the instrument discussed. Trading carries a risk; a high percentage of retail traders lose money. Please keep this in mind when entering any trade. Stay safe.

Behind the Curtain The Economic Pulse Behind Euro FX1. Introduction
Euro FX Futures (6E), traded on the CME, offer traders exposure to the euro-dollar exchange rate with precision, liquidity, and leverage. Whether hedging European currency risk or speculating on macro shifts, Euro FX contracts remain a vital component of global currency markets.
But what truly moves the euro? Beyond central bank meetings and headlines, the euro reacts sharply to macroeconomic data that signals growth, inflation, or risk appetite. Using a Random Forest Regressor, we explored how economic indicators correlate with Euro FX Futures returns across different timeframes.
In this article, we uncover which metrics drive the euro daily, weekly, and monthly, offering traders a structured, data-backed approach to navigating the Euro FX landscape.
2. Understanding Euro FX Futures Contracts
The CME offers two primary Euro FX Futures products:
o Standard Euro FX Futures (6E):
Contract Size: 125,000 €
Tick Size: 0.000050 per euro = $6.25 per tick per contract
Trading Hours: Nearly 24 hours, Sunday to Friday (US)
o Micro Euro FX Futures (M6E):
Contract Size: 12,500 € (1/10th the size of 6E)
Tick Size: 0.0001 per euro = $1.25 per tick per contract
Accessible to: Smaller accounts, strategy testers, and traders managing precise exposure
o Margins:
6E Initial Margin: ≈ $2,600 per contract (subject to volatility)
M6E Initial Margin: ≈ $260 per contract
Whether trading full-size or micro contracts, Euro FX Futures offer capital-efficient access to one of the most liquid currency pairs globally. Traders benefit from leverage, scalability, and transparent pricing, with the ability to hedge or speculate on Euro FX trends across timeframes.
3. Daily Timeframe: Key Economic Indicators
For day traders, short-term price action in the euro often hinges on rapidly released data that affects market sentiment and intraday flow. According to machine learning results, the top 3 daily drivers are:
Housing Starts: Surging housing starts in the U.S. can signal economic strength and pressure the euro via stronger USD flows. Conversely, weaker construction activity may weaken the dollar and support the euro.
Consumer Sentiment Index: A sentiment-driven metric that reflects household confidence. Optimistic consumers suggest robust consumption and a firm dollar, while pessimism may favor EUR strength on defensive rotation.
Housing Price Index (HPI): Rising home prices can stoke inflation fears and central bank hawkishness, affecting yield differentials between the euro and the dollar. HPI moves often spark short-term FX volatility.
4. Weekly Timeframe: Key Economic Indicators
Swing traders looking for trends spanning several sessions often lean on energy prices and labor data. Weekly insights from our Random Forest model show these three indicators as top drivers:
WTI Crude Oil Prices: Oil prices affect global inflation and trade dynamics. Rising WTI can fuel EUR strength if it leads to USD weakness via inflation concerns or reduced real yields.
Continuing Jobless Claims: An uptick in claims may suggest softening labor conditions in the U.S., potentially bullish for EUR as it implies slower Fed tightening or economic strain.
Brent Crude Oil Prices: As the global benchmark, Brent’s influence on inflation and trade flows is significant. Sustained Brent rallies could create euro tailwinds through weakening dollar momentum.
5. Monthly Timeframe: Key Economic Indicators
Position traders and institutional participants often focus on macroeconomic indicators with structural weight—those that influence monetary policy direction, capital flow, and long-term sentiment. The following three monthly indicators emerged as dominant forces shaping Euro FX Futures:
Industrial Production: A cornerstone of economic output, rising industrial production reflects strong manufacturing activity. Strong U.S. numbers can support the dollar, while a slowdown may benefit the euro. Likewise, weaker European output could undermine EUR demand.
Velocity of Money (M2): This metric reveals how quickly money is circulating in the economy. A rising M2 velocity suggests increased spending and inflationary pressures—potentially positive for the dollar and negative for the euro. Falling velocity signals stagnation and may shift flows into the euro as a lower-yield alternative.
Initial Jobless Claims: While often viewed weekly, the monthly average could reveal structural labor market resilience. A rising trend may weaken the dollar, reinforcing EUR gains as expectations for interest rate cuts grow.
6. Strategy Alignment by Trading Style
Each indicator offers unique insights depending on your approach to market participation:
Day Traders: Focus on the immediacy of daily indicators like Housing Starts, Consumer Sentiment, and Housing Price Index.
Swing Traders: Leverage weekly indicators like Crude Oil Prices and Continuing Claims to ride mid-term moves.
Position Traders: Watch longer-term data such as Industrial Production and M2 Velocity.
7. Risk Management
Currency futures provide access to high leverage and broad macro exposure. With that comes responsibility. Traders must actively manage position sizing, volatility exposure, and stop placement.
Economic indicators inform price movement probabilities—not certainties—making risk protocols just as essential as trade entries.
8. Conclusion
Euro FX Futures are shaped by a deep web of macroeconomic forces. From Consumer Sentiment and Oil Prices to Industrial Production and Money Velocity, each indicator tells part of the story behind Euro FX movement.
Thanks to machine learning, we’ve spotlighted the most impactful data across timeframes, offering traders a framework to align their approach with the heartbeat of the market.
As we continue the "Behind the Curtain" series, stay tuned for future editions uncovering the hidden economic forces behind other major futures markets.
When charting futures, the data provided could be delayed. Traders working with the ticker symbols discussed in this idea may prefer to use CME Group real-time data plan on TradingView: www.tradingview.com - This consideration is particularly important for shorter-term traders, whereas it may be less critical for those focused on longer-term trading strategies.
General Disclaimer:
The trade ideas presented herein are solely for illustrative purposes forming a part of a case study intended to demonstrate key principles in risk management within the context of the specific market scenarios discussed. These ideas are not to be interpreted as investment recommendations or financial advice. They do not endorse or promote any specific trading strategies, financial products, or services. The information provided is based on data believed to be reliable; however, its accuracy or completeness cannot be guaranteed. Trading in financial markets involves risks, including the potential loss of principal. Each individual should conduct their own research and consult with professional financial advisors before making any investment decisions. The author or publisher of this content bears no responsibility for any actions taken based on the information provided or for any resultant financial or other losses.

Tips on Adjusting the RSI (Part 2) Although the standard setting for the RSI is 70 (overbought) and 30 (oversold), I prefer to adjust the levels to 80 and 20. The purpose of this is to identify the extremely overbought/oversold regions.
In addition to adjusting the levels, I would pay attention to the chart when the RSI enters in the overbought/oversold region (but would hold back on entering a trade)
I would only enter a trade when the RSI turns down/up from the overbought/oversold region.
This would signal that the price is likely to fall/rise as the RSI reverses from the extremes and back within range.

Learning to use the RSI (Part 1)The Relative Strength Index (RSI) is a popular momentum oscillator used in technical analysis to identify overbought or oversold conditions in the market. The RSI is measured on a scale from 0 to 100,
RSI values above 70 are often considered overbought, suggesting that the price may be due for a reversal or pullback.
RSI values below 30 are often considered oversold, indicating that the price may be due for a bounce or recovery.
A common mistake most traders will make is to assume that once RSI signals an overbought/oversold condition, the price should drop/rise, hence leading to a sell/buy decision.
In the 2 examples highlighted (solid blue lines), you will notice that although RSI signaled an overbought/oversold condition, the price continued to climb/drop despite being overbought/oversold.
Remember: Prices can be overbought/oversold for an extended period of time
When using any indicator, always remind yourself of what it is measuring and remember that it is just math (not magic). The indicator is supposed to help quantify and help you see things clearer on the chart (rather than numbers).
Check out Part 2 for Tips on Adjusting the RSI

Trade Discipline - Improving Your Entries
How many times have you been stopped out of a great trading idea you noticed just because you missed your original entry and decided to enter at a worse price?
This was most likely due to the fear of missing out (FOMO) and lack of discipline that got you into the trade.
You were right on the market direction, but due to FOMO and your lack of discipline, the trade entry was bad, and you ended up being stopped out, only to then painfully watch the market go your way.
Do not feel bad, as this has happened to the best of us, so this post will discuss methods on how to improve your entries and discipline to ensure that you do not get stopped out again because of a bad entry.
Never chase missed entries.
Let’s say the market is in a nice healthy trend, making a series of higher highs and higher lows. And when you overlay the 20-day moving average over it, you notice the market bounce off the moving average quite a few times. You then get a buy signal near the moving average, but unfortunately, you missed the entry and are just watching the market go up without making any money from it.
Now, when you look at the chart, the market is very far away from the 20-day moving average. So even though the market is currently in an uptrend, ideally you don’t want to be buying now because, from looking at your analysis, the market tends to pull back to the 20-day moving average. If you impulsively buy when the price is very far away from the 20-day moving average, when the price is overstretched and the market has been overbought, there’s a high probability the market will reverse or pullback, and you will most likely get stopped out.
We all miss entries and opportunities; it is completely normal to do so, and sometimes the market can give you a second chance to enter by coming back to your original level. If it does not and you completely miss the move, do not dwell on it; dust it off and move on. The markets are not going anywhere, and plenty more opportunities will come your way.
You can see in the above image why it is a bad idea to chase missed entries. When the impulsive move has happened and you missed the initial move, leave the market alone at that current time. Either wait for a pullback to trade the continuation, or if your analysis is suggesting a possible market reversal, then wait for a confirmation signal and trade the reversal at a good entry price.
Be Proactive.
Many traders, especially beginners, do not place enough importance on entries when trying to get consistent profits in the markets. The reason why entries are important is due to market noise and the limited funds that traders have. Let me explain further: Traders are buying and selling constantly; therefore, all markets have ups and downs (market noise). This means that markets rarely go up and down in a straight line, so when you put your hard-earned capital at risk in a trade, due to the up and down ticks, your capital will float up and down as the market moves up and down. So if your entry is bad, then you are more likely to get stopped out due to market noise.
If you want to see consistency in your trading, it is crucial to work on your timing and discipline. The best thing you can do to improve the entries in your trades is to be proactive, not reactive.
Being proactive means planning ahead for your trade entry. You must do your homework to anticipate and predict the key levels in the markets to help you get the best entries. Setting up trades after the market closes or during quiet hours is one effective way to be proactive and help improve your entry. You will not second-guess yourself as compared to being a reactive trader because you are prepared. The reactive trader, as the name suggests, reacts to the constant ebb and flow of market prices, always working in "the now." More often than not, reactive traders will end up jumping into momentum plays that will reverse on them, leaving this type of trader frustrated and confused.
Use Limit Orders to improve trade entry.
When using a limit order, you place a limit on how much you're willing to pay to buy or sell a specific product. Limit orders allow traders to enter the market at the best possible price. For example, if you have a specific setup with a good entry level that the market may reach, you can place a limit order at that specific price to buy or sell. Limit orders are very helpful in giving traders the patience and discipline to wait for their entry prices instead of spontaneously entering the market at random levels that will most likely stop them out.
The main disadvantage of a limit order is that there are no guarantees that the order will actually go through. The product price must meet the limit order specifications to execute properly; however, even with this disadvantage, it is still better to have better control by entering at a price you want instead of entering at a price you are not comfortable with.
Support and Resistance levels.
Support and Resistance levels are in the markets for a reason, and you should use them to help with your entries. One of the worst things you could do is think the market is going up and end up buying it at a resistance level before it heads down to stop you out, only for it to go back up again.
Always look at your charts, and get into the habit of looking to the left. Why? Because looking to the left will give you information on historical price movements, and with those movements, you will see consistent areas where the market bounced off (Support) and consistent areas where the market pulled back (Resistance). When you really understand this and grasp how support and resistance levels work, you will instinctively understand these levels and will actually notice the market moving towards them to test them. So the next time you think the market is going up, try to enter near or at a support level, and if you think the market is going down, try to enter near or at a resistance level.
The image above shows support and resistance levels in the market. Can you notice how the market is always drawn to these levels? You can see the numerous times the market has traded around these areas. These areas are often good entry points for your trades, and you should always take the time to look at your charts for these levels.
Use additional timeframes.
Using one or more additional timeframes to double-check a trend can help improve your entries.
For example, if you’re using a four-hour chart as your main timeframe to look for opportunities on a specific product and you spot a pullback from a bull run that has the potential of a big reversal, you could confirm the broader move by taking a look at a daily chart to confirm how long the trend has lasted or identify some support and resistance levels in its wider trend. Alternatively, you could hop over to an hourly chart or 30-minute chart and see what is happening on a smaller timeframe.
By doing this, you can also check whether buyers or sellers are in charge during the current trading period.
What you want to avoid doing, though, is adding too many different charts to your analysis and moving between them at random to find opportunities. Instead, stick to a ‘base chart’ that you use to trade, with one or two others for confirming moves.
As you can see in the image above, there are three charts. On the main time frame, a potential reversal signal was spotted, and there may be a possible pullback to the bull run. By looking at both the longer time frame and the shorter time frame to help support the analysis, this will help improve your entry because, for example, if all timeframes clash with each other or show conflicting signals, this may help the trader second guess their original analysis and may decide to wait for clearer confirmation signs on all time frames before deciding to enter the market.
The goal of every trader is to be successful in achieving consistent profits, and entries play a big part in this. You can correctly call the market and still lose money due to bad entries. The more you understand key market levels and have the discipline to wait and trade around them, the more probability you will have of trades going your way. Though it is still possible to lose trades on good entries, trading is a probabilistic outcome with no guarantees, so why would you want to enter at a bad entry price to give yourself a disadvantage in the markets before the trade has even started?
Trade safely and responsibly.
BluetonaFX

Learn the Long History of Forex!
💶The history of the foreign exchange market (forex) dates back centuries, with evidence of currency exchange dating back to ancient civilizations. Here is a brief overview of the ancient history of forex:
• Ancient Mesopotamia: The Mesopotamians, who lived in present-day Iraq, are believed to have been the first civilization to use a form of currency. They used clay tablets to record transactions of goods and services, and it is believed that they also engaged in foreign exchange transactions.
• Ancient Egypt: The ancient Egyptians used a bartering system to trade goods and services, but they also used a form of currency in the form of metal rings. Foreign exchange transactions likely occurred between ancient Egyptian traders and merchants from other civilizations.
• Ancient China: The Chinese began using metal coins as a form of currency as early as the 7th century BC. They also engaged in foreign exchange transactions with merchants from other civilizations, such as the Greeks and Romans.
• Ancient Greece: The ancient Greeks used a bartering system to trade goods and services, but they also minted coins made of precious metals. Foreign exchange transactions likely occurred between ancient Greek traders and merchants from other civilizations.
• Ancient Rome: The ancient Romans minted coins made of precious metals, which were used as a form of currency. They also engaged in foreign exchange transactions with merchants from other civilizations.
💴It's worth noting that these ancient foreign exchange transactions were likely not as frequent and organized as they are today, and were conducted primarily through bartering or physical money exchange. The invention of paper money and the rise of banks in the Middle Ages led to the development of more organized foreign exchange markets.
💵And Here is the overview of modern history of forex:
• The modern foreign exchange market began to take shape in the 1970s, after the collapse of the Bretton Woods system, which had pegged the value of currencies to the price of gold.
• Prior to the 1970s, currency trading was primarily conducted by governments and large institutions, but with the emergence of floating exchange rates, the market became more accessible to smaller investors and traders.
• In the 1980s, electronic trading began to take hold, with the introduction of new technologies such as the Reuters Dealing 2000-2 system, which allowed traders to conduct transactions electronically. This led to a significant increase in the size and liquidity of the forex market.
• The 1990s saw the continued growth of the forex market, with the introduction of new technologies such as the internet, which made it possible for individuals to trade forex online.
• In the 2000s, the forex market saw a surge in popularity as a growing number of retail traders and investors entered the market. The introduction of online trading platforms and the ability to trade on margin further increased the market's accessibility.
💰Today, the forex market is the largest and most liquid financial market in the world, with a daily turnover of over $6 trillion. It's accessible to a wide range of participants, from large banks and institutional investors to small retail traders. The forex market operates 24 hours a day, five days a week, allowing traders to participate at any time.
❤️Please, support our work with like & comment!❤️
What do you want to learn in the next post?

What exactly is FOMC? What is FOMC, and what does it do?
FOMC stands for Federal Open Market Committee. It's a group of people who work for the US government and makes decisions about the country's money. They decide how much money should be in circulation and how much it should cost to borrow money.
How does FOMC affect the forex market?
FOMC's decisions can affect the forex market because they can change the value of the US dollar compared to other currencies. For example, suppose FOMC raises interest rates. In that case, it can make the US dollar more attractive than other currencies, increasing the exchange rate. If they lower interest rates, it can make the US dollar less attractive, which can decrease the exchange rate.
What is the FOMC statement, and why is it essential for the forex market?
The FOMC statement is a document that FOMC releases after each meeting. It explains what the FOMC members talked about and what they decided to do with interest rates and the economy. This statement is essential for the forex market because it helps investors and traders decide what to do with their money. They might buy or sell different currencies based on the FOMC statement.
How does FOMC affect currency exchange rates?
FOMC can affect currency exchange rates by changing the value of the US dollar compared to other currencies. If FOMC raises interest rates, it can make the US dollar more attractive than other currencies, increasing the exchange rate. If they lower interest rates, it can make the US dollar less attractive, which can decrease the exchange rate.
Why do traders pay attention to FOMC meetings?
Traders pay attention to FOMC meetings and the FOMC statement because it can give them an idea of what might happen to the US dollar and other currencies. They might make trades based on what they think will happen after the FOMC meeting. For example, if they believe the FOMC will raise interest rates, they might buy US dollars because they think the exchange rate will increase.
NOT FINANCIAL ADVICE DISCLAIMER
The trading related ideas posted by OlympusLabs are for educational and informational purposes only and should not be considered as financial advice. Trading in financial markets involves a high degree of risk, and individuals should carefully consider their investment objectives, financial situation, and risk tolerance before making any trading decisions based on our ideas.
We are not a licensed financial advisor or professional, and the information we are providing is based on our personal experience and research. We make no guarantees or promises regarding the accuracy, completeness, or reliability of the information provided, and users should do their own research and analysis before making any trades.
Users should be aware that trading involves significant risk, and there is no guarantee of profit. Any trading strategy may result in losses, and individuals should be prepared to accept those risks.
OlympusLabs and its affiliates are not responsible for any losses or damages that may result from the use of our trading related ideas or the information provided on our platform. Users should seek the advice of a licensed financial advisor or professional if they have any doubts or concerns about their investment strategies.

Mastering the Art of Technical Analysis (Part 6)Advantages of Technical Analysis
- Easy to Use: Technical analysis is easy to use and understand, making it accessible to traders of all levels of experience.
- Objective: Technical analysis is objective, as it relies on data and mathematical calculations rather than subjective opinions.
- Helps Identify Trends: Technical analysis helps traders identify trends, which can be used to make informed trading decisions.
- Provides Entry and Exit Points: Technical analysis can help traders determine entry and exit points for trades, allowing them to make profitable trades.
- Can be Used with Any Asset Class: Technical analysis can be used with any asset class, including stocks, commodities, and forex.
Disadvantages of Technical Analysis
- Past Performance Doesn't Guarantee Future Results: While technical analysis is based on historical data, it does not guarantee future results.
- Can be Subjective: Technical analysis can be subjective, as traders may interpret the same data differently.
- Not Suitable for All Market Conditions: Technical analysis may not be suitable for all market conditions, as some markets may be too volatile or have limited historical data.
- Overreliance on Indicators: Some traders may over rely on technical indicators, which can lead to false signals and poor trading decisions.
- Requires Constant Monitoring: Technical analysis requires constant monitoring of market data and indicators, which can be time-consuming.
Mastering the Art of Technical Analysis (Part 5)How to Use Technical Analysis for Trading
Technical analysis is a popular tool used by traders to analyze market trends and make informed trading decisions. It involves analyzing past market data, such as price and volume, to identify patterns and trends that can be used to predict future price movements. Here are some key ways to use technical analysis for trading:
Identifying trading opportunities using technical analysis
Technical analysis can be used to identify potential trading opportunities by analyzing market trends and patterns. Traders can use charts and technical indicators to identify trends and patterns, such as support and resistance levels, trendlines, and chart patterns. By identifying these patterns, traders can make informed trading decisions and take advantage of potential opportunities.
Setting up trading strategies using technical indicators
Technical indicators are tools that traders use to analyze market data and identify potential trading opportunities. These indicators can be used to generate signals for entry and exit points, as well as to identify trends and patterns. Common technical indicators include moving averages, oscillators, and trend indicators. Traders can use these indicators to set up trading strategies and make informed decisions about when to enter or exit a trade.
Understanding risk management and position sizing using technical analysis
Risk management is an important aspect of trading and involves managing potential losses and minimizing risk. Technical analysis can be used to help traders manage risk by identifying potential support and resistance levels, as well as by providing signals for stop-loss orders. Position sizing is another important aspect of risk management, which involves determining the appropriate size of a trade based on a trader's account size and risk tolerance. Technical analysis can be used to help traders determine appropriate position sizes based on market trends and patterns.
Combining technical analysis with other trading techniques
While technical analysis can be a powerful tool for trading, it is important to combine it with other trading techniques, such as fundamental analysis and market news. Fundamental analysis involves analyzing economic and financial data to determine the intrinsic value of an asset, while market news involves analyzing current events and news that may affect the market. By combining these techniques, traders can gain a more comprehensive understanding of the market and make informed trading decisions.
However, it is important to remember that technical analysis is not foolproof and should be used in conjunction with other forms of analysis and market news.
Additionally, traders should always practice proper risk management techniques to minimize potential losses.

Mastering the Art of Technical Analysis (Part 4)Candlestick Patterns
Candlestick charts are a popular type of chart used by traders to analyze price movements. They display the opening and closing prices, as well as the highs and lows, of an asset over a specific time period. Candlestick patterns are formed by the arrangement of multiple candlesticks and can provide insights into market trends and potential price movements.
Doji
A Doji is a candlestick pattern that has the same opening and closing price, or a very small difference between the two. This pattern often indicates indecision in the market and can be a signal for a potential trend reversal.
Hammer
A Hammer is a bullish reversal pattern that forms after a downward trend. It is characterized by a long lower shadow and a small body, and it indicates that buyers have gained control and are pushing the price up.
Shooting Star
A Shooting Star is a bearish reversal pattern that forms after an upward trend. It is characterized by a long upper shadow and a small body, and it indicates that sellers have gained control and are pushing the price down.
Engulfing
An Engulfing pattern is a reversal pattern that is formed by two candlesticks. The first candlestick is smaller and the second candlestick completely engulfs the first one. A bullish Engulfing pattern forms at the end of a downtrend and indicates a potential trend reversal. A bearish Engulfing pattern forms at the end of an uptrend and indicates a potential trend reversal.
Harami
A Harami pattern is a reversal pattern that is formed by two candlesticks. The first candlestick is larger and the second candlestick is smaller and is completely engulfed by the first candlestick. A bullish Harami pattern forms at the end of a downtrend and indicates a potential trend reversal. A bearish Harami pattern forms at the end of an uptrend and indicates a potential trend reversal.
Candlestick patterns are an important tool for technical analysis and can provide insights into market trends and potential price movements. By understanding the key principles of each candlestick pattern, traders can gain insights into market trends and make informed trading decisions. However, it is important to note that candlestick patterns are not foolproof and should be used in conjunction with other forms of analysis, such as fundamental analysis and market news.

Mastering the Art of Technical Analysis (Part 3)Technical indicators are mathematical calculations that are applied to price and volume data to identify potential trading opportunities. They are based on the belief that certain patterns or trends in price and volume data can provide insights into market trends and potential price movements. Technical indicators can be used to confirm trends, identify potential entry and exit points for trades, and to provide signals for when to buy or sell.
Moving Averages
Moving averages are one of the most common technical indicators used by traders. They are used to smooth out the price data and provide a clearer picture of the overall trend. Moving averages can be calculated using different time periods, such as 50-day moving average or a 200-day moving average. A crossover between a shorter-term moving average and a longer-term moving average is often used as a signal for when to buy or sell.
Relative Strength Index (RSI)
The Relative Strength Index (RSI) is a momentum oscillator that measures the speed and change of price movements. The RSI ranges from 0 to 100, with readings above 70 considered overbought and readings below 30 considered oversold. Traders often use the RSI to identify potential trend reversals or to confirm trends.
Bollinger Bands
Bollinger Bands are a technical indicator that is used to measure volatility. They consist of three lines - a simple moving average (SMA) in the middle, and two outer bands that are two standard deviations away from the SMA. The outer bands represent the upper and lower price ranges, and the width of the bands changes based on the volatility of the asset. Traders often use Bollinger Bands to identify potential entry and exit points for trades.
Moving Average Convergence Divergence (MACD)
The Moving Average Convergence Divergence (MACD) is a trend-following momentum indicator that uses two moving averages of different lengths to identify potential entry and exit points for trades. The MACD line is calculated by subtracting the 26-day exponential moving average (EMA) from the 12-day EMA. A signal line, which is a 9-day EMA, is then plotted on top of the MACD line. Traders often use the MACD to identify potential trend reversals or to confirm trends.
Fibonacci Retracement
The Fibonacci retracement is a technical indicator that is used to identify potential support and resistance levels based on the Fibonacci sequence. The Fibonacci sequence is a mathematical sequence of numbers, in which each number is the sum of the two preceding numbers. The retracement levels are calculated based on the high and low points of a particular price movement, and they are used to identify potential entry and exit points for trades.

Mastering the Art of Technical Analysis (Part 2)Understanding the Basics of Technical Analysis
Technical analysis is a method of analyzing financial markets that relies on studying past market data to identify patterns and make predictions about future price movements. The aim is to identify opportunities to buy low and sell high or vice versa.
What is technical analysis and why is it important for traders?
Technical analysis is the study of market data, primarily price and volume data, to identify patterns that can be used to make informed trading decisions. It is important for traders because it provides a way to interpret market trends and identify potential entry and exit points for trades.
Unlike fundamental analysis, which focuses on the underlying economic factors that influence a security's value, technical analysis relies solely on the price and volume data of a security. This means that technical analysis can be used on any asset class that has a price chart available, including stocks, bonds, currencies, and commodities.
Technical analysis can be used for short-term trading or long-term investing. For short-term traders, technical analysis can help identify potential entry and exit points for trades based on the movement of price and volume data. For long-term investors, technical analysis can help identify the overall trend of a market or a specific asset class.
The key principles of technical analysis: price action, trends, and support and resistance levels.
The key principles of technical analysis are price action, trends, and support and resistance levels.
Price action refers to the movement of an asset's price over time, and it is the primary focus of technical analysis. Price action can be analyzed using different types of charts, including line, bar, and candlestick charts.
Trends refer to the direction of price movement, and they can be classified as uptrends, downtrends, or sideways trends. Identifying the trend of a market or a specific asset is an essential part of technical analysis, as it helps traders understand the overall direction of price movement.
Support and resistance levels are points on a chart where the price has historically tended to stop moving or reverse direction. Support levels are areas where buyers tend to enter the market, as they believe the price is low enough to represent good value. Resistance levels are areas where sellers tend to enter the market, as they believe the price is high enough to represent good value.
Different types of charts: line, bar, and candlestick charts.
Different types of charts are used in technical analysis, including line, bar, and candlestick charts.
A line chart connects the closing prices of an asset over a period of time with a line, providing a simple view of the overall trend. Line charts are useful for identifying the direction of the trend but do not provide much detail about the price movement within a specific period.
A bar chart shows the opening and closing prices of an asset, as well as the high and low prices during a particular period. Each bar represents a specific time period, such as a day or an hour. Bar charts provide more detailed information about price movements than line charts, as they show the price range for each period.
Candlestick charts display the same information as bar charts, but they use a visual representation of candles to convey price movements. Each candle represents a specific time period, and the color of the candle represents whether the price closed higher or lower than it opened. Candlestick charts provide a more detailed view of price movements than bar charts and are widely used by traders.

Mastering the Art of Technical Analysis (Part 1)Technical analysis is an essential tool for traders to analyze market movements and make informed trading decisions. Whether you are a beginner or an experienced trader, mastering technical analysis can greatly improve your trading performance.
We will explore the basics of technical analysis, the different types of charts and indicators, and how to use them effectively.
Understanding the Basics of Technical Analysis
- What is technical analysis and why is it important for traders?
- The key principles of technical analysis: price action, trends, and support and resistance levels.
- Different types of charts: line, bar, and candlestick charts.
Types of Technical Indicators
- Moving averages: Simple Moving Average (SMA) and Exponential Moving Average (EMA).
- Oscillators: Relative Strength Index (RSI), Stochastic Oscillator, and Moving Average Convergence Divergence (MACD).
- Volume Indicators: On-Balance Volume (OBV) and Chaikin Money Flow (CMF).
- Fibonacci Retracement and Extension Levels.
How to Use Technical Analysis for Trading
- Identifying trading opportunities using technical analysis.
- Setting up trading strategies using technical indicators.
- Understanding risk management and position sizing using technical analysis.
- Combining technical analysis with other trading techniques.
Technical analysis is a valuable tool that traders can use to make informed trading decisions. By understanding the basics of technical analysis and using it effectively, traders can increase their chances of success in the markets.

Understand the difference between BOS and CHoCHIn this diagram we aim to help you understand the difference between BOS and CHoCH. Pay careful attention to the annotations made on the chart.
Happy Trading
Team Lamda

How to Identify A Valid Orderblock?Pay close attention to the last buying candle before the sell and notice the imbalance afterwards. This can confirm whether the order block is valid or not.
Happy Trading!
-Team Lamda

Celebrating 50 Years of Financial FuturesThis is a Thanksgiving Special Report.
Swiss Franc ( CME:6S1! ), Canadian Dollar ( CME:6C1! ), Japanese Yen ( CME:6J1! ), British Pound ( CME:6B1! ), Mexican Peso ( CME:6M1! )
In May 1972, International Monetary Market (IMM), a division of the Chicago Mercantile Exchange (CME), launched futures contracts on seven currency pairs. This was the world’s first financial futures instrument, a futures contract based on something other than physical commodities.
What has made a Midwestern Exchange, known mainly for its Pork Bellies contract, a frontrunner in financial innovation?
Bretton Woods System and its Collapse
At the end of World War II, the United States and its allies created the Bretton Woods System. Essentially, it was a global monetary system governed by fixed currency exchange rates. The US dollar was backed by gold, at a fixed rate of $35 per troy ounce. Other currencies were pegged to the U.S. dollar. In 1955, one dollar was exchanged for 0.3572 British Pound, 4.2 Deutsch Mark, 3.3 France Franc, 0.986 Canadian Dollar, 360 Japanese Yen, 625 Italy Lire, etc.
Each country was responsible for maintaining its exchange rate within 1% of the adopted par value by buying or selling foreign reserves when necessary. The U.S. was responsible for maintaining the gold parity. Its big commitment was allowing anyone with $35 to exchange for an ounce of gold at the US Treasury window.
As global inflation rose sharply in the 1970s, many countries could not maintain the official peg. They responded by redeeming dollars for gold at the US Treasury window.
With US gold reserve depleting rapidly and a gold run looming, in August 1971, President Richard Nixon announced the "temporary" suspension of the dollar's convertibility into gold. This marked the breakdown of the Bretton Woods. Central banks around the world were no longer obligated to peg their exchange rates to the US dollar.
Leo Melamed and Milton Friedman
With fixed rates, there was no exchange rate risk in international trade. However, flowing rate exposes importers and exporters to significant uncertainty to the amount of dollar or foreign currency they will receive or are obliged to pay for.
Since its founding in 1898, CME has been the place where producers, processors, merchants, and commercial users come together to hedge price risks for a wide range of commodities. Leo Melamed, then Chairman of the CME, was convinced that the futures market is the solution to tackle the rise in exchange rate volatility.
Leo set up an International Monetary Market division within the CME and prepared for new futures contracts derived from foreign exchange rates. Initially, this breakthrough idea found no friends on Wall Street. According to Leo, one investment bank president tossed it out saying he didn’t want the Chicago “Pork Belly Shooters” to contaminate the FX market.
Leo met with Milton Friedman, a well-respected economics professor at the University of Chicago. Milton fully supported the ingenious design and published a feasibility study, “The Need for Futures Markets in Currencies” in 1971.
Milton Friedman (1912-2006) won the Nobel Prize in Economic Science “for his research on consumption analysis, monetary history and theory and the complexity of stabilization policy” (the Nobel Committee).
This changed everything. When Leo went to Washington to lobby the idea of listing foreign exchange futures, Treasury Secretary George Shultz said, “If it’s good enough for Milton, it is good enough for me.”
George Shultz (1920-2021) served as Secretary of State in the Regan Administration and as Treasury and Labor Secretary under Richard Nixon. He was also the Dean of Graduate School at the University of Chicago, and a good friend with Milton Friedman.
If you are interested in the story of FX futures, you may find it online and at Leo’s 1996 memoirs, “Escape to the Futures”.
Foreign Exchange Futures
On May 16, 1972, IMM simultaneously launched seven futures contracts based on the US dollar exchange rates to British Pound ( CME:6B1! ), Japanese Yen ( CME:6J1! ), Canadian Dollar ( CME:6C1! ), Swiss Franc ( CME:6S1! ), Mexican Peso ( CME:6M1! ), Deutsch Mark and Italy Lira.
Five of those original FX contracts are still actively trading at the CME. Deutsch Mark and the Lira have been delisted since Germany and Italy joined the Euro currency. The new contract, Euro/USD FX ( CME:6E1! ), becomes the most active CME FX future contract.
FX contracts saw exponential growth in trading volume in the next fifty years. In the first 9 months of 2022, average daily volume for all FX futures and options reached 983,000 lots, according to the CME Group. On November 15th, Euro FX alone traded 359,000 lots and had an open interest of 683,293 contracts.
My writings on TradingView include a number of trade ideas on FX futures contracts. Please take a look if you haven't yet.
FX Futures were the start of a “Financial Revolution” in the futures industry. The next few years saw new breeds of futures contracts, including interest rate futures between 1975 and1977 and equity index futures in 1982.
During the holiday season, I would start a series on the leaders and innovators at CME, CBOT and KCBT. They brought GNMA Futures, T-Bill and T-Bond Futures, Eurodollar Futures, Value-Line Index Futures and S&P 500 Futures to life and revolutionize the financial derivatives world as we know it today.
Happy Trading.
Disclaimers
*Trade ideas cited above are for illustration only, as an integral part of a case study to demonstrate the fundamental concepts in risk management under the market scenarios being discussed. They shall not be construed as investment recommendations or advice. Nor are they used to promote any specific products, or services.
CME Real-time Market Data help identify trade set-ups and express my market views. If you have futures in your trading portfolio, check out on CME Group data plans in TradingView that suit your trading needs www.tradingview.com

The USD 'smile' model - explaining the USD rallyWhen we think of the USD, and what drives capital, the USD ‘smile’ theory is an interesting and logical model to conceptualise the fundamental drivers of price action.
The basic principle is we can think more strategically about the regime that drives the USD, and this has consequences for price, and by extension commodities and other second-order derivatives of the USD.
• Left-hand side – the focus here is risk aversion across broad financial markets – this could be driven by several factors, including an increased recession risk and geopolitics – but increased market stress and the USD will typically attract buyers. Conversely, a risk rally will see capital flow out of the USD
• Right-hand side – the US exceptionalism story – in some capacity the idea of TINA rings true here – that being, ‘There is No Alternative - where investors see the US as having the most resilient economy and considered to be the most attractive investment destination
• The middle section sets a focus on a regime of synchronized global growth/contraction – essentially in a synchronized global growth upturn, perhaps with rising liquidity, we typically see bearish trends in the USD and clear outperformance in cyclical currencies, such as the AUD, NZD, and NOK
USD drivers into October ‘22
As we see on the daily, the USD rallied throughout 2022 peaking in September and October, with both the left- and right-hand sides of the ‘Smile’ working concurrently for the USD. This is a rarity, but can be a potent force, especially given this time around we went through a regime shift from zero interest rates and QE to rapid rate hikes.
A deeper dive as to the left-hand drivers, we saw fears of a global slowdown and economic contraction driving capital into the safety of the USD – Looking at correlation analysis, we see the USD has been unequivocally negatively correlated with the S&P500, providing a strong and unrivalled hedge against equity drawdown – the fact that cash-like assets (I’ve used 1-month swaps) in the US pay some of the highest rates meant traders achieved compelling levels of ‘carry’ or income – in effect, funds are still paid to play defence.
On the right-hand side, fears of a deeper economic contraction in China, Europe, and the UK, certainly on a relative basis, again saw the USD outperform. We can also see that while inflation rose aggressively in most DM countries, we also seen dovish pivots from the BoE, ECB, and RBA, and yet the Fed have kept a consistent tone – well, at least Jay Powell has.
A USD decline
After the US CPI report (10 Nov) we saw the USD take a dive, stopping just shy of the 200-day MA – on one hand, the right side of the ‘Smile’ becoming less USD positive – where rate hikes were priced out and the terminal expectation of the fed funds rate fell to 4.87% (from north of 5%).
We can also see the mid-part of the ‘Smile’ worked against the USD - We saw China looking less bad, with its plans to allow property developers easier access to capital, amid a multi-step guide to unwind its Covid zero policy, presumably after the ‘Two Sessions’ sitting in March 2023.
There has been a less bad feel towards Europe, with EU Nat Gas prices falling from €342 to €100 – EU data, more broadly, held up and Italian BTP spreads were contained vs German bunds.
A USD turn – but can it last?
Since the lows in the USD (I’ve used the USD index / USDX as my proxy) on 15 Nov we’ve seen a reasonable counter-rally back above 107 – the technicians will argue the USD was oversold and due a bounce anyhow. However, if we think about the news flow and how it relates to the ‘smile’ theory, we’ve seen the emergence of increased uncertainty on China’s Covid plans – Korean 20-day exports fell 16.7%, while Taiwanese exports fell 6.3% YoY. Crude and copper have shown us the way, but traders are expressing a view of a global growth slowdown, which of course favours USD strength.
The news flows may change as we head into what will be a big December by way of event risk– bad US data will impact the right-hand side of the smile and weaken the USD, especially if the US labour market shows real signs of cooling and core CPI undershoots again. Should US data hold up, but Chinese and EU data deteriorates, well that’s USD positive, especially if we see an equity drawdown.
I’ve not seen a momentum USD buy signal on the longer-time frames yet – however, with terminal fed funds pricing above 5%, which we consider that to be fair, it feels like global growth is probably the factor that will drive the USD into year-end. The smile could be a good guide to think about the USD direction.

Terminal rates - How FX traders can benefit on TradingViewOne of the more watched interest rate settings in markets is the so-called ‘terminal’ interest rate – the point in the interest rate futures curve that reflects the highest point of future rate expectations – said differently, where the market feels a central bank could take its key policy rate by a specific date.
For those who really want to understand fed funds futures far better, this research piece from the St. Louis Fed is good - files.stlouisfed.org
As an FX trader, I am not too concerned as to the exact pricing in the rates market, a basis point here or there is no great issue - I loosely want to know what is priced by way of future expectations. This lends itself to more fundamental, tactical or thematic trading strategies and obviously day traders won’t pay too close attention, although, it’s worth considering that when rates are on the move you do see higher intraday volatility and that is a factor they have to operate in – where one of the core considerations for any day trader is ‘environment recognition’ and the assessment of whether we’re seeing in a trending or mean reversion (convergence) day.
We also see terminal pricing correlated with FX and equity markets – certain if we look at the relationship between fed funds futures April contract and USDJPY we can see the correlation.
Some will just use the US 2-year Treasury, as this is the point on the US Treasury curve that is most sensitive to rate pricing. The good thing about the fed fund's future though is we can see quantitatively the degree of rate hikes being priced for a set date.
Using the logic expressed in the St Louis Fed research piece we can see that the market sees the highest level where the Fed hike rates is March – subsequently, this is priced off the April contract, and currently, this sits at 4.90%.
Using 4.9% as our yardstick, interest rate traders would make a call if the expected fed funds effective rate was either priced too high, or indeed too low and could push above 5% - if new economic data emerged that suggested the Fed needed to go even harder on hiking than what is priced, and the terminal rate moves above 5% then the USD will find a new leg higher. Conversely, if the market started to trade this down to say 4.70% to 4.5% then the USD will find sellers – and notably USDJPY is the cleanest expression of interest rate differentials.
For TradingView users we can use this code in the finder box - (100-ZQJ2023). I put these codes into a watchlist and add a section' for heightened display. Again, this tells me where the peak pricing/expectations are in the interest rate curve. You can see the corresponding codes needed for each contract.
Terminal rates matter – if we're to see this trending lower, most likely in 2023, then it may be one of the clear release valves the equity market needs – for those looking for the Fed to pivot – the terminal rate will be one way to visualise it

GBPUSD London Open trading with simple M & W pattern only GBPUSD London Open trading with simple M & W pattern only
Hello, Welcome to today's 1H session, I look forward to post every day my progress testing this system out.. Trading 1H everyday with just 1H pattern signal.
Result so far!
1st week- 5% drawdown (5 loss)
2nd week- 2% drawdown (1win (3r))

S&P 500 A study of Market Cycles: Will History Repeat Itself?This video is a study of the history of The stock market when it comes to bull cycles and consolidation/ranging periods, which I think is a very educational thing to investigate in a period of market correction like the one we are currently living in. Please also refer to the Important Risk Notice.

Market Trading AffirmationsAn Affirmation Is Defined As An Assertion That Something Exists Or Is True. An Affirmation Is Designed To Help Remind You And Encourage You That Something Must Be Done And It Must Be Adhered To
As The Saying Goes... As A Trader “You Cannot Change The Markets... You can Only Change Your Response To What They Do.”
Trading Affirmations Are Very Important And Very Much Needed Whenever You Attempting To Trade The Markets
• Pre-Trade Affirmation #16- I Believe In My Trading Edge And My Trading Strategy Completely And Wholeheartedly. And I Am And Will Act Upon It Without Any Fears – Any Doubts – Any Worries And Most Of All Any Hesitations
• Pre-Trade Affirmation #17- I Am Able To Easily Relax Myself As I Wish At Any Given Time. I Need To Harness And Use This Ability To Help Conserve My Energy, Because When It Comes To Trading I Need To Save My Strength
• Pre-Trade Affirmation #18- I Will Pre-Define And Pre-Determine My Risk On Each And Every Trade That I Place. I Will Completely And Positively Accept That Risk. And I Am Able To Completely Let Go Of That Trade Once It Is Active
• Pre-Trade Affirmation #19- I Will Make All Of My Trading Decision And Contemplate And Formulate All Of My Trading Ideas Prior To The Market Open. I Will Execute Trades When There Is Only A Price Action Signal / Setup Present
• Pre-Trade Affirmation #20- I Have To And Need To Carefully Manage And Measure My Trading Progress Towards My Desired Trading Results Each And Every Day. It Is Crucial That I Learn To Manage Myself And My Emotions Accordingly
• Pre-Trade Affirmation #21- I Need To Trade According To What The Market Is Doing And How It Is Behaving. I Cannot Trade The Markets On What I Think It Should Be Doing. As The Saying Goes “Trade What You See… And Not What You Think”
• Pre-Trade Affirmation #22- I Will Only Take / Place Trades When I See My Trading Edge Present Within The Markets. I Will Only Place Trades Or Consider Trading Only When I See My Trading Strategy Present Within The Market And Only Trade When There Is A PRICE ACTION SIGNAL / PRICE ACTION SETUP Present And Visible Within In The Market.
Pre-Trade Affirmations are very important.
You would never want to start your day much less your Trading Day without your Pre-Trade Affirmations.
They are very important and a very crucial part of your Trading. (You Should Always Read These Each And Every Day Before You Trade)

Market Trading AffirmationsAn Affirmation Is Defined As An Assertion That Something Exists Or Is True. An Affirmation Is Designed To Help Remind You And Encourage You That Something Must Be Done And It Must Be Adhered To
As The Saying Goes... As A Trader “You Cannot Change The Markets... You can Only Change Your Response To What They Do.”
Trading Affirmations Are Very Important And Very Much Needed Whenever You Attempting To Trade The Markets
• Pre-Trade Affirmation #1- I Am A Successful And Profitable Trader
• Pre-Trade Affirmation #2- I Objectively Define My Edge Within The Market
• Pre-Trade Affirmation #3- I Am Going To Spend My Time Wisely And Meaningfully
• Pre-Trade Affirmation #4- I Am Positive And I Will Pour Happiness Into All That I Am Doing
• Pre-Trade Affirmation #5- I Understand That Consistency Is More Important That Being Right
• Pre-Trade Affirmation #6- I Will Constantly Reward Myself As The Market Makes Profit For Me
• Pre-Trade Affirmation #7- I Am Patient And Let Trading Opportunities Present Themselves To Me
• Pre-Trade Affirmation #8- I Love Myself Enough To Allow Me To Experience The Success Of Trading
• Pre-Trade Affirmation #9- I Am Absolutely Clear About The Specific Results That I Want And Need In Trading
• Pre-Trade Affirmation #10- I Make Money In The Markets And This Is An Affirmation Of My Self-Mastery – Self- Learning And Professionalism
Pre-Trade Affirmations are very important.
You would never want to start your day much less your Trading Day without your Pre-Trade Affirmations.
They are very important and a very crucial part of your Trading. (You Should Always Read These Each And Every Day Before You Trade)
