How Smart Money Moves Gold (XAUUSD)🟡 Gold never moves randomly — it moves with intention.
Every spike, every fake breakout, every sharp reversal… it’s all part of a bigger plan by smart money (institutions) to trap emotional traders and collect liquidity.
Let’s break it down 👇
⚡ 1️⃣ Liquidity Grab (The Trap Phase)
Before any real move, gold sweeps stop-losses above highs or below lows.
Retail traders think it’s a breakout — but it’s actually a liquidity hunt.
Smart money fills large positions here while emotions run high.
⚡ 2️⃣ Market Structure Shift (The Clue)
After collecting liquidity, watch for a BOS (Break of Structure) or CHoCH (Change of Character) — these reveal when the real move is starting.
⚡ 3️⃣ Smart Money Entry (The Real Move)
Once the trap is set, gold often makes a strong impulsive push.
This is where institutions enter — and where smart traders follow with confirmation, not emotion.
⚡ 4️⃣ Emotional Traders Lose, Logical Traders Win
The market doesn’t hate you — it simply feeds on emotional reactions.
Be patient, wait for liquidity sweep ➜ structure shift ➜ confirmation entry.
🧭 Pro Tip:
👉 Stop chasing candles.
👉 Study liquidity and market structure.
👉 Let the chart show who’s trapped — and then trade against them.
💬 Remember:
“The market rewards patience, not panic.”
💎 Gold (XAUUSD) moves on liquidity — not luck.
#TradeSmart #ThinkLikeInstitutions #XAUUSD
Liquidity

Why Prices Move Up or Down: Order Flow and Liquidity█ Why Prices Move Up or Down: Understanding Order Flow and Liquidity
Most traders are told that prices rise because “there are more buyers than sellers,” and that prices fall because “there are more sellers than buyers.” But that’s not how markets actually work. In every transaction, there’s always one buyer and one seller; what really matters is which side is more aggressive and how liquidity responds to that aggression.
Price movement is the result of order flow interacting with liquidity. When buyers use market orders and aggressively lift the available sell orders (the ask), the price moves up. When sellers hit the bid with market orders, the price moves down.
In short, price moves in the direction of the side that consumes liquidity.
█ The Engine Behind Price Movement
When buyers and sellers agree on price, the market ranges, there’s a balance. When one side becomes more aggressive, an imbalance occurs, and the price must adjust until new liquidity appears.
Imagine the market like a ladder made of buy and sell orders. Each rung shows where traders are waiting, buyers below the current price, and sellers above it. These waiting orders are what we call liquidity.
When a trader sends a market buy order, they’re not waiting; they want to buy immediately. That order takes the best available sell price (the ask). If more traders keep doing this — buying aggressively — those sell orders get used up faster than new ones appear. As a result, the next available sell price is higher, and the price moves up until new sellers fill the gap.
The same logic applies in reverse: when aggressive market sell orders hit the bids, they consume the buy-side liquidity. Once those bids are gone, the next available buyer is lower, and the price moves down.
This continuous back-and-forth, liquidity being consumed, replaced, or withdrawn, is the real engine of every price movement.
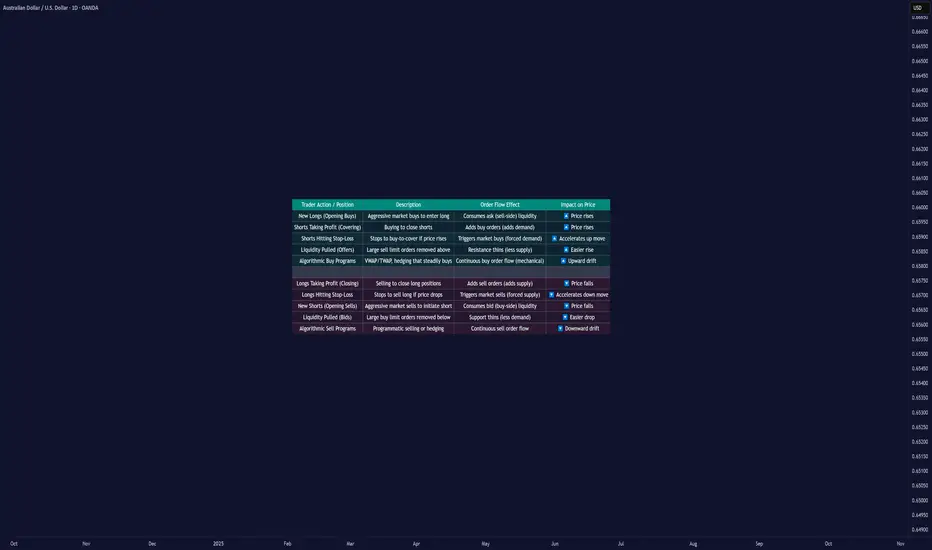
█ Why Prices Move Up
1. Aggressive Buying (New Longs)
When new participants enter with market buys, they lift the offers, consuming sell-side liquidity. If this continues, the price climbs until enough new sellers appear to absorb demand. This is the cleanest form of demand-driven uptrend, with new buyers initiating positions.
2. Short Covering
The price moves higher as short sellers buy back positions. This can happen when stops are triggered after a price rise or when shorts take profits after a decline. In both cases, their buying adds upward pressure. When many cover at once, the move can accelerate into a short squeeze — higher prices trigger stops, which trigger even more buy orders, creating a self-reinforcing rally.
Profit Taking Phase
Short Squeeze Phase
3. Stop-Loss Triggers
Clusters of stop-loss orders above previous highs act as “fuel.” When price breaks those levels, automatic buy orders fire off. These aren’t new investors; they’re forced buyers closing shorts. The result is a fast, often exaggerated upward burst.
4. Thin Liquidity and Pulled Offers
Sometimes, price surges not because of huge buying, but because there’s nobody selling. If the sell side of the order book is thin, or if large resting orders get canceled, even small buys can sweep multiple levels. This creates those “air pockets” where price jumps several ticks in seconds.
5. Algorithmic and Institutional Flows
Institutions use automated execution algorithms like VWAP or TWAP to buy steadily throughout the day. These constant flows absorb liquidity over time, creating a slow upward bias. Similarly, option dealers who are short gamma must buy as prices rise to stay hedged, adding even more mechanical buying pressure.
█ Why Prices Move Down
1. Aggressive Selling (New Shorts)
When traders use market sells, they consume buy-side liquidity. If this persists, the price naturally ticks lower as bids disappear, and the next buyer will be willing only at a cheaper level.
2. Long Profit-Taking
At some point, long traders sell to realize profits. These sales add supply, which can cap or reverse an uptrend. It’s not bearish conviction; it’s simply existing longs exiting their positions.
3. Long Stop-Loss Cascades
If prices fall to where many long traders placed stops, those automatic sell orders trigger, creating a chain reaction of forced selling. This is the mirror image of a short squeeze — a long liquidation cascade.
4. Thin Bid Liquidity or Pulled Bids
When buy orders disappear, the market has no floor. Even modest selling pressure can make the price fall through several levels until new bids emerge. This is how “flash drops” occur during low-liquidity periods.
5. Algorithmic and Mechanical Selling
Negative news or risk events can activate automated sell programs, from funds rebalancing to dealers hedging short options exposure. These trades can intensify selling, even without new bearish sentiment.
█ New Positions vs. Exits — The Hidden Difference
Not every up-move means new buyers are coming in, and not every down-move means new shorts.
Some moves happen because existing positions are being closed, not opened. and that distinction matters.
New Positions (Initiative Flow): Create real trends, since they bring new demand or supply.
Position Exits (Reactive Flow): Often short-lived, they relieve pressure rather than add it.
One way to tell the difference is through open interest (in futures or options):
Price up + Open Interest up → new longs entering (sustainable).
Price up + Open Interest down → short covering (temporary).
Price down + Open Interest down → long liquidation (often near exhaustion).
Price down + Open Interest up → new shorts entering (trend formation).
█ The Real Takeaway
Price doesn’t rise because “buyers beat sellers.” It rises because buyers were more aggressive, consuming available sell orders faster than they were replaced. It falls when sellers become more aggressive, taking out the bids.
Both entries and exits can push the price the same way:
New longs and shorts covering both create buy pressure.
New shorts and longs taking profit both create sell pressure.
To truly understand a move, traders must ask:
Who initiated it, new positions or forced exits?
Was liquidity added or withdrawn?
Did open interest confirm new participation or show a squeeze?
Once you start thinking in these terms, price becomes more than a random chart line; it becomes a story of liquidity and intent unfolding in real time.
█ Multiple Forces in Motion
While each example above highlights a single mechanism in isolation, the market rarely moves for one reason alone. In real trading, several of these forces often act simultaneously, new longs entering, shorts covering, stops triggering, algorithms executing, and liquidity thinning.
When multiple flows align in the same direction, the result is acceleration, price moves rapidly as liquidity vanishes, and reactions compound. When opposing forces meet, price can stall, consolidate, or violently whip as both sides compete for control.
In essence, market movement is the sum of overlapping liquidity events, not isolated causes. Understanding how these factors interact in real time is key to reading true intent behind every move.
█ In summary:
Markets move not because of “more buyers” or “more sellers,” but because one side becomes impatient, consumes liquidity, and forces repricing until balance returns.
Understanding who’s moving the market and why — new positioning, forced exits, or vanished liquidity — is the foundation of reading true market intent.
-----------------
Disclaimer
The content provided in my scripts, indicators, ideas, algorithms, and systems is for educational and informational purposes only. It does not constitute financial advice, investment recommendations, or a solicitation to buy or sell any financial instruments. I will not accept liability for any loss or damage, including without limitation any loss of profit, which may arise directly or indirectly from the use of or reliance on such information.
All investments involve risk, and the past performance of a security, industry, sector, market, financial product, trading strategy, backtest, or individual's trading does not guarantee future results or returns. Investors are fully responsible for any investment decisions they make. Such decisions should be based solely on an evaluation of their financial circumstances, investment objectives, risk tolerance, and liquidity needs.
The Market Doesn’t Hate You — It’s Just Doing Its JobEvery trader at some point feels attacked by the market.
You take a trade, it hits your stop loss by one pip… and then runs perfectly in your direction.
You think, “The market is against me.”
But the truth is — the market doesn’t hate you.
It’s simply doing its job: collecting liquidity before moving to its real destination.
💡 Here’s What’s Really Happening
The market is a liquidity machine.
It moves where money is resting — not where traders wish it would go.
When you see price sweeping highs or lows before reversing, that’s not manipulation against you —
it’s Smart Money doing what it’s built to do:
Hunt liquidity
Fill institutional orders
Create displacement before the next move
Your stop loss isn’t being targeted personally —
it’s sitting where millions of other traders’ stops are clustered.
The market simply clears those levels before delivering the real move.
🧠 The Lesson
Stop trading emotionally and start thinking structurally.
Ask yourself before every setup:
Where is liquidity resting?
Has the market collected it yet?
Is structure confirming the new direction?
When you learn to think like Smart Money, you stop blaming the market and start understanding it.
You’ll realize every loss was a lesson pointing you toward better timing, discipline, and patience.
📊 Final Thought
The market is not your enemy — it’s your teacher.
Once you align with how liquidity and structure truly work,
you’ll stop feeling trapped and start trading with clarity and confidence.
💬 Follow for more institutional-based educational posts.
No signals. No hype.
Just pure trading knowledge and Smart Money insights that help you grow.

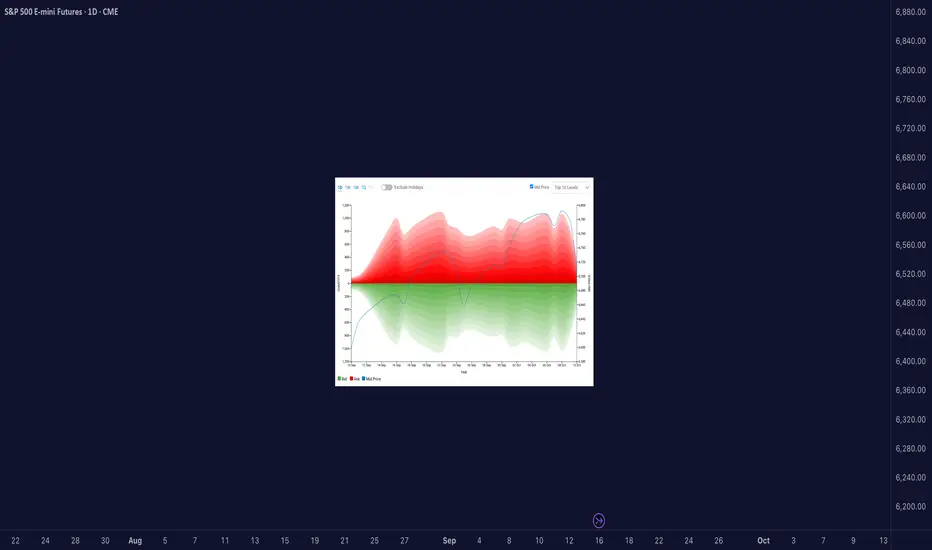
When Liquidity Dried Up — The True Story Behind the Oct 10 Crash█ We Actually Saw It Coming
There were clear signs of potential reversals across major markets before the Friday, October 10, 2025 crash. You can see it in the liquidity heatmaps: Gold, Bitcoin, S&P, and other futures all trading above their top 10 liquidity levels.
When that happens, it’s usually a warning flag. Price is moving into areas with less visible liquidity, meaning fewer resting orders available to absorb aggressive buyers. That’s when the market becomes fragile and doesn’t take much to trigger a sharp reversal.
█ When Price Trades Beyond Visible Liquidity
It’s easy to think big moves happen just because of news, but beneath the surface, microstructure signals often show when markets are already vulnerable.
One of the clearest is when the mid-price extends beyond the visible liquidity, above the top few ask levels or below the top few bid levels in the order book.
Suppose price pushes beyond the visible top levels. In that case, it often means that liquidity was consumed faster than it could replenish, either because aggressive orders cleared it out, or market makers pulled their quotes. That’s when we get what’s called a liquidity vacuum.
Research from the Federal Reserve, Bank for International Settlements, and academic studies (Lo & Hall, 2014; Meldrum & Sokolinskiy, 2025) all point to the same thing:
When order book depth is shallow, markets become more fragile. Prices overreact, spreads widen, and shocks travel faster.
█ What the Heatmap Really Shows
Those heatmaps are a visual snapshot of this structure.
The green and red bands show the depth of buy and sell orders — the liquidity zones.
The blue line is the mid-price — the true current market price.
When the blue line (mid-price) moves above the red zone, it means price has traded beyond the top available asks. That can happen because:
Buyers lifted all nearby sell orders (aggressive buying), or
Sellers pulled liquidity (passive withdrawal).
In both cases, the effect is the same, the book thins out, and volatility risk increases.
Heatmaps don’t show everything though. They don’t reveal:
Hidden or iceberg orders deeper in the book,
Off-exchange liquidity or block trades,
Or how quickly the book replenishes in real time.
But as a visual proxy, they’re incredibly useful for spotting moments when price runs ahead of available liquidity, often right before sharp reversals.
█ Why the Crash Hit So Hard
So while the crash came from unexpected news, the speed of that drop wasn’t random. Markets were already fragile. Liquidity across assets was thin. When the shock hit, there weren’t enough resting orders to slow it down.
Gold, Bitcoin, and S&P futures all had their mid-prices trading above visible liquidity, making them more sensitive to aggressive selling; that’s why the market fell almost simultaneously and so fast.
█ How I Handle These Setups
Whenever I see price trading above visible liquidity, I start managing risk differently. I might keep existing longs, but I won’t add new ones. Instead, I scale out gradually and watch for potential short setups if other signals confirm it.
It’s not about predicting crashes, it’s about recognizing when the market’s structure is fragile.
█ Quick Takeaway
When the mid-price trades above visible liquidity, the order book is telling you something simple but powerful:
“There’s not much support up here.”
That’s often when it pays to get defensive, not aggressive.
Access the CME Liquidity tool at this link
-----------------
Disclaimer
The content provided in my scripts, indicators, ideas, algorithms, and systems is for educational and informational purposes only. It does not constitute financial advice, investment recommendations, or a solicitation to buy or sell any financial instruments. I will not accept liability for any loss or damage, including without limitation any loss of profit, which may arise directly or indirectly from the use of or reliance on such information.
All investments involve risk, and the past performance of a security, industry, sector, market, financial product, trading strategy, backtest, or individual's trading does not guarantee future results or returns. Investors are fully responsible for any investment decisions they make. Such decisions should be based solely on an evaluation of their financial circumstances, investment objectives, risk tolerance, and liquidity needs.
FOMC has cleared liquidity levels around this technical rangeNews Drivers do not overpower technicals, the fundamentally driven movements are just banging around into huge money pending orders. No way around these mechanics.
That what we saw today, and what will continue to happen forever and ever 💎 Not saying it will always be a ricochet like today, but the orders are always there.

Liquidity Voids: Where Price Runs Through Empty Space█ Liquidity Voids: Where Price Runs Through Empty Space
Big moves don’t just “happen”, they happen because either buyers or sellers step aside and let price run.
A liquidity void is what’s left behind when that happens: an area on the chart where price traded with very little volume, leaving a ‘hole’ in market participation.
This is not just another fair value gap. A typical FVG can form on normal volume during strong momentum. A liquidity void specifically signals a displacement under thin conditions, meaning the move was too easy, and price often comes back to check that area later.
█ What Exactly Is a Liquidity Void?
Think of the order book as a ladder of bids and asks. Normally, price moves step by step as orders fill at each level. But when there aren’t enough orders (low liquidity), price jumps levels and that jump is your void.
On a chart, it shows up as:
A large, one-directional candle with very small or no wicks overlapping neighbors.
Little or no volume relative to the move’s size (thin participation).
Price displacement that looks almost “too clean” — no hesitation, just a straight run.
These clues tell you price didn’t just move on heavy buying/selling, it moved through empty space.
⚪ Liquidity Void Detector
Use this free Liquidity Void Detector indicator to spot liquidity voids. It signals when the market makes a relatively sharp move on comparatively low volume, helping you spot these voids in real time.
█ Why Low Volume Matters
⚪ Not All Gaps Are Voids
A fair value gap can form on high participation, think of a breakout candle with heavy volume and institutional backing. That’s an accepted price move.
⚪ Voids Are Different
A liquidity void happens when the market skips prices because there was no one there to trade. It’s an inefficient move that the market often wants to revisit and “fill in” once participation returns.
⚪ Volume as the Filter
When volume is below its own average (or below a trend baseline), it tells you this wasn’t a “healthy” move, it was a thin-book displacement.
█ How Traders Use This
⚪ Mark the Zone
Draw the high and low of the candle(s) that created the void. This is your “inefficiency zone.”
⚪ Wait for the Return
Voids often act like magnets. Price often reverses and retests or fills the void, but it can just as easily slice through the zone once revisited, as thin liquidity offers little resistance.
█ What Research Show
Academic studies on price gaps find that immediate fills are rare, but the probability of fill rises over time. Downward voids (panic selling) fill faster on average than upward voids.
Crypto traders track CME Bitcoin gaps and report over 80–90% eventually get filled, but timing is unpredictable.
Volume-adjusted strategies outperform simple gap-filling because they focus on inefficient moves, not every gap. The key is filtering for thin participation.
█ Bottom Line
Liquidity voids are not just gaps, they are evidence of skipped prices under low participation.
They tell you where price moved “too easily,” leaving behind unfinished business.
Learn to filter for low-volume displacements, mark those zones, and watch how often price comes back to rebalance them. This turns a random candle into a predictive level, one that can guide your mean reversion trades or act as a support/resistance flip in trending markets.
-----------------
Disclaimer
The content provided in my scripts, indicators, ideas, algorithms, and systems is for educational and informational purposes only. It does not constitute financial advice, investment recommendations, or a solicitation to buy or sell any financial instruments. I will not accept liability for any loss or damage, including without limitation any loss of profit, which may arise directly or indirectly from the use of or reliance on such information.
All investments involve risk, and the past performance of a security, industry, sector, market, financial product, trading strategy, backtest, or individual's trading does not guarantee future results or returns. Investors are fully responsible for any investment decisions they make. Such decisions should be based solely on an evaluation of their financial circumstances, investment objectives, risk tolerance, and liquidity needs.

Mitigation: Where Smart Money Reloads“The first touch after a shift is often the cleanest. But only if you know where to wait.”
After a ChoCH or Break of Structure , price often returns to the origin of the move.
This return is called Mitigation — where big players close remaining positions and open new ones in the direction of the fresh trend.
Why Mitigation Matters
Most traders jump in immediately after a BoS, afraid of missing the move.
But professional traders understand something crucial:
The market almost always comes back.
Mitigation is where the market “refuels” before continuing.
It offers:
Smaller stop losses (tighter risk)
Clear invalidation points
Cleaner entries with better risk-reward
How to Spot Mitigation Zones
Find the last opposing candle before the strong move (bearish candle before a bullish rally, bullish candle before a sell-off).
Mark its open–close range as your mitigation block.
Wait for price to return to this area — patience is key.
Drop to a lower timeframe (M15 or M1) and wait for confirmation (ChoCH/BOS) before entry.
Practical Example (Gold)
Suppose Gold breaks structure upward (BoS).
Instead of buying the breakout, look left to locate the last bearish candle before that strong rally.
Price often revisits this candle’s range.
When it does, observe lower timeframe structure:
If it holds, that’s your entry — right where smart money is filling orders.
This is why the first pullback after a BoS is often the cleanest trade — it’s not random.
It’s the market completing unfinished business.
📘 Shared by @ChartIsMirror
Have you seen this play out on your own charts?
Share your thoughts — where did price last revisit a zone before making a big move?

Liquidity: The Trap That Powers the Market“The market doesn’t move to reward you.
It moves to hunt those who move without awareness.”
Every beginner asks: “Why did price stop me out before going in my direction?”
The answer is usually one word: Liquidity .
What is Liquidity?
Liquidity is simply where orders are waiting:
Buy stops above a recent high
Sell stops below a recent low
Pending orders around round numbers (like 3400, 3350 in Gold)
These areas are pools of money.
The market needs these pools to fill large institutional orders.
Why Traders Get Trapped
Price breaks above a high → retail traders buy the breakout.
Price dips below a low → retail traders sell the breakdown.
But instead of continuing, price often snaps back .
Why? Because the market just collected those stops — the liquidity it needed — before reversing.
This is why beginners often say:
“Every time I enter, the market goes the other way.”
Sweep vs Grab
Sweep = Price pushes above/below a key level to collect stops. This alone doesn’t mean reversal.
Grab = After the sweep, price rejects and shifts structure (ChoCH/BOS). This confirms intent and often leads to the true move.
Practical Example (Gold)
Suppose Gold makes a high at 3395.
Many traders place buy stops above 3395, expecting a breakout.
Price pushes to 3397 (this is the sweep ), then falls back under 3395.
If structure shifts bearish after that, it becomes a liquidity grab .
The smart entry isn’t the breakout.
It’s after the sweep, when the grab confirms direction.
Trading isn’t about being the first one in.
It’s about being the last one trapped.
Patience protects you from becoming liquidity yourself.
📘 Shared by @ChartIsMirror

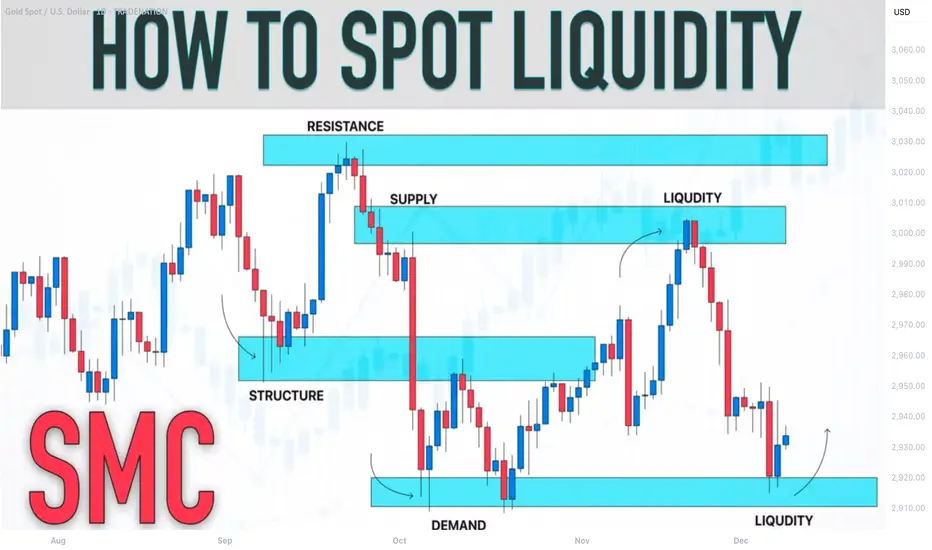
SMC Trading Basics. Liquidity Zones & How to Identify Them
In the today's article, I will teach you the concept of liquidity zones and how to identify them properly, trading Forex, Gold, Crypto and Indexes.
Simply put, a liquidity zone is a certain area on a price chart where a significant concentration of trading volumes occurred.
Huge trading volumes signify the presence of big players: hedge funds, banks, etc...
Correct identification of liquidity zones is essential for smart money trading, because such zones provide the safest and the most profitable trading opportunities.
There are 3 common characteristics of a valid liquidity zone:
1. Huge volume spikes upon its test
Take a look at the underlined blue area on USDCAD.
We see sharp volume spikes when the market was testing that area.
2. Strong rejections from such an area with a formation of long wicks
Look how the price reacts to the liquidity zone on USDJPY.
We see multiple strong rejections from that.
3. Long consolidation within that zone
Bitcoin was "standing" on a liquidity zone for more than 3 weeks, barely moving while trading volumes were quietly accumulating.
4. Multiple strong bullish or bearish reactions to that area
Just look how many times the underlined area was respected by the buyers and by the sellers. That is a perfect example of a liquidity zone.
To underline a liquidity zone properly, follow these simple rules:
1. If the price is ABOVE the liquidity zone, its lower boundary
will be the lowest wick within that area and its upper boundary will be the lowest candle close. Such a liquidity zone will be called a demand area.
Here is the example of drawing a liquidity zone on GBPUSD.
The lower boundary of the zone is the lowest wick, while its upper boundary is the lowest candle close.
2. If the price is BELOW the liquidity zone, its upper boundary will be the highest wick within that area and its lower boundary will be the highest candle close. Such a liquidity zone will be called a supply area.
Here is the liquidity zone that I identified on Gold following our rules.
Remember, that you can identify liquidity zones on any time frame. However, the rule is that the higher is the time frame, the stronger is the liquidity zone.
I prefer to analyze the liquidity zones on a daily time frame.
Once you underlined liquidity zones, you should realize that within these areas, big players are expected to place their orders in the future.
For that reason, after the tests of such areas, a strong bullish or bearish movements will be expected.
Here is a huge liquidity zone that I spotted on GBPJPY.
Look at a strong bearish movement that initiated after its test.
Your task as a smart money trader will be to identify bullish or bearish confirmations and understand the intentions of big players. With experience, you will learn to recognize valid signals.
❤️Please, support my work with like, thank you!❤️
I am part of Trade Nation's Influencer program and receive a monthly fee for using their TradingView charts in my analysis.
Break of Structure VS Liquidity Grab. How to Identify Valid BoS
The main problem with break of structure trading is that you can easily confuse that with a liquidity grab.
But don't worry.
There is a secret SMC price model that will help you to confirm a break of structure in a second.
Learn smart money concepts trading secrets and a simple strategy to trade break of structure on any forex pair.
Let's study a break of structure that I spotted on AUDUSD forex pair.
We see that the market is bullish on a daily time frame and the price has just violated a previous high with a break of structure.
The issue with that is the fact that such a violation can easily be a liquidity grab and a bullish trap .
Buying the market immediately after a BoS, we can incur a huge loss .
We need something that would help us to accurate validate that.
Fortunately, there is a simple price model in SMC that will help.
After you spotted a break of structure on a daily time frame,
use a 4h time frame for its validation.
After a BoS on a daily time frame, the market usually starts retracing , setting a new local high.
To confirm that it is not a trap, you will need a break of THAT structure on a 4H time frame.
It will increase the probabilities that the entire bullish movement that you see on a daily is not a manipulation.
Here is what exactly we need.
After the price violated a daily structure and closed above that, we see a minor intraday retracement on a 4h time frame.
A bullish violation of the last high there is our BoS confirmation and a clear indicator of the strength of the buyers.
You can execute a buy trade, following a simple strategy then.
Set a buy limit order on a retest of a broken high on a 4H,
a stop loss should be below the last higher low,
a take profit is based on the next supply zone on a daily.
To avoid the traps, a single time frame is not enough for profitable trading break of structure.
Learn to integrate multiple time frames in smart money concepts trading. It will help you make thousands of pips weekly.
❤️Please, support my work with like, thank you!❤️
I am part of Trade Nation's Influencer program and receive a monthly fee for using their TradingView charts in my analysis.
What Is an Iceberg Order, and How May It Be Used in Trading?What Is an Iceberg Order, and How May It Be Used in Trading?
An iceberg order is a type of execution strategy that hides the full size of a trade by revealing only small portions at a time. Used by institutions and large traders, it helps reduce market impact. Understanding how iceberg orders work, where they’re used, and their risks can help traders more accurately analyse market activity. This article breaks down everything you need to know about iceberg orders and their role in trading.
What Is an Iceberg Order?
An iceberg order is a type of order designed to execute large trades without revealing the full size to the market. Instead of placing one massive position that could disrupt prices, traders split it into smaller portions, with the rest hidden. As each portion gets filled, the next one is placed automatically until the full order is executed.
The key feature of this type of entry is that only a fraction—known as the display quantity—is visible in the order book at any given time. The rest remains hidden until it’s gradually revealed. This prevents other traders from immediately recognising the true size of the position, which helps avoid unnecessary market movements.
For example, if a trader wants to buy 50,000 shares of a stock, placing the full position in the market at once could cause prices to rise before execution is complete. Instead, they might set an iceberg order with a display size of 5,000 shares. Once the first 5,000 are bought, another 5,000 are automatically placed, repeating until the full 50,000 are executed.
They’re particularly useful for institutional traders, hedge funds, and high-net-worth individuals who want to build or reduce positions without attracting attention. However, some retail traders also use them when executing relatively large trades in markets that support this execution type. Many major exchanges, including those for equities, forex, and futures, allow icebergs, but their availability depends on the broker and trading platform being used.
How Iceberg Orders Work
The main idea of iceberg orders is clear but let’s consider how they work in detail.
Order Execution Process
When a trader places an iceberg order, they specify two key parameters:
Total size – The full amount they want to buy or sell.
Display size – The portion that will be visible at any given time.
For example, if a trader wants to buy 20,000 shares but only wants 500 to be visible at a time, the order book will show just 500 shares. Once those are bought, another 500 will appear at the same price (if still available), and the cycle continues until the entire 20,000 shares are filled.
Dynamic Execution
Some trading platforms and institutional brokers use smart order execution algorithms to optimise how these orders are placed. These algorithms might adjust the display size dynamically based on market conditions, ensuring the order gets executed efficiently without drawing too much attention.
Hidden Portions and Order Book Activity
Although most of the order remains hidden, experienced traders and high-frequency algorithms can sometimes detect iceberg levels. If they notice an order constantly refreshing at the same price level without an obvious large sell or buy position, they may infer that an iceberg is in play.
Where Iceberg Orders Are Most Popular
They are most popular in liquid markets where frequent trading activity allows the hidden portions to be executed smoothly. In less liquid markets, there’s a higher risk that the order will be only partially filled or take longer to execute, making alternative execution strategies more practical.
Why Traders Use Iceberg Orders
Iceberg orders help traders hide their full intentions from the market. Here’s why they’re commonly used:
Reducing Market Impact
When a large position enters the market, it can shift prices before the full trade is completed. This is particularly an issue in less liquid markets, where even moderate positions can cause price swings. By splitting a large trade into smaller, hidden chunks, iceberg orders prevent sudden moves that could work against the trader.
Avoiding Slippage
Slippage occurs when an order is executed at a worse price than expected due to market movement. Large trades placed all at once can exhaust available liquidity at the best price levels, forcing later portions to be filled at less favourable prices. Iceberg orders help mitigate this by allowing the trade to be executed gradually without consuming too much liquidity at once.
Maintaining Discretion
Institutions and high-net-worth traders often prefer to keep their trading activity under the radar. If other market participants see a massive buy or sell entry, they may react by adjusting their own strategies, making it harder for the original trader to get a good price. Icebergs keep most of the position hidden, preventing this from happening.
Reducing the Risk of Front-Running
High-frequency trading firms and aggressive traders actively monitor the order book for large transactions. When they spot them, they may enter positions ahead of the large trade, pushing prices in an unfavourable direction. By keeping most of the trade hidden, iceberg entries make it harder for others to exploit this information.
Identifying Iceberg Orders in the Market
Iceberg orders are designed to be discreet, but experienced traders and algorithmic systems can sometimes detect them by analysing order book activity and price movements. Since only a small portion of the total order is visible at any given time, certain patterns can reveal the presence of an iceberg in action.
Order Book Clues
One of the most obvious signs is a persistent order at the same price level. If a bid or ask keeps refreshing with the same quantity after being partially filled, it may indicate that a much larger hidden position is sitting at an iceberg level. This is particularly noticeable in less liquid markets where large trades are more disruptive.
Another telltale sign is a large trade volume without corresponding large visible orders. If significant buying or selling occurs but the order book only displays small entries, there’s a chance that a hidden order is gradually being executed.
Time and Sales Analysis
Traders can also look at time and sales data, which records every transaction. If the same price level repeatedly absorbs multiple trades without depleting, it suggests a hidden order replenishing itself after each execution.
Algorithmic Detection
Some trading algorithms are specifically designed to identify icebergs. These tools scan for patterns in order execution and attempt to infer hidden liquidity. While not always accurate, they can give traders an idea of when institutional activity is taking place.
Risks and Limitations of Iceberg Orders
While iceberg orders can help traders execute large trades discreetly, they are not without drawbacks. Market conditions, execution risks, and the rise of advanced trading algorithms can all impact their effectiveness.
- Incomplete Execution: If market conditions change or liquidity dries up, part of the position may remain unfilled. This is especially problematic in volatile or low-volume markets where price movements can accelerate unexpectedly.
- Detection by Algorithms: Sophisticated trading algorithms actively scan for hidden orders. High-frequency traders (HFTs) may detect it and adjust their strategies, making it harder to execute at a favourable price.
- Increased Trading Costs: Splitting a large entry into multiple smaller ones can lead to higher transaction costs. Exchanges and brokers may charge fees per executed trade, meaning an iceberg entry could end up costing more than a single bulk position.
- Slower Execution in Fast Markets: When markets move quickly, the visible portions of an iceberg might not fill fast enough before the price changes. This can lead to slippage, where later parts of the order get executed at worse prices than intended.
- Limited Availability: Not all brokers or exchanges support icebergs, particularly in smaller or less liquid markets. Some platforms also impose minimum position size requirements, restricting their use for smaller traders.
The Bottom Line
Iceberg orders enable traders to execute large trades discreetly, minimising market impact and enhancing execution quality. While they offer advantages in managing liquidity, they also carry risks such as detection by advanced algorithms and potential slippage. Traders should exercise caution and conduct thorough market analysis.
FAQ
What Is an Iceberg Order?
An iceberg order is a type of order that splits a large trade into smaller visible portions, with the remaining size hidden from the order book. As each visible portion is filled, the next one is automatically placed until the full order is executed. This helps traders avoid moving the market or revealing their full position size.
How Do You Identify an Iceberg Order?
Traders can spot icebergs by looking for repeated small trades at the same price level. If an order keeps refreshing after partial fills without a visible large order in the book, it may indicate hidden liquidity. Time and sales data, as well as algorithmic tools, can help detect these patterns.
What Is the Difference Between an Iceberg Order and a Basket Order?
An iceberg order breaks a single large entry into smaller, hidden parts, while a basket order consists of multiple different trades executed together, often across various assets or instruments. Basket orders are used for portfolio adjustments, whereas iceberg entries focus on reducing market impact.
What Is an Iceberg Order in Crypto*?
In crypto* markets, iceberg entries function the same way as in traditional markets—hiding large trades to prevent price fluctuations. Many exchanges offer this feature, particularly for institutional traders handling large positions.
How Do I Place an Iceberg Order?
Availability depends on the broker or exchange. Traders typically set the total position size and the visible portion, allowing the system to execute the trade in smaller segments.
What Is the Iceberg Order Strategy?
The strategy involves using iceberg orders to accumulate or distribute large positions without drawing attention. It helps reduce slippage, maintain discretion, and avoid triggering unnecessary price movement.
*Important: At FXOpen UK, Cryptocurrency trading via CFDs is only available to our Professional clients. They are not available for trading by Retail clients. To find out more information about how this may affect you, please get in touch with our team.
This article represents the opinion of the Companies operating under the FXOpen brand only. It is not to be construed as an offer, solicitation, or recommendation with respect to products and services provided by the Companies operating under the FXOpen brand, nor is it to be considered financial advice.

How to Find Liquidity Zones/Clusters on Any Forex Pair (GOLD)
You need just 1 minute of your time to find significant liquidity zones on any Forex pair and Gold.
In this article, I will teach you how to identify supply and demand zones easily step by step.
Liquidity Basics
By a market liquidity, I mean market orders.
The orders are not equally distributed among all the price levels.
While some will concentrate the interest of the market participants,
some levels will be low on liquidity.
Price levels and the areas that will attract and amass trading orders will be called liquidity zones.
How to Find Supply Zones
To find the strongest liquidity clusters, we will need to analyze a daily time frame.
A liquidity zone that is above current prices will be called a supply zone.
High volumes of selling orders will be distributed within.
One of the proven techniques to find such zones is to analyze a historic price action. You should identify a price level that acted as a strong resistance in the past.
4 horizontal levels that I underlined on EURGBP influenced market behavior in the recent past.
The price retraced from these levels significantly.
Why It Happened?
A down movement could occur because of an excess of selling orders and a closure of long positions by the buyers.
These factors indicate a high concentration of a liquidity around these price levels.
How to Draw Supply Zone?
One more thing to note about all these horizontal levels is that they cluster and the distance between them is relatively small .
To find a significant liquidity supply zone, I advise merging them into a single zone.
To draw that properly, its high should be based on the highest high among these levels. Its low should be based on the highest candle close level.
Following this strategy, here are 2 more significant supply zones.
We will assume that selling interest will concentrate within these areas and selling orders will be spread across its price ranges.
How to Find Demand Zones
A liquidity zone that is below current spot price levels will be called a demand zone . We will assume that buying orders will accumulate within.
To find these zones, we will analyze historically important price levels that acted as strong supports in the past.
I found 3 key support levels.
After tests of these levels, buying pressure emerged.
Why It Happened?
A bullish movement could occur because of an excess of buying orders and a closure of short positions by the sellers. Such clues strongly indicate a concentration of liquidity.
How to Draw Demand Zones?
Because these levels are close to each other, we will unify them into a one liquidity demand zone.
To draw a demand zone, I suggest that its low should be the lowest low among these key levels and its high should be the lowest candle close.
Examine 2 more liquidity zones that I found following this method.
Please, note that Demand Zone 2 is based on one single key level.
It is not mandatory for a liquidity zone to be based on multiple significant levels, it can be just one.
We will assume that buying interest will concentrate within these areas and buying orders will be allocated within the hole range.
Broken Liquidity Zones
There is one more liquidity zone that I did not underline.
That is a broken supply zone. After a breakout and a candle close above, it turned into a demand zone. For that reason, I plotted that based on the rules of supply zone drawing.
Start Market Analysis From Liquidity
Liquidity zones are one of the core elements of forex trading.
Your ability to recognize them properly is the key in predicting accurate price reversals.
Identify liquidity zones for:
spotting safe entry points,
use these zones as targets,
set your stop losses taking them into consideration.
They will help you to better understand the psychology of the market participants and their behavior.
I hope that the today's tutorial demonstrated you that it is very easy to find them.
❤️Please, support my work with like, thank you!❤️
I am part of Trade Nation's Influencer program and receive a monthly fee for using their TradingView charts in my analysis.

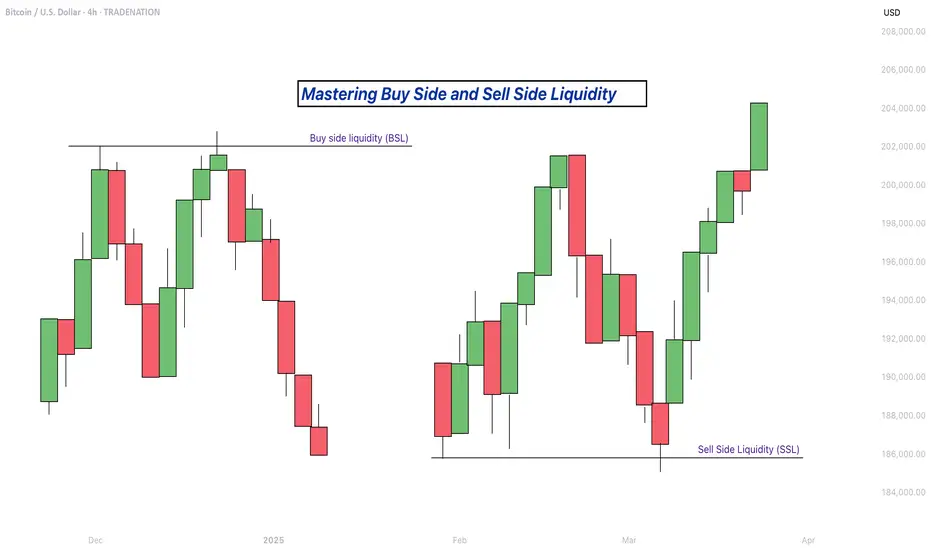
Mastering Buy Side and Sell Side Liquidity - How to trade it!In trading, understanding liquidity is one of the keys to predicting where the market might go next. The Inner Circle Trader (ICT) method teaches traders how to recognize where big players like banks and institutions are likely to enter or exit trades. Two important ideas in ICT trading are buy side liquidity and sell side liquidity. Once you understand what these terms mean and how to spot them on a chart, you can start using them to find better trading opportunities.
What will be discussed?
- What is Buy Side Liquidity?
- What is Sell Side Liquidity?
- How do you see Buy and Sell Side Liquidity?
- Examples
- How to trade BSL and SLL Liquidity?
What is Buy Side Liquidity
Buy side liquidity is found above market highs. It refers to all the stop loss orders from people who are holding short positions. When the market is going down, some traders sell (or go short) and place their stop losses above recent highs to protect themselves. These stop losses are actually buy orders because closing a short position requires buying. Big institutions know this, so they push price upward to trigger those stop losses and grab that liquidity. That’s why you’ll often see the market spike above a recent high before reversing. That spike is the market grabbing buy side liquidity.
What is Sell Side Liquidity
Sell side liquidity is the opposite. It’s found below recent lows. This is where traders who are buying (going long) place their stop losses. If someone buys a market, they’ll usually put a stop loss just below a previous low. That stop loss is a sell order. Smart money looks at these areas as pools of sell side liquidity. So when the market moves down quickly and breaks a recent low, it’s likely collecting those sell stop orders. After that, you’ll often see a reversal because the liquidity has been taken.
How do you see Buy and Sell Side Liquidity?
You can spot buy side and sell side liquidity by looking at the chart and identifying recent highs and lows where many traders might have placed stop losses. These are usually obvious swing highs and swing lows. If you look at a chart and see a clean high where price previously reversed, that’s likely where traders are placing stops. That makes it a target for buy side liquidity. Same for a recent low, if it’s a clean level where people might have bought in the past, that low probably holds sell side liquidity. The more obvious the level looks, the more likely it’s full of stops and therefore a liquidity target.
Examples
How to trade BSL and SLL Liquidity?
Trading liquidity means watching for the market to run above a recent high (to take buy side liquidity) or below a recent low (to take sell side liquidity), and then looking for signs of reversal. Once liquidity has been taken, the market often changes direction.
When you’re trading the ICT concept of liquidity, the key is not just spotting where liquidity lies, but also knowing when price is likely to reverse after that liquidity has been taken. Reversals don’t happen randomly, they leave clues on the chart. Here’s how you can recognize those signs in a simple way:
1. Market Structure Break
This is one of the clearest signs of a reversal. Let’s say the market grabs sell side liquidity by breaking below a recent low. If price then quickly starts moving up and breaks above the last lower high, that’s a break in structure. It shows that sellers are losing control and buyers are stepping in. It’s the first confirmation that the direction might be changing.
2. Rejection Wicks or Strong Candles
After price runs into liquidity (above a high or below a low), watch the candlesticks closely. If you see a long wick rejecting the level, or a strong candle in the opposite direction right after the liquidity grab, that’s a clue. It means price went there, collected the orders, and got rejected fast. That rejection shows the market might be reversing.
3. Fair Value Gaps (FVGs)
Fair value gaps are small “windows” left in price when it moves quickly in one direction. After liquidity is taken and price starts reversing, it often leaves an FVG behind. If price pulls back into that gap and holds, that can be a great entry point. FVGs act like magnets and support zones in ICT.
4. Displacement
Displacement is a strong, impulsive move that breaks structure. It usually happens right after liquidity is taken. If price moves very fast in the opposite direction after hitting a liquidity level, that’s a good sign smart money is behind the move and it’s not just random noise. That strong push is a hint that a new trend might be forming.
5. Change in Character (CHOCH)
This is a shift in how the market behaves. For example, price might be making lower highs and lower lows (a bearish trend), but after liquidity is taken, it suddenly starts making higher highs and higher lows. That change in character tells you the trend might be reversing.
-------------------------
Disclosure: I am part of Trade Nation's Influencer program and receive a monthly fee for using their TradingView charts in my analysis.
Thanks for your support. If you enjoyed this analysis, make sure to follow me so you don't miss the next one. And if you found it helpful, feel free to drop a like 👍 and leave a comment 💬, I’d love to hear your thoughts!
Welcome Back! Gold Trading Strategy & Key Zones to WatchIn this week’s welcome back video, I’m breaking down my updated approach to XAU/USD and how I plan to tackle the Gold markets in the coming days. After taking a short break, I’m back with fresh eyes and refined focus.
We’ll review current market structure, identify key liquidity zones, and outline the scenarios I’m watching for potential entries. Whether you’re day trading or swing trading gold, this breakdown will help you frame your week with clarity and confidence.
📌 Covered in this video:
My refreshed trading mindset after a break
Key support/resistance and liquidity zones
Market structure insights and setup conditions
What I’ll personally avoid this week
The “trap zones” that might catch retail traders off guard
🧠 Let’s focus on process over profits — welcome back, and let’s get to work.

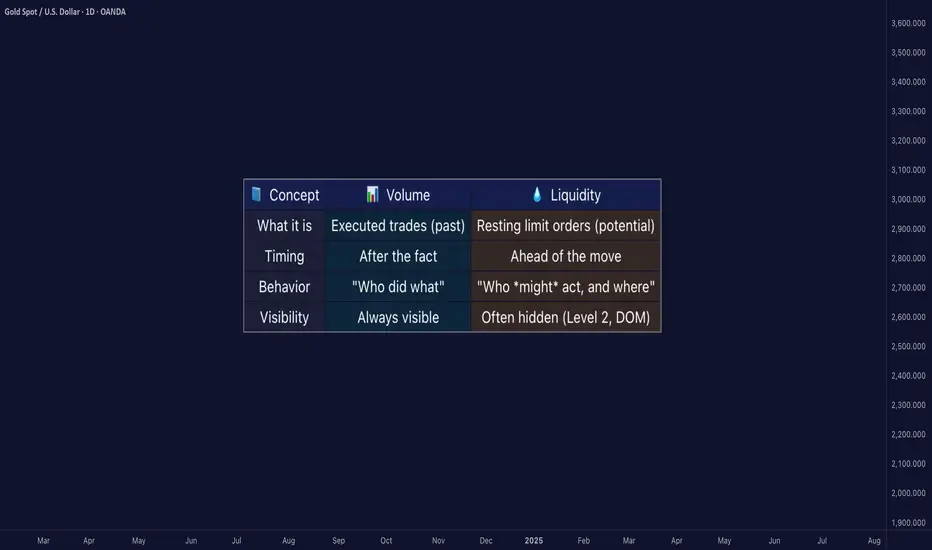
Liquidity ≠ Volume: The Truth Most Traders Never Learn█ Liquidity ≠ Volume: The Truth Most Traders Never Learn
Most traders obsess over volume bars, but volume is the footprint, not the path forward.
If you’ve ever seen price explode with no volume or fail despite strong volume, you’ve witnessed liquidity in action.
█ Here’s what you need to know
⚪ Volume Is Reactive — Liquidity Is Predictive
Volume tells you what happened.
Liquidity tells you what can happen.
█ Scenario 1: Price Jumps on Low Volume
❝ A price can jump on low volume if no liquidity exists above.❞
⚪ What’s happening?
The order book is thin above the current price (i.e., few or no sellers).
Even a small market buy order clears out available asks and pushes price up multiple levels.
Volume is low, but the impact is high because there’s no resistance.
⚪ Implication:
This is called a liquidity vacuum.
It can happen before news, during rebalancing, before session openings, on illiquid instruments, or during off-hours.
Traders often overestimate the strength of the move because they only see the candle, not the absence of offers behind it.
█ Scenario 2: Move Fails on High Volume
❝ A move can fail on high volume if it runs into a wall of offers or bids.❞
⚪ What’s happening?
There’s a strong surge of aggressive buying or selling (high volume).
But the order book has deep liquidity at that level — large resting limit orders.
The aggressive traders can’t chew through the liquidity wall, and price stalls or reverses.
⚪ Implication:
This is called liquidity absorption.
Market makers or institutions may intentionally absorb flow to stop a breakout.
Many retail traders mistake this for “fakeouts,” but it’s really liquidity defending a level.
⚪ What the Research Says
Cont, Stoikov, Talreja (2014): Price responds more to order book imbalance than trade volume.
Bouchaud et al. (2009): Liquidity gaps, not trade size, are what truly move markets.
Hasbrouck (1991): Trades only impact price if they consume liquidity.
Institutions don’t chase candles — they model depth, imbalance, and liquidity resilience.
⚪ Where the Alpha Lives
Liquidity tells you where the market is weak, strong, or vulnerable — before price moves.
Fakeouts happen in thin books.
Reversals occur at hidden walls of liquidity.
Breakouts sustain when liquidity follows the price, not pulls away.
If you understand this, you can:
Enter before volume shows up
Avoid chasing dead breakouts
Fade failed moves into empty space
█ Final Truth
Volume is the echo. Liquidity is the terrain. Alpha is in reading the terrain. You want to study the structure, because price moves toward weakness and away from strength. Learn to see where liquidity is, or where it’s missing, and you’ll see trading with new eyes.
-----------------
Disclaimer
The content provided in my scripts, indicators, ideas, algorithms, and systems is for educational and informational purposes only. It does not constitute financial advice, investment recommendations, or a solicitation to buy or sell any financial instruments. I will not accept liability for any loss or damage, including without limitation any loss of profit, which may arise directly or indirectly from the use of or reliance on such information.
All investments involve risk, and the past performance of a security, industry, sector, market, financial product, trading strategy, backtest, or individual's trading does not guarantee future results or returns. Investors are fully responsible for any investment decisions they make. Such decisions should be based solely on an evaluation of their financial circumstances, investment objectives, risk tolerance, and liquidity needs.
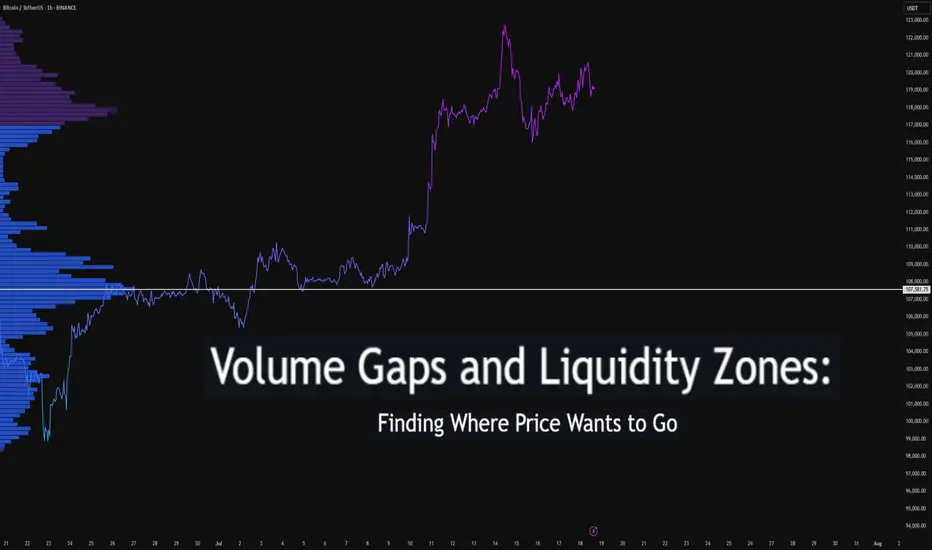
Volume Gaps and Liquidity Zones: Finding Where Price Wants to GoDifficulty: 🐳🐳🐳🐋🐋 (Intermediate+)
This article is best suited for traders familiar with volume profile, liquidity concepts, and price structure. It blends practical trading setups with deeper insights into how price seeks inefficiency and liquidity.
🔵 INTRODUCTION
Ever wonder why price suddenly accelerates toward a level — like it's being magnetized? It’s not magic. It’s liquidity . Markets move toward areas where orders are easiest to fill, and they often avoid areas with little interest.
In this article, you’ll learn how to identify volume gaps and liquidity zones using volume profiles and price action. These tools help you anticipate where price wants to go next — before it gets there.
🔵 WHAT ARE VOLUME GAPS?
A volume gap is a price region with unusually low traded volume . When price enters these areas, it often moves quickly — there’s less resistance.
Think of a volume gap as a thin patch of ice on a frozen lake. Once the market steps on it, it slides across rapidly.
Volume gaps usually show up on:
Volume Profile
Fixed Range Volume tools
Session or custom volume zones
They’re often created during impulsive moves or news events — when price skips levels without building interest.
🔵 WHAT ARE LIQUIDITY ZONES?
Liquidity zones are price areas where a large number of orders are likely to be sitting — stop losses, limit entries, or liquidation levels.
These zones often form around:
Swing highs and lows
Order blocks or fair value gaps
Consolidation breakouts
Psychological round numbers
When price approaches these areas, volume often spikes as those orders get filled — causing sharp rejections or breakouts.
🔵 WHY THIS MATTERS TO TRADERS
Markets are driven by liquidity.
Price doesn’t just move randomly — it hunts liquidity, clears inefficiencies, and fills orders.
Your edge: By combining volume gaps (low resistance) with liquidity zones (target areas), you can forecast where price wants to go .
Volume gap = acceleration path
Liquidity zone = destination / reversal point
🔵 HOW TO TRADE THIS CONCEPT
1️⃣ Identify Volume Gaps
Use a visible range volume profile or session volume. Look for tall bars (high interest) and valleys (low interest).
2️⃣ Mark Liquidity Zones
Use swing highs/lows, OBs, or EQH/EQL (equal highs/lows). These are magnet areas for price.
3️⃣ Watch for Reactions
When price enters a gap, expect speed.
When it nears a liquidity zone, watch for:
Volume spike
Wick rejections
S/R flip or OB retest
🔵 EXAMPLE SCENARIO
A strong bearish move creates a volume gap between 103 000 – 96 000
Below 96 000 sits bullish order blocks — clear liquidity
Price enters the gap and slides fast toward 96 000
A wick forms as buyers step in, volume spikes — the reversal begins
That’s price filling inefficiency and tapping liquidity .
🔵 TIPS FOR ADVANCED TRADERS
Use higher timeframes (4H/1D) to define major gaps
Look for overlapping gaps across sessions (Asia → London → NY)
Align your trades with trend: gap-fills against trend are riskier
Add OB or VWAP as confirmation near liquidity zones
🔵 CONCLUSION
Understanding volume gaps and liquidity zones is like reading the market’s intention map . Instead of reacting, you start predicting. Instead of chasing, you’re waiting for price to come to your zone — with a plan.
Price always seeks balance and liquidity . Your job is to spot where those forces are hiding.
Have you ever traded a volume gap into liquidity? Share your setup below
How to Trade Smart Money Concepts (SMC)\ How to Trade Smart Money Concepts (SMC)\
\ This article explores the foundation, key tools, and practical insights of Smart Money Concepts — and why it’s worth your attention.\
In today's fast-changing financial landscape, Smart Money Concepts (SMC) has become a popular strategy among modern traders. But what is SMC exactly, and how can it improve your trading decisions? This article breaks it down in a simple, professional way for traders at all levels.
---
\ What Are Smart Money Concepts?\
SMC is a trading approach based on the belief that large institutions ("smart money") like banks and hedge funds control most of the market's movements. These institutions often move the market in ways that confuse or trap retail traders. The goal of SMC is to understand and follow the footsteps of these big players.
Instead of relying on simple patterns or indicators, SMC focuses on:
\ - Market structure\
\ - Supply and demand zones\
\ - Liquidity pools\
By aligning your trades with the behavior of smart money, you can position yourself more strategically in the market.
---
\ Key SMC Concepts Explained\
\ Order Blocks\
Order blocks are zones on the chart where large institutions have placed significant buy or sell orders. These zones often lead to strong price reactions and act as hidden support or resistance levels. Order blocks are considered more precise than traditional supply and demand areas.
Example: ()
\ Fair Value Gap (FVG)\
A Fair Value Gap occurs when price moves sharply in one direction, leaving a gap or imbalance in the price action. These areas often get filled later and can act as magnets for price.
In a bearish move, the FVG is the gap between the low of the previous candle and the high of the next one. In a bullish move, it's the reverse.
Example: ()
\ Timeframe Consideration\
If you can’t monitor charts during the day, avoid relying on 5–30 minute setups. Consider 4H or daily timeframes for clearer signals and more manageable trading decisions.
\ Liquidity\
Liquidity refers to price zones where lots of pending orders exist. These are usually at obvious highs, lows, or trendlines. Smart money often targets these areas to trigger stop-losses and generate movement.
One common tool to identify liquidity is a "pivot point," which is a candle with a lower low or higher high than its neighbors.
Example: ()
\ Break of Structure (BOS)\
BOS occurs when price breaks above or below a previous high or low, signaling a possible trend continuation.
Example: ()
\ Change of Character (ChoCH)\
ChoCH happens when the market changes direction. For example, if price breaks a higher low in an uptrend, it may signal a reversal.
Example: ()
Combined with BOS: ()
---
\ How SMC Compares to Wyckoff\
The idea of "smart money" isn't new. Richard D. Wyckoff, a pioneer in technical analysis, laid the foundation for understanding market cycles driven by institutions. His price cycle theory includes four phases:
\ 1. Accumulation\
Smart money buys while the public is unaware.
\ 2. Markup\
Price rises as smart money pushes the market.
\ 3. Distribution\
Smart money sells into public buying.
\ 4. Markdown\
Price falls as the cycle completes.
SMC borrows from this logic but focuses more on structure and liquidity zones. Still, the core idea is the same: understand what big players are doing, and follow them.
\ For deeper insights into Wyckoff, explore additional resources focused on accumulation/distribution cycles.\
---
\ Summary\
Smart Money Concepts give traders a deeper look into market mechanics. By focusing on order blocks, fair value gaps, liquidity, and structure breaks, SMC helps identify high-probability trade setups based on institutional behavior.
It may seem complex at first, but once you understand the basics, SMC can become a powerful tool in your trading strategy. Whether you’re new or experienced, aligning with smart money can improve your edge in the market.

Mastering Liquidity Dynamics: Understand the Dynamic True ValueDear Reader,
Thank you for reading—your time is valuable.
Use the chart's zoom-in/out (-/+) function for better visibility. This chart captures a large sample for your evaluation.
Below is the manual detailing the Smart Farmer System —a Dynamic True Value framework derived from real-time data to anticipate market intent and liquidity behavior .
If this resonates with you, drop a comment below— constructive insights are always welcome .
The Dynamic True Value - a Smart Farmer System: Terminology and Mechanics
: For now, I have firmed up POC - Price of Control, VAP - Value Average Pricing, SULB - Sell Upper Limit Bound, BLLB - Buy Lower Limit Bound.
Mechanic:
POC - Where fair value price dynamic is read.
VAP - Trading above indicates bullish sentiment of the cycle, and the opposite for bearish sentiment.
A crossed over of:
Grey POC above Green VAP - Signaling distribution, accumulation, consolidation, build-ups, correction, retracement .
Green VAP above Grey POC - Bullish strength and momentum consistency .
Pink VAP above Black POC - Bearish strength and momentum consistency .
Flip of Pink VAP to Green VAP - Sentiment flips from bear to bull, and the same goes for green flip to pink showing bull to bear.
Validation of entry signals requires:
Signal's candle must close past the opposite side of POC – flip sentiment .
The confirmation candle (is the closed next candle immediately after entry signal candle) must continue closed past the POC – maintain sentiment .
The progress candle (is the next candle closed right after the Confirmation Candle) shows traction, momentum build-up, and volume consistency .
Hint of invalidation:
Signal's candle is considered void if the next candle prints a new entry signal in the opposite direction. This often signals accumulation, sideways movement, build-up, uncertainty, or swings in range .
The immediate next candle closed past POC to the opposite side.
What to understand about Liquidity Trap, SULB, and BLLB:
Liquidity traps
Often occur at the recent/previous flatlines of Dynamic True Value (POC, VAP, SULB, BLLB) .
It is worth paying attention to the market’s intent and institutional positioning.
Signs of exhaustion, absorption, inducement, offloading, and accumulation are visible in the M1 (one-minute) TF, with significant confluence near the previous/recent flatlines of Dynamic True Value in the higher/macro-TFs.
An Anchored VWAP tool can be helpful for filtering noise in the market. This tool can be found in the drawing tab in the TradingView platform.
SULB
Details the dynamic of upper resistance where Bears remain in control below the dynamic level.
Below this limit bound (LB) , bears show strength – bear sentiment .
A converging price toward this LB indicates bulls are present.
Moving past this LB (a candle closed above) and successfully RETESTING newly formed support indicates a confirmed directional shift . Followed by printing a new BLLB in the next following candles with price continuing to rise above this failed SULB.
A rejection below LB (a rejection/exhausted candle closed below LB) and successful RETEST reaffirms the resistance holds , indicating downside continuation .
BLLB
Details the dynamic of lower support where Bulls remain in control above the dynamic level.
Above this LB, bulls show strength – bull sentiment .
A converging price toward this LB signifies bears are present.
Moving past this LB (a candle closed below) and successfully RETESTING newly formed resistance indicates a confirmed directional shift . Followed by printing a new SULB in the next following candles with price continuing to push lower below this failed BLLB.
A rejection above LB (a rejection/exhausted candle closed above LB) and successful RETEST reaffirms the support holds , indicating upward continuation .
Important Notes:
Select preferred Entry’s Signal TF (ex. M3 TF, M5 TF for scalping strategy, M15 for intraday/daily strategy, 4H TF for day-to-weekly strategy, etc.).
Always refer to the selected Entry’s TF for trading progress. Anticipate TP and SL by watching the range in this TF.
Non-entry TFs are not for entry purposes. These multi-TFs are used for measuring strength, momentum, liquidity, positioning, structure – The market intends . The Non-entry TF is used to anticipate institutional executions and liquidity pools.
These criteria MUST BE MET. A failed criterion suggests vague execution. Be patient and wait for clear validations.
Institutions excel in creating illusions.
SFS is designed to stand ready, calm, and execute with Clarity.
SFS cuts through noise, distraction, and stays independent of NEWS, GEOPOLITIC, RUMORS, and herd mentality because all these are designed to mislead retail traders into institutional traps.
When we see such ambiguity against the criteria, we know not to fall into the TRAP and become the liquidity FUEL.
Stay sharp, only respond when signals are firmed. SFS is designed to counter Smart Money capitalism. It is about time to level the playing field.

Follow the Flow: Trading with Liquidity ZonesLiquidity is where the market breathes. The Liquidity Zones indicator by BigBeluga helps traders visualize where large players may be hiding orders—revealing the zones where price is most likely to react, reverse, or accelerate.
Let’s break down how this tool works, how we use it at Xuantify, and how you can integrate it into your own strategy.
🔍 What Is the Liquidity Zones Indicator?
This open-source tool identifies pivot highs and lows filtered by volume strength and plots them as liquidity zones —highlighting areas where buy/sell orders are likely to accumulate.
Key Features:
Volume-filtered pivot detection (Low, Mid, High)
Dynamic or static liquidity zone boxes
Color intensity based on volume strength
Liquidity grab detection with visual cues
These zones act as magnets for price , helping traders anticipate where reactions, reversals, or stop hunts may occur.
🧠 How We Use It at Xuantify
We use Liquidity Zones as a contextual map for structure and execution.
1. Entry & Exit Planning
We align entries near untested liquidity zones and use them as targets for exits—especially when confirmed by structure or momentum.
2. Liquidity Grab Detection
When price pierces a zone and reverses, it often signals a liquidity sweep . We use this as a trigger for reversal setups.
3. Volume Context
Zones with higher volume intensity are prioritized. These are more likely to attract institutional activity and generate stronger reactions.
🧭 Dynamic vs. Static Zones
The indicator offers both dynamic and static zone modes:
Dynamic : Box height adjusts based on normalized volume, showing how much liquidity is likely present.
Static : Consistent box size for cleaner visuals and easier backtesting.
Why this matters:
Dynamic zones reflect real-time volume strength
Static zones offer simplicity and clarity
Both modes help visualize where price is likely to “grab” liquidity
⚙️ Settings That Matter
To get the most out of this tool, we recommend:
Volume Strength = Mid or High for cleaner zones
Enable Dynamic Mode when trading volatile assets
Use Color Intensity to quickly spot high-liquidity areas
🔗 Best Combinations with This Indicator
We pair Liquidity Zones with:
Market Structure Tools – BOS/CHOCH for context
Momentum Indicators – Like RSI or MACD for confirmation
Fair Value Gaps (FVGs) – For precision entries near liquidity
This layered approach helps us trade into liquidity , not against it.
⚠️ What to Watch Out For
Liquidity zones are not signals —they’re context . In fast-moving or low-volume markets, price may ignore zones or overshoot them. Always combine with structure and confirmation.
🔁 Repainting Behavior
The Liquidity Zones indicator is designed to be non-repainting . However, due to waiting for pivot confirmation, the zones are plotted in hindsight. This makes it suitable for real-time execution .
⏳ Lagging or Leading?
This tool is partially lagging —it waits for pivot confirmation and volume validation before plotting a zone. However, once plotted, these zones often act as leading levels , helping traders anticipate where price may react next.
🚀 Final Thoughts
The Liquidity Zones indicator by BigBeluga is a powerful visual tool for traders who want to understand where the market is likely to move—not just where it’s been. Whether you’re trading reversals, breakouts, or mean reversion, this tool helps you stay aligned with the market’s hidden intent.
Add it to your chart, test it, and see how it sharpens your edge.

Understanding Liquidity: Where Big Players Hunt Stops
Understanding Liquidity: Where Big Players Hunt Stops
Ever wondered why price suddenly spikes through your stop-loss and reverses moments later? That’s not a coincidence—it’s liquidity at play. This article will teach you how liquidity zones work, why stop hunts happen, and how to avoid getting trapped like the crowd.
🔵 What Is Liquidity in Trading?
Liquidity refers to how easily an asset can be bought or sold without drastically affecting its price. But in practical trading, liquidity is more than just volume—it’s where traders *place* their money.
Large players—institutions, market makers, or big accounts—need liquidity to fill orders.
They target areas where many retail stop-losses or pending orders are stacked.
These areas are often just above resistance or below support—classic stop-loss zones.
To move large positions without slippage, smart money uses stop hunts to trigger retail orders and create the liquidity they need.
🔵 Where Do Liquidity Zones Form?
Liquidity often builds up in predictable areas:
Above resistance: Where shorts place stop-losses.
Below support: Where longs place stop-losses.
Swing highs/lows: Obvious turning points everyone sees.
Round numbers: e.g., 1000, 10,000, 50,000.
Breakout zones: Where breakout traders place entries or stops.
These zones act like magnets. When price approaches them, it accelerates—seeking the liquidity pool behind the level.
🔵 What Is a Stop Hunt?
A stop hunt happens when price moves just far enough to trigger stop-losses before reversing. This isn’t market noise—it’s an intentional move by big players to:
Trigger a flood of stop orders (buy or sell).
Fill their own large positions using that liquidity.
Reverse price back to fair value or the prior trend.
Example: Price breaks above resistance → stops get hit → institutions sell into that liquidity → price drops sharply.
🔵 Signs You’re in a Liquidity Grab
Look for these clues:
Fast spike beyond key levels followed by rejection.
Wick-heavy candles near highs/lows.
Price touches a level, then sharply reverses.
High volume on failed breakouts or fakeouts.
These are signs of a liquidity event—not a real breakout.
🔵 How to Trade Around Liquidity Zones
You can use liquidity traps to your advantage instead of becoming their victim.
Avoid obvious stops: Don’t place stops directly below support or above resistance. Instead, use ATR-based or structure-based stops.
Wait for confirmation: Don’t chase breakouts. Let price break, reject, then re-enter inside the range.
Watch for wick rejections: If price quickly returns after a level is breached, it's often a trap.
Use higher timeframe confluence: Liquidity grabs are more powerful when they align with HTF reversals or zones.
🔵 Real Example: Liquidity Sweep Before Reversal
In this chart, we see a textbook liquidity grab:
Price breaks below support.
Longs get stopped out.
Candle prints a long wick.
Market reverses into an uptrend.
This is where smart traders enter— after the trap is set, not during.
🔵 Final Thoughts
Liquidity is the invisible hand of the market. Stop hunts aren’t personal—they’re structural. Big players simply go where the orders are. As retail traders, the best thing we can do is:
Understand where traps are set.
Avoid being part of the crowd.
Trade the reaction, not the initial breakout.
By thinking like the smart money, you can stop getting hunted—and start hunting for better trades.

How to Trade Liquidity Sweeps Using PDH/PDL Levels (Smart Money This guide shows how to use the **Liquidity Sweep Detector – PDH/PDL Levels** script, now live on my profile.
**What It Does:**
- Accurately plots the previous day's high and low on intraday charts (15m, 1H)
- Detects when price *sweeps* above or below those levels (potential liquidity grabs)
- Visually marks sweeps with a dashed line and alerts you in real time
- Optional table to show current sweep status (can be toggled off)
**How I Use It:**
- Wait for a sweep above PDH or below PDL
- Look for rejection candles or structure shift afterward (e.g., CHoCH or BOS)
- Combine with session timing (e.g., London/NY) for confluence
**Pro Tip:**
Set alerts to catch sweeps even when you're away from the screen. Just click "Add Alert" and use:
- `PDH Sweep Triggered`
- `PDL Sweep Triggered`
This is part of how I approach Smart Money trading — combining market structure with real liquidity events.
Script is open and free to use — find it on my profile:
**Liquidity Sweep Detector – PDH/PDL Levels**

Ultimate Guide to Liquidity Sweeps: Trading Smart Money MovesIn the world of Crypto and other financial markets, liquidity sweeps are deliberate price moves designed to capture liquidity sitting above or below key price levels. These moves are not random, they are orchestrated by large players who need to fill significant orders efficiently. By pushing price into zones where stop-losses and pending orders accumulate, these entities access the liquidity required to open large positions without causing excessive slippage.
Liquidity sweeps offer sharp insights into market structure and intent. Understanding how they work and recognizing them in real-time can significantly enhance a trader’s edge, especially in environments dominated by algorithmic and smart money behavior.
Defining the Liquidity Sweep
A liquidity sweep is characterized by a quick push through a well-defined support or resistance level, typically a recent high or low, followed by a swift reversal. These zones are hotspots for stop orders placed by retail traders, such as long stop-losses placed under swing lows or short stops above recent highs. When these stops are triggered, they act as liquidity pools.
Large players anticipate these zones and use them to enter positions. The sweep creates an illusion of breakout or breakdown, luring reactive traders in, only for the price to reverse direction once the necessary liquidity is absorbed. This mechanism reveals the strategic manipulation often present in efficient markets.
Structure and Behavior of a Sweep
The process typically starts with the market forming a recognizable range, often between a defined high and low. Price then consolidates or slowly trends toward one edge of the range, building tension. As the market reaches that boundary, a sudden surge beyond the level occurs, this is the sweep. Importantly, price does not sustain above or below the level. Instead, it quickly retraces, printing a rejection wick or reversal pattern.
Following the reversal, the market often resumes its original trend or begins a new leg in the opposite direction of the sweep. For traders, this offers a clear point of entry and invalidation, allowing for precise trade setups.
Bullish Scenario, Sweep of Lows
When Bitcoin approaches a prior low, especially one that marked a swing point or a support level, many traders place their stop-losses just below that low. This creates a pocket of sell-side liquidity.
In a bullish liquidity sweep, price will spike below this prior low, often triggered by a news event, a large market order, or a sudden increase in volatility. The market will quickly wick below the level, triggering stop-losses and perhaps inviting new short positions. However, instead of continuing lower, price snaps back above the broken level and begins to climb.
This reversal indicates that large players were absorbing liquidity at the lows and are now positioned long. Traders can look for bullish confirmation via engulfing candles, reclaim of the low, or a fast return into the previous range.
Bearish Scenario, Sweep of Highs
Conversely, when Bitcoin grinds higher toward a prior swing high or resistance level, traders anticipating a breakout may enter early, while others have stop-losses on short positions resting above the level.
A bearish liquidity sweep occurs when price spikes above the prior high, triggering those buy stops and breakout entries. Almost immediately, the market reverses, showing rejection at the highs. This action signals that buy-side liquidity has been used by larger players to enter short positions.
Once price fails to hold above the breakout level and begins to drop, the sweep is confirmed. Traders aligned with this read may look for bearish structure to form, such as a lower high, and enter short with a defined invalidation above the sweep.
Common Pitfalls and Misinterpretations
One of the most frequent mistakes traders make is confusing a sweep for a breakout. Liquidity sweeps are often mistaken for the beginning of a new trend leg, leading to premature entries that quickly get reversed.
Another pitfall is ignoring the broader market context. Liquidity sweeps are most reliable when they occur at logical levels aligned with higher time frame bias. Without that alignment, the sweep may simply be part of a choppy, indecisive range.
Lack of confirmation is also an issue. Entering trades immediately after a wick without seeing structure reclaim, volume shift, or candle confirmation can lead to unnecessary losses.
Confirming a Valid Sweep
To increase confidence in a sweep setup, traders should watch for several confirming behaviors. Volume often spikes during the sweep itself, followed by a drop in volatility as the market reverses. Divergences on momentum indicators like RSI or OBV can also support the idea of an exhausted move.
Most importantly, the reaction after the sweep matters more than the sweep itself. If price fails to reclaim the swept level or continues trending, the move was likely a true breakout, not a manipulation.
In high-probability sweeps, price often reclaims the level and begins forming structure in the opposite direction. Watching for breaker blocks, fair value gaps, or inefficiencies being respected in this phase can also strengthen the case for entry.
Conclusion
Liquidity sweeps are one of the clearest footprints left behind by smart money. While they can be deceptive in the moment, with enough practice and context awareness, they become one of the most powerful tools in a trader’s arsenal.
The key lies in understanding that these moves are engineered, not accidental. Recognizing where the market is likely hunting liquidity, and how it behaves after collecting it, can dramatically improve your ability to enter trades with precision, confidence, and clear invalidation.
__________________________________________
Thanks for your support!
If you found this guide helpful or learned something new, drop a like 👍 and leave a comment, I’d love to hear your thoughts! 🚀
Make sure to follow me for more price action insights, free indicators, and trading strategies. Let’s grow and trade smarter together! 📈

Mastering Volatile Markets: Liquidity Makes or Breaks Trades█ Mastering Volatile Markets Part 2: Why Liquidity Makes or Breaks Your Trades
If you've read the first part of this four-part series, you know that reducing position size is a key strategy for surviving volatile markets. The second crucial factor that determines success or failure in wild markets is understanding liquidity.
In volatile markets, liquidity is often the real reason behind those massive price spikes — whether 300-500 point moves in the NAS100, violent whipsaws in crypto or stop hunts in forex.
█ Liquidity: The Silent Killer in Wild Markets
In normal market conditions, liquidity is everywhere. You can enter and exit trades with minimal slippage, and everything feels smooth. But in volatile conditions, liquidity can disappear quickly.
Here's why it happens:
Market makers pull back to avoid getting caught in wild moves.
Spreads widen , making execution harder.
Order books thin out , meaning there aren't enough buy or sell orders to absorb aggressive price movements.
Even small orders can cause significant price changes when liquidity is low.
This is what causes those huge candles you often see in volatile markets. It's not just about more buyers or sellers; it's about less liquidity available to absorb those trades.
There’s also a common misunderstanding at play here: High Volume = High Liquidity
Many newer traders see a big volume candle and think, "Oh, high volume means it's safe to trade." But that’s an inaccurate conclusion.
⚪ Volume refers to the number of transactions happening.
⚪ Liquidity refers to how much depth the market has to handle those transactions without causing price instability.
In volatile markets, high volume doesn't mean there's enough liquidity.
And low liquidity causes wild wicks, huge spreads, higher slippage and unstable price action.
█ How to Navigate Low Liquidity in Volatile Markets
So, how can you trade effectively in these conditions?
1) Expect Crazy Moves — Levels Will Get Violated
In high-volatility, low-liquidity markets:
Support and resistance levels won't hold as they usually do.
Price will blow through key levels like they were nothing.
Fakeouts become extremely common.
2) Don't Rely Solely on Support & Resistance
As a newer trader, it's vital not to blindly rely on S/R levels in these markets. Here's why:
Don't expect clean bounces or perfect reactions.
Fakeouts, wicks, and stop hunts are normal.
Tight stops right behind these levels? You'll get stopped out a lot.
Experienced traders know this, which is why we adapt the strategies to handle the market's unpredictability.
3) Split Your Orders Into Smaller Chunks
One of the most effective techniques in volatile markets is order splitting.
Break it into smaller chunks instead of entering your full position at one price. This would help you survive fakeouts, scale in better across larger price moves and avoid becoming liquidity for bigger players.
Example: Let's say you want to go long at support (15,000 on the NAS100), instead of entering all at 15,000. Instead Enter:
25% at 15,000
25% at 14,950
25% at 14,900
25% at 14,850
This way, if the market fakes out below support due to low liquidity, you get filled at better prices without panic.
4) Control Your Emotions — Understand the Environment
This is HUGE in volatile markets.
Many retail traders panic when prices move against them quickly. But if you understand the nature of low liquidity , you can remain calm:
It's normal for the price to move wildly.
Levels will get swept.
Fake moves are common before the market plays out the right way.
█ Summary
Let’s take stock of what we learned today about liquidity in highly volatile markets:
High volatility often equals low liquidity.
High volume does not equal high liquidity.
Expect fakeouts , wild price behavior, and wide spreads.
Don't rely blindly on support/resistance levels.
Split your orders into smaller chunks to manage risk.
Trade smaller position sizes and stay calm.
Remember, you must adapt not only your size but also your execution . Understand liquidity, or it will punish you.
█ What We Covered Already:
Part 1: Reduce Position Size
Part 2: Liquidity Makes or Breaks Trades
█ What's Coming Next in the Series:
Part 3: Patience Over FOMO
Part 4: Trend Is Your Best Friend
-----------------
Disclaimer
The content provided in my scripts, indicators, ideas, algorithms, and systems is for educational and informational purposes only. It does not constitute financial advice, investment recommendations, or a solicitation to buy or sell any financial instruments. I will not accept liability for any loss or damage, including without limitation any loss of profit, which may arise directly or indirectly from the use of or reliance on such information.
All investments involve risk, and the past performance of a security, industry, sector, market, financial product, trading strategy, backtest, or individual's trading does not guarantee future results or returns. Investors are fully responsible for any investment decisions they make. Such decisions should be based solely on an evaluation of their financial circumstances, investment objectives, risk tolerance, and liquidity needs.
