Gold in Financial Markets – Why It Remains the King of AssetsFor hundreds of years, financial markets have witnessed the rise and fall of countless asset classes — from stocks, bonds, and currencies to crypto. Yet there is one asset that has never lost its core position: gold.
Without noise, without promotion, gold has quietly maintained its throne within the global financial system.
So what makes gold the enduring “King of Assets”?
1. Gold is not a financial product – it is the “ultimate currency”
Unlike stocks (which depend on corporations), bonds (which depend on governments), or fiat money (which depends on policy decisions), gold is not tied to anyone’s promise.
- No default risk
- Cannot be printed at will
- Independent of the banking system
👉 When confidence in the financial system weakens, gold becomes the natural safe haven.
2. Gold always wins in times of instability
Look back at history:
- Financial crises
- Wars and geopolitical tensions
- High inflation and economic recessions
- Uncontrolled monetary policies
In every period of instability, capital flows toward gold.
The key point is this:
Gold doesn’t need “good news” to rise — it only needs uncertainty.
3. The unique relationship between gold and currency
Gold is usually priced in USD, but its true value is not in dollars — it is in purchasing power.
- USD weakens → gold strengthens
- Inflation rises → gold preserves value
- Negative real interest rates → gold becomes more attractive
👉 Gold is essentially a barometer of trust in fiat money.
4. Why do Central Banks still accumulate gold?
This is a point many traders overlook.
If gold were truly “outdated,” as some claim, then why:
- Do central banks continue to buy gold consistently?
- Does gold remain the backbone of national financial security?
The answer is simple and clear:
When everything else collapses, gold is the last asset with universal value.
5. Gold in modern trading – more than just a safe haven
In today’s markets, gold is not only for long-term investors:
- A powerful indicator of risk-on / risk-off sentiment
- A highly liquid asset with strong volatility
- Suitable for both short-term traders and long-term investors
That’s why XAUUSD remains one of the most traded instruments in the world.
6. Why serious traders always monitor gold
Gold doesn’t just offer trading opportunities — it also:
- Provides the big-picture view of global markets
- Helps read global capital flow psychology
- Acts as an early warning signal for systemic risk
A trader who understands gold often understands the market more deeply than someone focused on just one currency pair.
Conclusion
Gold is not an “outdated” asset.
It is an asset that has survived every cycle.
- When markets are euphoric → gold stays silent
- When markets panic → gold speaks
That is why, no matter how the world changes, gold remains the King of Assets.
📌 If you trade gold, remember: you’re not just trading a chart — you’re trading the confidence of the entire global financial system.
What’s your view on gold’s role in the current market cycle?
💬 Share your perspective below 👇
Metals

THE SECRET TRADING STRATEGY REVEALEDIn trading, the word “secret” is often misunderstood.
Many traders associate it with a magical indicator, a hidden formula, or a system known only to a few. In reality, the most effective trading strategies are not secret at all — they are simply misinterpreted or ignored.
1. Markets reward understanding, not prediction
Most new traders focus on predicting:
- Where price will go next
- Where the exact top or bottom is
- How the market will react to news
Experienced traders approach the market differently. They ask a more important question:
Who is in control of the market right now?
Price does not move randomly. Every move is the result of capital flow and decision-making.
2. The real “secret” lies in market structure
Market structure is the most honest reflection of capital behavior:
- Higher highs and higher lows signal sustained buying pressure
- Lower highs and lower lows indicate growing selling dominance
Unprofitable traders focus on price levels.
Consistent traders focus on how price is formed.
When you understand structure, you no longer need to guess:
- Whether a move is continuation or just a pullback
- Whether momentum is still supported by capital
- Or when it is better to stay out of the market
3. Why many “good” strategies fail in practice
It is not because the strategies are wrong —
it is because they are applied in the wrong context.
A setup that works well in a trending market becomes dangerous when:
- Market structure breaks
- Large capital steps away
- Price enters a distribution phase
Strategies do not fail.
Context is what traders often misread.
4. Trading is less about action, more about patience
One of the most overlooked truths in trading:
Not trading is also a trading decision.
A strong strategy helps you:
- Wait for clear structure
- Avoid low-probability conditions
- Act only when the market offers a real edge
Trading success is not about doing more —
it is about acting at the right time.

XAUUSD – Top Asset to Watch in 2026If I had to choose one asset worth watching most closely in 2026 , I would not hesitate to name XAUUSD (Gold) .
Not because gold is “going up.”
Not because of FOMO.
But because gold is positioned at the intersection of capital flows, market psychology, and long-term economic structure .
This article is not meant to encourage trading , but to help you understand why XAUUSD deserves a serious place on the radar of both traders and investors in 2026 .
1️⃣ The 2026 Macro Landscape – Gold Is No Longer a Choice, but a Necessity
As we move into 2026, global markets are facing three major challenges :
🔹 An unclear monetary cycle
Interest rates may decline, but it is unlikely that we return to the “cheap money” era of 2020–2021.
Capital flows are becoming more cautious, prioritizing capital preservation over risk-taking .
🔹 Prolonged geopolitical and trade instability
Conflicts, trade wars, tariffs, and protectionist policies
→ No longer short-term events, but structural, long-lasting risks .
🔹 Gradual erosion of trust in fiat currencies
The USD is not collapsing — but absolute confidence is no longer guaranteed .
Even central banks are diversifying reserves and reducing dependence on a single currency.
👉 In this environment, gold does not need a reason to surge — it only needs no reason to be aggressively sold .
2️⃣ What Is Capital Flow Telling Us? – Gold Is No Longer a “Traditional Safe Haven”
What stands out is how gold’s capital structure has changed:
- Central banks have been consistently buying gold for years
- Gold ETFs are seeing capital inflows return
- Large funds view gold as a strategic hedge , not a short-term trade
📌 This leads to an important reality:
Gold is no longer reacting only to crises — it is being held with intention.
This is the foundation that allows XAUUSD to maintain a long-term trend , rather than producing short-lived spikes.
3️⃣ Market Psychology – When Traders Start Respecting Gold Again
For many years, gold was often seen as:
- Slow
- Difficult to trade
- Less attractive than crypto or equity indices
But that perception is changing .
Traders are increasingly realizing that:
- Gold responds very clearly to macro factors
- It reflects risk-on / risk-off sentiment effectively
- Liquidity is deep, spreads are stable
- Suitable for scalping, swing trading, and position trading
📈 When market psychology shifts, price behavior follows .
4️⃣ The Technical Perspective – XAUUSD Is Telling a Different Story
On higher timeframes:
- A higher high – higher low structure remains intact
- Pullbacks are corrective , not distributive
- Price consistently respects key demand zones
This suggests one thing clearly:
The market is not selling gold out of fear , but rather taking profits and re-accumulating at better levels .
That is the signature of a healthy trend , not a speculative market.
5️⃣ Why Is 2026 a “Special” Year for XAUUSD?
2026 is not a year of:
- A major crash
- An irrational bubble
Instead, it is a year defined by:
- Smart money
- Defensive positioning
- Trading based on structure and patience
👉 And gold fits this environment perfectly.
🎯 Conclusion – The Right Way to View XAUUSD in 2026
If you ask me:
- Should you go all-in on gold? → No
- Should gold be a core asset to monitor? → Yes
XAUUSD in 2026 is not about:
- Fast trades
- Catching tops and bottoms
It is about:
- Understanding capital flow
- Reading market psychology
- Trading with planning and discipline
The traders who survive are not the ones who make the most — but the ones who stay aligned with long-term capital flow.
And in 2026, XAUUSD may very well be on that side.
If you found this article valuable, feel free to leave a LIKE 👍 or COMMENT and share your perspective:
👉 Do you view gold as a short-term trading instrument, or a long-term strategic asset?
Wishing you a year of trading that is clear-minded, disciplined, and sustainable .

How to Avoid Losses in XAUUSDGold (XAUUSD) is one of the most attractive markets in the world.
High volatility. Clean technical reactions. Strong fundamental drivers.
But here’s the uncomfortable truth:
👉 Most traders don’t lose money on XAUUSD because gold is “too hard.”
👉 They lose because they approach gold the wrong way.
After years of trading and observing thousands of gold traders, I’ve noticed that losses on XAUUSD usually come from the same repeating mistakes.
This article is not about indicators or secret strategies.
It’s about how to stop bleeding money first.
1️⃣ Stop Treating Gold Like a Normal Forex Pair
Gold is not EURUSD.
And if you trade it the same way, losses are almost guaranteed.
XAUUSD has:
- Faster momentum
- Deeper liquidity grabs
- Strong reactions around news
Sudden expansions during sessions (especially London & New York)
Many traders lose because they:
- Use stops that are too tight
- Overtrade small fluctuations
- Panic during normal volatility
👉 Solution:
Accept gold’s nature.
Trade fewer setups, but give them proper room to work.
2️⃣ No Setup = No Trade (This Rule Alone Saves Accounts)
Most losses happen before the trade is even placed.
Ask yourself honestly:
- Did I enter because price hit my planned zone?
- Or because I felt like price was about to move?
- Gold punishes emotional entries harder than any other market.
Professional gold traders don’t trade “movement.”
They trade locations:
- Key support & resistance
- Clear market structure
- Areas where liquidity is likely to react
👉 If you don’t know where you’re wrong before entering, you’re gambling.
3️⃣ Risk Management Is More Important Than Being Right
This is the part many traders ignore — and pay for.
You don’t need to win often to survive XAUUSD.
You need to lose small when you’re wrong.
Common reasons traders blow accounts:
- Increasing lot size after losses
- Moving stop loss “just a little more”
- Trading multiple gold positions at the same time
👉 Gold rewards patience, not aggression.
One bad trade should never be able to destroy your week — or your mindset.
4️⃣ Stop Chasing Gold When It’s Already Running
Gold loves to move fast.
And that’s exactly why FOMO is so dangerous.
If you feel:
- Fear of missing out
- Pressure to “jump in now”
- Regret after watching price run
You’re already in danger.
Chasing gold often leads to:
- Buying at the top
- Selling at the bottom
- Emotional revenge trades
👉 Missed trades are part of the business.
Bad trades are optional.
5️⃣ Think in Series, Not in Single Trades
This mindset shift changes everything.
Losing traders ask:
- “Why did this trade fail?”
Consistent traders ask:
- “Did I execute my system correctly over 20 trades?”
Gold trading is not about one perfect entry.
It’s about repeating the same disciplined behavior over time.
👉 If your process is correct, results will follow — even after losses.
Final Thoughts: Gold Doesn’t Take Your Money — You Give It
XAUUSD is not your enemy.
It doesn’t hunt you.
It doesn’t know you exist.
Losses come from:
- Lack of patience
- Lack of structure
- Lack of discipline
If you want to avoid losses in gold, stop searching for “better entries” first.
Start by becoming a better trader.
Because in gold trading, survival always comes before profit.

ThE FORMULA – The Truth Behind “Making $1000 Daily”On TradingView, I see a lot of headlines like:
“Make $1000 a day” – “Daily profit guaranteed” – “Easy money.”
They sound attractive. But if making $1000 a day were truly easy, 90% of traders wouldn’t be blowing their accounts.
So what’s the truth behind the $1000/day number?
The answer lies in FORMULA, not magic.
F – FRAMEWORK (A Clear Trading System)
There is no $1000/day if you enter trades randomly.
Profitable traders don’t trade a lot — they only trade:
- The right market structure
- Familiar setups
- Predefined scenarios
👉 A solid system answers three questions:
- When do I enter?
- Where am I wrong?
- Where do I exit?
No framework → no consistent profits.
O – OPPORTUNITY (Trade Only Real Opportunities)
New traders look for trades every day.
Professional traders wait for opportunities every week.
The market doesn’t “pay” every day.
$1000/day doesn’t come from 10 small trades, but from:
- 1–2 trades at the right time
- A strong risk–reward ratio
- Real market momentum
👉 Not trading is also a trading decision.
R – RISK CONTROL (Risk Management Is the Foundation)
This is the most underestimated part — yet it decides everything.
Traders who survive aren’t those who win the most,
but those who lose the least when they’re wrong.
Simple rules:
- Risk only a small portion of the account per trade
- No all-in
- No revenge trading
👉 $1000/day means nothing if you lose $3000 tomorrow.
M – MINDSET (The Right Money Mindset)
A hard truth to accept:
You shouldn’t try to make $1000 every single day.
Professional traders don’t ask:
- “How much did I make today?”
They ask:
- “Did I follow my plan?”
- “Was I disciplined?”
- “Did I control my emotions?”
👉 When you focus on the process, money becomes the result.
U – UNFAIR ADVANTAGE (Your Edge)
You don’t need to be “smarter than the market.”
You just need to understand one thing better than the crowd:
- One timeframe you master
- One session you know well
- One setup you’ve traded hundreds of times
👉 Go deep in one thing, instead of knowing a little about ten.
L – LONG-TERM CONSISTENCY
$1000/day is not the goal.
It’s a byproduct of:
- Hundreds of disciplined days
- Dozens of well-managed losses
- A slow but steady equity curve
Real traders don’t brag about big winning days.
They’re proud of a smooth equity curve.
CONCLUSION – THE TRUTH ABOUT “$1000 DAILY”
$1000/day is not a promise.
It’s a milestone that appears only when:
You trade like a business,
not like someone chasing luck.
If you’re:
- Losing because of FOMO
- Blowing accounts due to no plan
- Exhausted from overtrading
👉 The problem isn’t that you’re not good enough —
it’s that you don’t have the right FORMULA yet.

PS Liquidity Zones In-Depth Tutorial XAUUSD, ES, NQ🧭 PS Liquidity Zones In-Depth Tutorial XAUUSD, ES, NQ
📌 This is a practical, trader-style guide for using ProjectSyndicate Liquidity Zones 1.0 on XAUUSD, ES, and NQ, then enhancing entries with confluence using Syndicate Order Block Finder and FVG Finder (NRP).
🧠 You’ll learn how to treat zones as liquidity magnets, how to avoid “touch-trading,” and how to build high-probability confluence setups that combine sweep behavior + structure shift + imbalance/OB retests.
Before we proceed ahead, add the PS Indicators to your ES / NQ / XAU M30 chart
so we are on the same page with the active zones.
Liquidity Zones | NRP | ProjectSyndicate
FVG Finder | NRP | ProjectSyndicate
Order Block Finder | Gold | ProjectSyndicate
________________________________________
💧 1) What Liquidity Zones are really showing
🎯 Liquidity Zones highlight areas where stop-loss orders cluster—usually around obvious highs/lows—making them prime targets for stop runs.
🧲 The core idea is not “zone = entry,” it’s: price is drawn to liquidity first, then it may reverse after it collects stops and shows confirmation.
🟦 Bull Liquidity Zones below price often represent sell-side liquidity being taken stops under lows, followed by potential reversal upward.
🟥 Bear Liquidity Zones above price often represent buy-side liquidity being taken (stops above highs, followed by potential reversal downward.
🔍 Think of zones as areas of interest where you hunt for sweep + reaction, not guaranteed turning points.
________________________________________
🧰 2) Fast TradingView workflow
🧩 Use a simple stacking approach so each tool has a clear job: Liquidity Zones = where, Structure = direction, FVG/OB = entry precision.
🧱 Recommended stack
• 🟦 Liquidity Zones 1.0
• ⚡ FVG Finder (NRP)
• 🧱 Order Block Finder (Gold version on XAUUSD)
⏱️ Timeframes
• 🧭 Context: H1 (and/or M30)
• 🎯 Execution: M15 or M5
• 🧼 Goal: high-quality zones + tight entries without clutter
________________________________________
📈 3) How to trade Liquidity Zones correctly 3 playbooks
🪤 Playbook A — Sweep → Rejection → Go
🏎️ Best for: quick reversals, clean sweeps, scalps.
• 🧲 Price pushes into a zone (ideally wicks through)
• 🕯️ Rejection candle prints (pin/engulf/strong close back out)
• 🎯 Enter on close (or small pullback)
• 🛑 Stop beyond the zone (or 1–2 ATR beyond)
• 🎯 Target next opposite zone or 2R
⚠️ Fails most often on strong trend days where price keeps running stops without reclaiming.
________________________________________
🔥 Playbook B — Sweep → MSS/CHOCH → FVG/OB Retest Entry
🏆 Best for: highest-quality entries on ES/NQ intraday and Gold reversals.
• 🪤 Sweep into zone (stops get taken)
• 📉 MSS/CHOCH shift appears on execution TF (direction changes)
• ⚡ Displacement prints an FVG (imbalance)
• 🧱 Displacement often defines an Order Block
• ✅ Entry triggers on FVG/OB mitigation
• 💎 Best case: FVG overlaps OB inside the Liquidity Zone
🎯 This is the “institutional-style” workflow: liquidity event → direction confirmation → precision entry.
________________________________________
🧲 Playbook C — Zone-to-Zone Targeting
🧘 Best for: range/rotation days, structured intraday conditions.
• 🎯 After sweep + confirmation, target the next opposite liquidity zone
• 🧠 Use zones as logical objectives instead of random exits
________________________________________
🧪 4) Confluence rules how to combine all 3 indicators without clutter
✅ Use a grading system so you only trade the best setups.
• 🟨 Grade 1 (OK): sweep + rejection candle
• 🟧 Grade 2 (Better): sweep + MSS/CHOCH shift
• 🟩 Grade 3 (Best): sweep + MSS/CHOCH + FVG + OB alignment + mitigation entry
🎯 Optional “sniper filters”
• ⏰ Prefer London/NY session sweeps
• 📍 Add PDH/PDL, round numbers, weekly levels
• 🧼 Prefer fresh FVGs (not repeatedly tapped)
________________________________________
⚙️ 5) Instrument-specific notes XAUUSD vs ES vs NQ
🥇 XAUUSD (Gold)
• ⚡ Gold often gives sharp sweeps and fast displacement
• 🧠 Map zones on H1, execute on M15, let price come back to FVG/OB
📈 ES (S&P 500 E-mini)
• 🧘 ES often respects cleaner rotation and structure
• 🧼 Keep fewer zones and prioritize the freshest areas
💻 NQ (Nasdaq 100 E-mini)
• ⚡ NQ is more volatile and “sweepy”
• ✅ Prioritize Playbook B and insist on confirmation
________________________________________
🧾 6) Two examples near current price areas (step-by-step)
📉 Example 1 — XAUUSD short: Buy-side sweep into Bear Liquidity Zone → FVG retest
🧭 Context: XAUUSD around ~4,595, with an overhead Bear Liquidity Zone roughly ~4,620–4,630.
🪤 What you wait for
• 🟥 Price runs into the zone, wicks through, then closes back below
• 📉 M5/M15 prints CHOCH/MSS down (structure shift bearish)
• ⚡ Bearish displacement prints a bearish FVG
🎯 Entry
• 🧲 Price retraces into the bearish FVG (mitigation)
• 🕯️ Short triggers on rejection / reclaim failure at the FVG
• ✅ Extra edge if FVG sits inside/near the Bear Liquidity Zone
🛡️ Risk & targets
• 🛑 Stop above sweep high / zone top
• 🎯 TP1 at nearby swing low / internal level
• 🎯 TP2 at next Bull Liquidity Zone below
________________________________________
📈 Example 2 — NQ long: Sell-side sweep into Bull Liquidity Zone → MSS → bullish FVG retest
🧭 Context: NQ around ~25,700, with a Bull Liquidity Zone below around ~25,590–25,620.
🪤 What you wait for
• 🟦 Price sells into the zone, wicks below, then closes back above
• 📈 M5 prints MSS up (breaks last lower high)
• ⚡ Bullish displacement prints a bullish FVG
🎯 Entry
• 🧲 Price pulls back into the bullish FVG (mitigation)
• 🕯️ Long triggers on reaction candle / reclaim after tapping the FVG
• ✅ Extra edge if OB overlaps the FVG near the zone edge
🛡️ Risk & targets
• 🛑 Stop below sweep low / zone bottom
• 🎯 TP1 at nearest prior high
• 🎯 TP2 at next Bear Liquidity Zone above
________________________________________
✅ 7) Daily checklist
🧭 Step 1 — Map
• 🧱 Mark the freshest 1–2 zones on each side from H1/M30
🧲 Step 2 — Wait
• 🪤 No sweep into a zone = no trade
🕯️ Step 3 — Confirm
• 📉 Take rejection (basic) or MSS/CHOCH (best)
🎯 Step 4 — Enter with precision
• ⚡ Prefer FVG mitigation; 🧱 bonus if OB overlaps
🛡️ Step 5 — Manage
• 🛑 Stops beyond invalidation; 🎯 targets at opposite zone / 2R / structure

XAUUSD Crash – Everything You Need To KnowDuring periods of extreme market volatility, there is no word that shocks traders more than CRASH. With gold (XAUUSD), every time rumors of a crash appear, the community splits into two camps: panic sellers and aggressive bottom-catchers. But the truth is this: most traders lose money not because gold crashes, but because they don’t understand the nature of a crash .
This article will help you understand XAUUSD crashes clearly, fully, and realistically—so you don’t become a victim of emotions.
1️⃣ What Is an XAUUSD Crash? (Understanding It Correctly)
An XAUUSD crash is not simply a strong price drop .
A true crash usually has three characteristics:
- Price drops very fast in a short period of time
- Large volatility, breaking multiple key support levels
- Liquidity explodes → many orders are wiped out simultaneously
Most importantly:
👉 A crash usually happens when the market is already imbalanced beforehand , not randomly.
2️⃣ Why Can Gold Crash? (Core Reasons)
No crash happens “out of nowhere.” With XAUUSD, crashes typically come from a combination of three factors :
🔹 1. Strong and Unexpected News
- The FED suddenly turns hawkish
- U.S. economic data comes in far better than expected
- Bond yields and the USD surge rapidly
➡️ Safe-haven capital flows out of gold in a very short time .
🔹 2. The Market Was Overheated Beforehand
- Price keeps printing new highs
- Retail traders FOMO into buy trades
- BUY stop losses are densely stacked below
➡️ One trigger is enough → a domino sell-off.
🔹 3. Liquidity Hunt
- Price breaks support without a pullback
- BUY stop losses are triggered in bulk
- Market makers “collect liquidity” within minutes
3️⃣ Does a Crash Mean a Long-Term Trend Reversal?
👉 In most cases, NO .
Many XAUUSD crashes are actually:
- Deep corrections within an uptrend
- Emotional flushes to clean the market
- A position reset before the next move
Common mistake:
Seeing a sharp drop → concluding “the trend is broken”
Reality:
A trend only breaks when major structure is destroyed and fails to be defended
4️⃣ Where Do Traders Usually Go Wrong During an XAUUSD Crash?
Here are four mistakes I see repeatedly:
❌ Chasing SELLs after price has already moved far
❌ Blindly catching bottoms without clear price zones
❌ Holding BUYs because “gold is a safe-haven asset”
❌ Failing to reduce position size when volatility spikes
A crash doesn’t kill unskilled traders,
👉 it kills undisciplined traders .
5️⃣ What Should You Do When XAUUSD Starts to Crash? (The Right Mindset)
Instead of asking: “Should I SELL now?”
Ask yourself:
- Is price breaking structure or just hunting liquidity?
- Where is the next major support zone?
- Is selling pressure still strong, or has distribution ended?
In many situations:
👉 Not trading is the best trading decision .
Long-term survivors are not those who catch perfect tops or bottoms,
but those who know when to stay out of the market .

HOW TO AVOID LOSSES IN THE XAUUSD MARKET1️⃣ Where XAUUSD Losses Really Come From
From my experience, losses in XAUUSD don’t come from gold itself — they come from the trader.
Most losses happen because of:
- Entering trades without a clear plan
- Making emotional decisions during volatile moves
- Ignoring proper risk management
Gold moves fast. If I make even a small mistake, the market will amplify it immediately.
2️⃣ Why Most Traders Lose Money Trading Gold
I’ve seen many traders struggle with XAUUSD for three main reasons:
- They don’t fully understand market structure and liquidity
- They become overconfident because gold “moves well”
- They refuse to accept stop-losses
Many traders tell themselves: “Gold will reverse soon.”
In reality, gold can keep running much longer than an account can survive.
3️⃣ My Core Rules to Avoid Losses in XAUUSD
These are the rules I strictly follow to stay consistent:
- I trade in the direction of the dominant trend
- I only enter at pre-defined key levels
- Risk management comes first — profit comes second
I keep my risk per trade small and controlled
No setup is ever worth risking my entire account.
4️⃣ Mistakes I Avoid When Trading Gold
❌ Chasing price during impulsive moves
❌ Holding losing trades during high-impact news
❌ Overtrading when liquidity is low
❌ Trading without a clear execution plan
These mistakes might not destroy an account instantly,
but they destroy consistency over time.
5️⃣ My Mindset When Trading XAUUSD
I treat gold trading as a game of probability, not prediction.
- Being wrong is part of the process
- Protecting capital is always my priority
- My goal is not to win every trade,
but to lose as little as possible when I’m wrong
📌 If this post helps you, feel free to leave a comment or follow for more gold trading insights.

Why Fibonacci Actually WorksHello everyone,
Throughout more than seven years of trading Forex and gold, Fibonacci has remained one of the very few tools I still use consistently today. Not because it is “magical,” but because when used correctly, Fibonacci reflects the behavior of large capital flows in the market quite accurately.
For me, Fibonacci is not a tool to predict where price will go. It is a tool to identify price zones with a higher probability of reaction—areas where the market may correct, consolidate, or continue the trend. It allows me to trade with a plan, rather than making decisions driven by emotion.
At its core, Fibonacci is used to measure pullbacks within an established trend. The market never moves in a straight line; large players always need retracements to lock in partial profits, rebalance positions, and attract additional liquidity. Fibonacci helps me quantify those pullbacks objectively, instead of relying on vague “gut feeling.”
My way of using Fibonacci is simple but effective. First, I only apply it when the market shows a clear trend. An uptrend must be defined by a sequence of higher highs and higher lows; a downtrend by lower lows and lower highs. If the market is ranging, I do not use Fibonacci at all. Then, in an uptrend, I draw Fibonacci from the swing low to the swing high; in a downtrend, from the swing high to the swing low. I do not pay attention to every level—my main focus is on the 50% and 61.8% zones (sometimes 38.2% when the trend is exceptionally strong).
The most important point: Fibonacci should never be used on its own. This is a very common mistake among newer traders. I never enter a trade simply because price touches a Fibonacci level. For me, Fibonacci only defines an area where I wait for confirmation. I observe price action when it aligns with other factors such as support and resistance, FVG, market structure, or candlestick signals like long wicks and clear rejection.
In practice, I see these scenarios all the time. In a strong uptrend, price rallies and then pulls back into the 50%–61.8% zone; if a clear rejection candle appears there, I look for BUY opportunities in line with the trend. With gold (XAU/USD), price often retraces quite deeply—many strong bullish legs actually start from the 61.8% area rather than from the highs. During high-impact news events, when price moves very fast, Fibonacci helps me avoid FOMO and stay patient, waiting for price to retrace into a reasonable zone before getting involved.
I paid a lot of “tuition” early in my trading journey by selling against the trend simply because I felt “price was already too high.” The market did not care about what I thought. It only cared about where the money flow was positioned. Only when I learned to use Fibonacci to trade with the trend—waiting for pullbacks instead of chasing price—did my results start to become more consistent.
What about you? Do you use Fibonacci as a direct entry signal, or as a proper confirmation zone to wait and read the market’s reaction?

Let the chart explainFirstly, HAPPY NEW YEAR!!
In terms of the chart, people seem not to understand - candlesticks provide a whole lot of info. The majority of indicators are reflections of old price action.
Last year I covered several posts on mechanical structures and the associated techniques. Here's one;
Let's give an example here using GBPUSD.
This is how you can simplify your trading.
First, identify the larger range.
There are two obvious things that stand out in this example; firstly the trend itself and secondly, the break of the structure that caused the new low.
The reason they are important is to show the momentum (orderflow), in other words, who's in control.
We could do this in several ways - the mechanical is just a simple way to allow you to repeat the same process almost on autopilot.
Once you can spot the obvious without much effort, the ranges become a lot easier and the analysis is done in under one minute.
Now I have my range, next step I can look for some rationale as to where and why a Pull Back is likely to come to.
For clarification
Just to show you, a simple way to do this is use the volume profile tool and just cover range high or low to the opposing high or low.
So why here?
Well, to understand this, there are some other interesting areas to look into, such as supply and demand (not for this post) but in simple terms, it was this supply that made the new low.
OK, so if you get this so far. Another post that might be useful for you is one of my posts from 2021 here on @TradingView. This, is a lesson on Dow Theory.
Once you understand the primary range is what was drawn, you can then shift your attention to the secondary trend.
If you remember, how we broke down the external range. You can now see an internal range formed.
If this low had been taken out - the story would be completely different. This would have given more reason for the Pullback to be over and done with.
But in the example, the low held and that means it is still in the Pullback phase. So, unless the larger range high in broken. Indicating a larger trend shift.
The logic is simple, look for changes of character on the smaller ranges and watch them fall like dominoes. Once the secondary trend switches to your favour (back down, in the example) then you have some good, high probability setups on the cards.
Happy New Year to you all, again!
2026 is going to be another AWESOME YEAR!!!
Disclaimer
This idea does not constitute as financial advice. It is for educational purposes only, our principal trader has over 25 years' experience in stocks, ETF's, and Forex. Hence each trade setup might have different hold times, entry or exit conditions, and will vary from the post/idea shared here. You can use the information from this post to make your own trading plan for the instrument discussed. Trading carries a risk; a high percentage of retail traders lose money. Please keep this in mind when entering any trade. Stay safe.

the Fed faces another slew of challenges in the year aheadThe Federal Reserve heads into 2026 facing a slew of political and policy challenges, headlined by a new chair and an economy fed by both tailwinds and headwinds that will make policymakers’ choices all the more important.
Coming off three consecutive interest rate cuts, the central bank is expected to follow a more tepid path for the year ahead in which additional cuts could be hard to come by considering expectations for solid growth and ongoing inflation pressures.
One thing does seem certain: After a year of extraordinary upheaval surrounding the Fed, 2026 looks to offer more of the same.
“I do think there’ll be a big spotlight. There’ll be lots of intrigue,” said Kathy Bostjancic, chief economist at Nationwide. “There’s still a lot of uncertainty that keeps the Fed in the spotlight, and probably in the hot seat too.”
The previous year saw the Fed come under that spotlight in ways that it never had before.
As he started his second term at the White House, President Donald Trump repeatedly threatened to fire Fed Chair Jerome Powell for not being quicker to push for interest rate cuts. Around mid-year, the Fed came under fire again, this time for cost overruns at a renovation project it had undertaken at its Washington headquarters.
In between, Trump tried to remove Governor Lisa Cook over allegations — as yet unproven and not even brought as formal charges — that she committed mortgage fraud. That all came against a backdrop of who would succeed Powell as chair when his term expires in May, with as many as 11 candidates considered during an interview process led by Treasury Secretary Scott Bessent.
If all that sounds exhausting, consider that 2026 begins with a Supreme Court hearing scheduled for Jan. 21 to decide whether Trump has the authority to remove Cook. A week later, the Federal Open Market Committee holds its interest rate vote. At some point during the month, Trump is expected to unveil his choice for Fed chair. And Powell, cagey on the issue so far, also will have to disclose whether he plans on serving out his term on the Board of Governors that runs until January 2028.
There also have been multiple dissents at recent rate votes, and new regional presidents set to come on board at the FOMC have a hawkish bent, meaning they’re likely to resist additional cuts.
“It’s still a tough spot for the Fed,” Bostjancic said.
Focus on policy
Still, when it comes to policy, most on Wall Street expect the Fed to put the noise in the background and continue down the road of lowering its benchmark interest rate just a bit more until it gets closer to a neutral level around 3%. Neutral is considered a spot that neither boosts nor holds back economic activity, and the funds rate is just half a percentage point above where most on the FOMC see the rate landing over the long term.
“Chair Powell helped orchestrate three 25-basis-point rate cuts in a row. It’s not as if he was standing in the way of the FOMC cutting rates,” Bostjancic said. As far as further cuts go, “For us, it’s the economic data.”
Bostjancic sees the data pointing to two cuts this year, one around mid-year and another toward the end. The Fed’s “dot plot” grid of expectations indicates just one cut, while outliers such as Moody’s Analytics chief economist Mark Zandi and Citigroup seeing labor market weakness pointing to three.
Powell and his colleagues have stood by the notion that they won’t be bullied into cuts and indeed will be guided by data.
Torsten Slok, chief economist at Apollo Global Management, thinks the economy will be too strong for the Fed to cut much more, seeing just one reduction ahead.
“The issue is that the winds are really changing for the U.S. economy,” Slok said during a CNBC interview Friday.
Whereas 2025 saw headwinds of tariffs, inflation and a general air of uncertainty, fiscal stimulus and a stabilizing labor market will be pushing on growth, he said.
“It is, in my view, looking like more that the tailwinds are beginning to accumulate and making it more difficult for the Fed to cut rates this year,” Slok added.
The role of AI
One wildcard will be the role that artificial intelligence plays on economic growth.
Seen as both a productivity enhancer and a potential impediment to hiring, assessing the impact AI is having on the economy will be paramount for the Fed, said Joseph Brusuelas, chief economist at RSM.
“The Fed this year has got a real challenge in terms of communicating their strategy,” Brusuelas said. “We have this massive investment flowing into very sophisticated technologies, and the Federal Reserve is going to need to communicate their basic view on what this means.”
After sputtering at the beginning of 2026, the economy grew rapidly in the middle two quarters and is on pace to accelerate at a 3% pace in the fourth quarter, according to preliminary data from the Atlanta Fed.
In addition to helping push along the broader economy, AI-related stocks were a key highlight of another stellar year on Wall Street that saw major averages post double-digit increases.
Calibrating monetary policy in that kind of environment will be tough, Brusuelas said.
“They’re going to need to provide strategic direction for the central bank at a time when the economy is clearly pivoting towards the integration of this sophisticated technology in the production of goods and provision of services,” he said. “This is a really big potential pivot around policy that needs to happen.”

Unlock Fibonacci Retracement: Predict Pullbacks & TargetsFibonacci Retracement is a powerful tool based on mathematical ratios from the Fibonacci sequence. It helps identify potential support/resistance levels during price pullbacks in trends.
Key levels: 23.6%, 38.2%, 50%, 61.8%, 78.6% (and extensions like 161.8%).
Draw from swing high to low (or low to high) – perfect for spotting entries in Forex, Crypto, and Stocks.
How Fibonacci Works (Quick Setup)
On TradingView: Use the Fib Retracement tool. Select recent high/low points. Levels auto-plot where price might bounce or reverse.
Key Strategies
1- Pullback Entries
Buy at 38.2% or 61.8% in uptrends; sell in downtrends.
2- Target Projections
Use extensions (100%, 161.8%) for take-profits beyond the swing.
3-Confluences
Combine with S&R, RSI, or MAs for stronger signals.
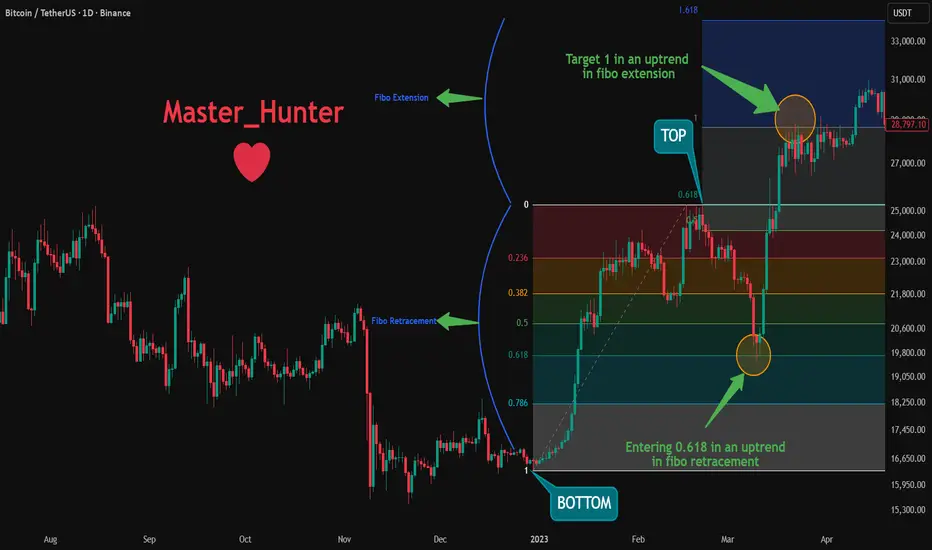
Real Examples Right Now (Jan 3, 2026)
Bitcoin BINANCE:BTCUSDT :
Between 30 Dec 2022 and 20 Feb 2023 We saw a pullback from top to the 0.618 Fibonacci level.
We also saw a hit to the 1st Fibonacci Extension level as a target on March 22, 2023.
Pro Tips
Use in trending markets; avoid choppy ranges.
Adjust for volatility: Shorter swings in Crypto, longer in Stocks.
Confirm with volume – strong moves break Fib levels.
Backtest on historical charts to master it!
Add Fib to your toolkit today and nail those pullbacks!
What's your best Fib win? Share in the comments! 👇
Why You Need to Know Elliott WavesThis is an introductory article in a series on Elliott Waves, designed to explain the basics of the theory and how to apply it in practice.
We will cover the key points you’ll encounter while learning this theory and developing your trading skills.
Definition
Elliott Wave Theory is a method of technical analysis that explains price movements through repeating wave patterns that reflect crowd psychology.
Learning
Like anything new, learning this requires dedicated time. It involves identifying waves, counting them, and spotting corrections - a process that can be very engaging. You won’t immediately see waves and subwaves or find the perfect entry points. Be patient and give your mind time to grasp the concepts. Over time, recognizing familiar structures on charts becomes so absorbing that you won’t want to stop analyzing.
Technical Level
Anyone can learn this theory, regardless of their starting skill level. Prior knowledge of technical analysis is helpful but not required. Elliott Wave Theory offers a different perspective on the market and, for some, can become the primary way to interpret price movements. Since it is a popular method, you have many tools on TradingView for analysis and forecasting.
Reducing Noise
Another key advantage is reducing unnecessary information. When working with charts, you don’t need to overload your mind with news or market data. Chart analysis can reveal more than external reports. Imagine trying to track multiple markets across exchanges and countries - the context could be overwhelming. Elliott Waves help simplify this process. You can analyze independently, relying solely on the chart.
Universality
With this knowledge, you can trade any instrument - futures, options, indices, stocks, gold, silver, or cryptocurrencies. Some assets may require more effort to discern the wave structure, while others show clear patterns immediately.
Everyday Applications
Wave patterns can appear everywhere: price charts for household goods, car parts, flu incidence, or livestock growth. Life itself is a series of waves - rises and falls, successes and setbacks. Recognizing these patterns can help you understand and anticipate changes in many areas.
Mistakes
Mistakes are inevitable. You cannot avoid them. Whatever strategy you choose, whatever experience you have, Elliott Wave Theory will help you learn from them, and over time, your errors will become less significant.
Timeframe
This approach works on any timeframe - minute, hourly, or weekly. Smaller timeframes are useful for trading, while larger timeframes reveal trends that can span years. You can anticipate market behavior and understand economic or political trends locally and globally. Local patterns are always linked to the bigger picture.
Human Weaknesses
Fear and greed are obstacles every trader must overcome. Knowledge and recognition of patterns provide a foundation to regulate behavior. Without this foundation, achieving goals is difficult - whether in trading or in other areas of life.
Discipline
Discipline is essential. Even if you are naturally unsystematic, accurately identifying waves and choosing entries at the right time and place will gradually develop discipline and prevent random trading.
Calmness
By mastering your weaknesses and developing discipline, you will gain calmness - a critical skill for any trader. You will understand when the market may reverse, anticipate corrections, and know the general direction. While others panic, you will remain calm and act confidently.
Money
Elliott Wave Theory helps you preserve and grow your capital, turning the waves on the chart into financial waves in your life. The key is consistent effort and dedication, just as in any other discipline.
Magic
This may seem like magic, but it isn’t. This is the result of careful work and analysis, not magic. Another important point: if this theory did not work, it would have long been forgotten. On the contrary, the most successful traders use wave analysis in their market strategies. Elliott Wave Theory is a “superpower” that can surprise both others and yourself.
Conclusion
Elliott Wave Theory is not a magic solution and offers no absolute guarantees. It is a tool that must be learned and applied correctly. Experience and accurate wave identification are essential, and it can be combined with other technical analysis methods.
Perhaps this is the gold you’ve been searching for.
Future articles will show live examples of how it works.
It will be very interesting, so stay tuned and don’t miss out.

Happy New Year 2026 — Trade Smart, Stay Disciplinedwe step into 2026, may clarity replace noise, patience replace haste, and execution replace hesitation.
May every trade be planned, every risk calculated, and every loss treated as tuition—not failure. Wishing all traders a year of emotional control, consistent decision-making, and an equity curve that trends steadily upward.
Happy New Year 2026 — trade smart, manage risk, and let probabilities work in your favor.

Happy New Year 2026 TRADERSAs we close the chapter on 2025, it’s worth acknowledging what this year truly tested — not just strategies, but discipline, patience, and emotional control. The market offered moments of clarity and long stretches of uncertainty, sharp trends followed by brutal consolidations, and powerful macro moves that rewarded preparation while punishing impulse. Every win came from respecting structure, and every loss carried a lesson for those willing to learn from it.
To all traders who stayed committed to the process managing risk, protecting capital, and waiting for high-probability setups this year has strengthened you more than any single trade ever could. Progress in trading is built quietly, over time, through consistency and self-control.
As we step into 2026, may your decisions be calm, your risk disciplined, and your confidence grounded in experience rather than emotion. May you trade with clarity, adapt quickly, and continue evolving with the market. Wishing every trader health, resilience, and a year ahead filled with focus, growth, and sustainable profitability.
HAPPY NEW YEAR 2026

News Only Matters When It Breaks Market StructureDow × News × Market Structure
In trading, news is not powerful because the numbers are big or small. Most information is already priced in by the market. What truly determines the impact of news is not the headline itself, but whether it forces the market to change its existing structure.
According to Dow Theory, a trend remains in place until there is clear evidence of reversal. This leads to a simple reality: good news will not push price higher if the primary trend is still bearish, and bad news will not crash the market if a bullish structure remains intact.
That is why market reactions to news often look “strange.” Sometimes CPI comes out better than expected and price barely moves. Other times bad news hits and price only shakes briefly before continuing in the same direction. The issue is not that the news is wrong, but that it is not strong enough to break the current structure.
News only becomes meaningful when it does one of two things: breaks a key high or low, or ends an existing sequence of higher highs–higher lows or lower highs–lower lows. When price closes beyond the old structure, the market has accepted new information and entered a different phase of movement.
On the other hand, if price spikes on news and then quickly returns to the prior range, the structure has not changed. These moves are mostly noise—emotionally charged, but trendless. The market is merely releasing energy, not changing direction.
In practice, many of the strongest moves actually come from news that is not particularly surprising. That is because the structure was already in a vulnerable state. The news acts as the final catalyst, not the root cause.
So the real task is not “trading the news,” but reading the structure before the news hits. Define the trend using Dow Theory, mark the key structural levels, and then observe whether the news has enough force to break them. Only when structure changes and price confirms does news truly gain trading value.
The strongest news is not the one that creates the biggest volatility, but the one that forces the market to change how it moves. If structure is not broken, every reaction is just an opinion. Only when structure fails does the market give a real answer.

2025 Scoreboard: Year’s Top Winners and Biggest LosersIn 2025, money flowed to safety and profits (metals, stocks) 🚀 and away from high risk (altcoins, most crypto) 📉.
Scoreboard: who won 2025? 📊
- 🥈 Silver: +160%
- 🥇 Gold: +65%
- 🧱 Copper: +43%
- 💻 Nasdaq: +20%
- 📈 S&P 500: +16%
- 🧬 Russell 2000: +13%
- ₿ Bitcoin: −6%
- Ξ Ethereum: −12%
- 🪙 Altcoins: −42%
So: metals and stocks = strong green ✅, crypto = mostly red ❌, especially altcoins.
Why metals pumped so hard 🪙🚀
- People wanted safety, not lottery tickets.
When there is fear about inflation, wars, or central banks, investors rush into gold and silver as “real” money that existed for centuries.
- Metals have real‑world demand.
Silver and copper are needed for solar, EVs, electronics etc., so there is constant buying from industry, not just traders.
Result: a huge wall of money moved into metals, pushing them up far more than Bitcoin.
Why stocks did well 📈💼
- Big Tech keeps making real profits.
AI, cloud, chips and software companies are printing earnings, so investors feel comfortable paying higher prices for their shares.
- Easy to access, easy to trust.
Anyone can buy an S&P 500 ETF in their pension account; rules are clear, liquidity is huge. That means constant passive inflows, even when crypto looks scary.
So stocks became the “default” risk trade, while crypto was left aside.
Why BTC and ETH only dipped a bit
- They are the “blue chips” of crypto.
When crypto is out of favor, funds usually sell altcoins first and keep more BTC and ETH, because they are the most liquid and most trusted.
- Still seen as long‑term bets.
Even in a bad year, many investors believe Bitcoin and Ethereum can recover, so they don’t panic‑dump as hard as they do with small caps.
That is why BTC −6% and ETH −12% look “ok” compared with altcoins −42%.
Why altcoins were destroyed 🧨🪙
- Highest risk, so they get sold first.
When people de‑risk, the order is usually: sell altcoins ➝ then BTC/ETH ➝ maybe later reduce stocks. Altcoins sit at the very end of the risk curve.
- Bad tokenomics + unlocks.
Many altcoins still release new supply to VCs, teams, or farmers. In a weak market, those extra tokens just crush price.
- Old narratives, no real users.
A lot of 2021 themes (random L1s, dead metaverse projects, copy‑paste DeFi) lost momentum. With little real usage, there were more sellers than buyers all year.
End result: altcoins became the worst‑performing major asset class of 2025.
The simple lesson for traders 🧠
- In “fear” years, money runs to real assets and profitable companies (metals, strong stocks) 🛡️.
- In those phases, crypto – especially alts – behaves like leverage on risk and gets hit the hardest 💣.
So for the next cycle, think in levels of risk:
cash → metals → big stocks → BTC/ETH → altcoins.
When the macro mood turns defensive again, rotate up this ladder instead of holding the riskiest coins and hoping.

Investment Logic: Why Gold Leads This Market CycleInvestment Logic Explained: Metals as the Preferred Asset in This Cycle
The performance gap shown in the table is not accidental. It reflects a clear capital rotation driven by macroeconomic realities in 2025. While equities and Bitcoin struggled to generate real returns, precious metals led by gold emerged as the dominant beneficiaries of this cycle. This shift is rooted in monetary policy, geopolitical risk, and the market’s renewed focus on capital preservation rather than speculation.
Gold: The Core Beneficiary of the 2025 Macro Environment
Gold’s +67.3% appreciation this year is a direct response to persistent global uncertainty and a structural shift in monetary expectations. Central banks maintained a cautious stance as inflation remained sticky, while real yields compressed amid expectations of policy easing into 2026. In this environment, gold regained its role as the primary store of value offering protection against currency debasement, sovereign risk, and declining confidence in fiat systems.
Importantly, gold’s rise was not driven by hype or leverage. It was supported by sustained institutional demand, central bank accumulation, and a steady increase in long-term holdings. This is the hallmark of a healthy, macro driven trend rather than a speculative rally.
Silver and Platinum: Beta Plays on the Same Thesis
Silver and platinum significantly outperformed gold, but their gains should be viewed as extensions of the same macro logic. As confidence in hard assets strengthened, capital flowed into metals with tighter supply dynamics and industrial demand exposure. These moves typically follow gold’s lead in the later stages of a precious metals cycle amplifying returns but also volatility.
For professional traders, gold remains the anchor. Silver and platinum offer upside asymmetry, but gold defines the directional bias of the entire metals complex.
Why Equities and Bitcoin Lagged
The S&P’s modest +17.7% gain underscores a year dominated by valuation compression rather than expansion. Elevated rates, earnings uncertainty, and geopolitical risk limited upside. Bitcoin’s −9.3% decline further highlights the difference between speculative assets and defensive capital. As liquidity tightened and risk appetite normalized, capital favored assets with intrinsic value and macro credibility areas where gold excels and Bitcoin currently does not.
Professional Takeaway: This Is a Capital Preservation Cycle
This cycle is not about chasing exponential upside. It is about protecting purchasing power, managing risk, and aligning with macro flows. Gold sits at the center of this framework. Its performance reflects disciplined capital allocation by institutions, not retail enthusiasm. Until global monetary stability is restored and real yields turn decisively positive, gold is likely to remain a preferred asset.
For traders, the message is clear: follow structure, follow liquidity, and respect macro regimes. In 2025, gold was not just a trade it was the benchmark for intelligent capital positioning.

DOW THEORY – THE FOUNDATION OF TREND READING1. The Market Moves in Trends – Not Randomly
Price does not move randomly. What looks like chaos is simply organized collective behavior.
A trend exists only when price structure is respected:
Uptrend: Higher Highs & Higher Lows
Downtrend: Lower Highs & Lower Lows
As long as this structure remains intact, the trend is still valid, regardless of news, opinions, or emotions.
2. Every Trend Has Three Levels of Movement
Markets operate across multiple time layers simultaneously:
Primary Trend: The dominant direction (weeks to months)
Secondary Move: Corrections against the main trend
Minor Swings: Short-term noise
Most traders lose money because they trade against the primary trend, reacting emotionally to minor fluctuations and mistaking them for reversals.
3. The Three Psychological Phases of a Trend
A trend evolves through three distinct phases:
🔹 Accumulation
Smart money builds positions quietly
Sideways price action, low volatility
Minimal public interest
🔹 Participation
Trend becomes obvious
Breakouts occur
This is where most profits are made
🔹 Distribution
Late buyers enter emotionally
Volatility increases
Smart money exits
Understanding these phases helps traders avoid buying tops and selling bottoms.
4. Structure Is the Only Valid Trend Confirmation
A trend is not confirmed by indicators.
A trend is confirmed when:
- Price breaks structure in the trend direction
- Pullbacks respect previous swing levels
- Momentum continues after corrections
If structure is not broken, there is no reversal only a correction.
This is why predicting tops and bottoms is dangerous.
5. Volume Confirms Direction — Not Timing
Volume does not tell you when to enter — it tells you whether the move is real:
- Rising volume with the trend → confirmation
- Weak volume during pullbacks → healthy correction
- High volume against structure → warning sign
Price leads. Volume confirms.
HOW TO APPLY DOW THEORY IN REAL TRADING
A simple, repeatable framework:
1. Identify the dominant trend (HH/HL or LH/LL)
2. Wait for a correction, not a reversal
3. Enter only after structure resumes in trend direction
4. Place stop-loss where structure becomes invalid
5. Hold until the market changes structure
No prediction. No guessing.
Just reading what price is already telling you.

Unlock MACD Mastery: Catch Trends Before They ExplodeThe Moving Average Convergence Divergence (MACD) is a trend-following momentum indicator that shows the relationship between two moving averages of a security’s price.
It consists of:
MACD Line: 12-period EMA minus 26-period EMA
Signal Line: 9-period EMA of the MACD Line
Histogram: MACD Line minus Signal Line
MACD helps spot buy/sell signals, trend strength, and reversals – essential for Forex, Crypto, and Stocks.
How MACD Works (Quick Setup)
Add MACD(12,26,9) on TradingView. Positive histogram = bullish momentum 📊. Negative = bearish 📉.
Key Strategies
1-Line Crossovers
Bullish: MACD crosses above Signal → Buy signal.
Bearish: MACD crosses below Signal → Sell signal.
2-Divergences
Bullish: Price lower lows, MACD higher lows → Potential reversal up.
Bearish: Price higher highs, MACD lower highs → Potential reversal down.
3-Zero Line Crossovers
Above zero = Bullish trend strength.
Below zero = Bearish trend strength.
Real Examples Right Now (Dec 27, 2025)
Bitcoin ( BINANCE:BTCUSDT )
*** In the chart which you see, I I have highlighted key points including MACD Line, Signal line, Crossover, Divergence and Histograms. ***
⚠️As you can see in the chart, MACD send the bearish signal in BTC'S ATH (All Time High) on around 6th October.
Pro Tips
Combine with RSI or support/resistance for confirmation.
In trending markets like Stocks, focus on crossovers; in ranging markets like Forex, use divergences.
Adjust periods for volatility (e.g., MACD(5,35,5) for Crypto).
Always backtest – don't trade blind!
Level up your charts with MACD today and ride the trends!
What's your go-to MACD setup? Share below! 👇

The Impact of Overtrading on Trading PerformanceMost traders don’t lose because they lack knowledge. They lose because they trade too much.
Overtrading is one of the most common, yet least talked-about reasons why trading performance slowly deteriorates over time.
Overtrading is not about skill – it’s about behavior
Overtrading doesn’t mean you don’t understand the market.
In fact, many traders who overtrade know quite a lot.
The problem starts when:
You stay in front of the screen for too long
You feel the urge to always be “in a trade”
You confuse activity with productivity
At that point, trading becomes reactive , not strategic.
More screen time does not equal better performance.
Often, it leads to fatigue, impulsive decisions, and emotional trades that were never part of the original plan.
Avoid impulsive decisions – the real damage of overtrading
One of the biggest impacts of overtrading is impulse trading.
This usually shows up when:
You enter trades without a clear setup
You chase price after missing a move
You trade just to feel involved
Impulsive trades rarely come from a strong edge.
They come from emotions : fear of missing out, boredom, frustration, or the desire to “do something.”
And emotions are the fastest way to destroy consistency.
Prioritize your trades, not the number of trades
Professional traders don’t aim to trade more.
They aim to trade better .
That means:
Selecting only high-quality setups
Ignoring average or unclear conditions
Accepting that most market movements are not worth trading
Every trade should earn its place.
If a setup is not clear, not aligned with your plan, or not offering a real edge, it should be skipped.
Fewer trades, but better trades, lead to better performance.
Learn from mistakes instead of repeating them
Overtrading often creates a dangerous cycle:
Trade too much → Make small mistakes → Lose confidence → Trade even more to fix it.
Breaking this cycle requires stepping back and reviewing:
Why you entered certain trades
Whether they followed your rules
What emotional state you were in
Mistakes are not the problem.
Failing to learn from them is.
Trading improves when reflection replaces reaction.
Why reducing screen time improves trading performance
One of the most effective changes I ever made was simply reducing screen time.
Less screen time means:
Fewer impulsive entries
Better emotional control
Clearer decision-making
You don’t need to watch every candle.
You only need to be present when your setup appears.
Sometimes, the best trade is no trade at all.

Gold in Price Discovery: Why Old Trading Logic FailsMost traders are used to trading gold within familiar price zones. In those areas, the market has history — clear support and resistance, prior highs and lows, and “price memory” to anchor expectations. Every move is referenced to something that happened before: where price once reversed, where heavy selling appeared, where a top was previously formed.
But there are phases when gold moves beyond all of those known levels. No historical reference ahead, no familiar zone to anchor bias. At that point, the market shifts into a different state — price discovery .
And it is precisely during this phase that many traders start losing money, even though the trend looks “obvious” on the surface.
Price discovery is not just a strong rally
Many people equate price discovery with a breakout. In reality, a breakout is only the moment the door opens. Price discovery is the path beyond that door — when the market has entered entirely new territory.
In this state, familiar reference points fade away. There is no clear resistance, no previously tested zone, and no level that truly feels “safe” to label as cheap or expensive.
Price is no longer reacting to the past. It is searching for a new equilibrium — a level the market is testing to see whether it can be accepted.
What really changes in price discovery
The biggest change is not the speed of price, but how capital participates.
In familiar ranges, traders react to levels: buy at support, sell at resistance. Expectations are built on what has already happened.
In price discovery, large capital no longer reacts to touches. It positions. Decisions are not based on whether price feels high or low, but on whether the market continues to accept the new price zone.
That is why profits in this phase do not come from catching exact tops or bottoms, but from the ability to hold positions while the market has not shown rejection.
This is also why many traders:
– Identify the trend correctly
– Exit too early
– Or repeatedly sell against it simply because price “feels too high”
The most common mistake in price discovery
The issue is not technical analysis, but risk assessment.
Many traders measure risk by how far price has already moved — how much it has risen, how far it is from the old base, how “high” it looks. In price discovery, that logic no longer applies.
High price does not equal high risk.
Real risk only appears when the market begins to reject the new price level — something that often has not happened yet in this phase.
Applying old logic to a new market regime causes many traders to stand on the wrong side of dominant capital flows.
What the market is actually testing?
At this stage, the market is not asking, “How much further can price go?”
The core question is: Is the current price level being accepted?
If it is accepted, price continues to expand.
If it is rejected, the market can return to prior zones quickly and aggressively.
Many traders lose not because they miss the trend, but because they are answering the wrong question.
The right approach during price discovery
Trading in this phase is no longer about finding the “perfect” entry. The focus shifts to:
– patience
– position management
– and reading price reaction instead of guessing targets
Those who try to appear smart by selling against the move simply because price feels high usually exit the game early. Those who accept that they do not know how far price can go — but clearly understand when the market has not rejected it — are the ones who can stay with the trend long enough.
When gold enters price discovery, the question is no longer, “How much higher can gold go?”
It becomes: “Has this price level been rejected yet?”
If the answer is still NO , everything else is just personal opinion.

Unlock RSI Secrets: Spot Overbought & Oversold Trades Like a ProThe Relative Strength Index (RSI) is a momentum oscillator that measures the speed and change of price movements.
It ranges from 0 to 100:
Above 70 = Overbought (potential sell signal) 📈⚠️
Below 30 = Oversold (potential buy signal) 📉🛡️
RSI helps you avoid chasing highs or panic selling lows – perfect for Forex, Crypto, and Stocks.
How RSI Works (Quick Calc)
RSI = 100 - (100 / (1 + RS))
Where RS = Average Gain / Average Loss over 14 periods (default).
No math needed – TradingView does it for you! Just add the RSI indicator.
Key Strategies
1- Overbought/Oversold Entries
Enter sells above 70, buys below 30 – but wait for confirmation (e.g., price reversal).
2- Divergences
Bullish: Price makes lower lows, but RSI makes higher lows → Buy signal.
Bearish: Price higher highs, RSI lower highs → Sell signal.
3- Centerline Crossovers
RSI above 50 = Bullish trend
Real Examples Right Now
Bitcoin (BTC/USD): RSI(14)
*** In the chart you see, I have highlighted key areas including overbought and oversold areas, divergence, and also the center line which is colored yellow.***
Pro Tips
Use RSI with other tools (e.g., support/resistance or MACD) for better accuracy.
In volatile markets like Crypto, adjust periods (e.g., RSI(7) for shorter trades).
Avoid trading solely on RSI – always check volume and news.
Backtest on historical charts to see how it performs in your market.
Add RSI to your charts today and level up your edge!
What's your favorite RSI strategy? Share in the comments! 👇
