Indicator Decoded: RSI Mega Zones: Signals from the EdgeMost traders are familiar with the textbook RSI levels—70 indicating overbought and 30 indicating oversold. But markets, especially in strong momentum phases, do not always obey these boundaries. That is where the concept of Mega Overbought and Mega Oversold zones becomes vital. These are not fixed thresholds, but adaptive zones often beyond 80 and below 20, where the RSI reflects extreme strength or weakness. Rather than acting as reversal points, these levels often signal trend continuation.
A reading above 80 is typically seen during powerful uptrends or post-breakout rallies. It indicates not just buying, but unhesitating, aggressive demand, especially after key resistance zones have been cleared. Such RSI levels have often not been seen in several months—if not more than a year—making their appearance especially significant. Rather than a signal of exhaustion, this may be the start of a major trend, suggesting that the broader structure of the stock or index has shifted decisively. Traders who misinterpret this as a reversal signal often find themselves fighting momentum. Instead, price tends to grind higher, sometimes pausing briefly before further gains. This is why the chapter suggests using Mega Overbought zones as confirmation of bullish control, not a trigger for counter-trades.
The inverse applies to the Mega Oversold zone—RSI falling below 20. This is usually not a buy-the-dip moment, especially if the broader trend and chart structure are bearish. Such readings typically accompany panic-driven breakdowns, where sellers dominate without any counterforce. These extreme values are often rare and may not have appeared for months or even over a year, marking a moment where the market’s character may be undergoing a structural change. As with Mega Overbought, context is critical. If RSI hits such depths after prolonged distribution or a topping pattern, it does not indicate value—it confirms that the tide has turned, and a strong downtrend may be setting in.
Both Mega zones are best used in conjunction with structure—trendlines, volume shifts, anchored VWAP zones, or price patterns. The RSI alone is not enough. But when it aligns with other technical signals, a Mega Overbought or Oversold status becomes a momentum amplifier, not a contrarian prompt. In fact, your RSI chapter rightly warns that entering against such zones can be fatal unless clear divergences, climax patterns, or volume exhaustion are also present. Think of these extremes not as ceilings or floors, but as accelerators when backed by structure.
A word of caution: These signals are rare and often widely spaced. The real challenge lies in managing risk–reward, as strong momentum and shallow pullbacks can make it difficult to find entries with favourable R:R ratios.
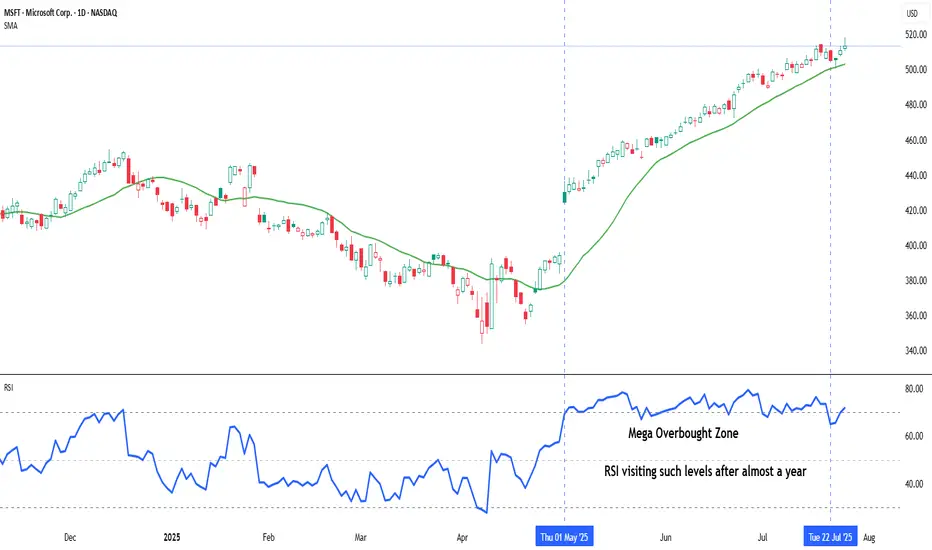
Chart: Microsoft Corp. (MSFT) – Daily Chart with 20-DMA and RSI (as on July 25, 2025)
Microsoft continues its strong upward trajectory, with price action staying well above the rising 20-day simple moving average. The recent surge in RSI into the mega overbought zone marks a significant shift in momentum, as the indicator revisits such elevated levels after nearly a year—an occurrence that often coincides with extended bullish phases.
Microsoft (MSFT)
BIG POST! | How To Beat SP500?
S&P 500 Performance: +35% since 2022.
My Selected Portfolio Performance: +62%, with an 82% hit rate.
Top Performing Stocks: NVDA (+735%), ANET (+343%), META (+209%), and more.
Technical Analysis Tools Used: Price action, trendlines, Fibonacci levels, round numbers, and more.
It’s been nearly three years since I posted my analysis of S&P 500 stocks on February 23, 2022. Back then, I reviewed all 500 stocks, applied some quick technical analysis, and identified 75 stocks that stood out for me. Importantly, I relied solely on technical analysis to make my picks. Fast forward to today, and the results speak for themselves. Most of these selections have significantly outperformed the broader market, proving the power and importance of technical analysis.
While many investors rely solely on fundamentals, technical analysis brings a dynamic edge that’s often underestimated. By focusing on price action and market behavior, technical analysis allows us to spot opportunities that others might miss, especially it gives a massive psychological edge while the markets are making corrections. The market doesn't care what you know, the market cares what you do!
Here’s what I used for my analysis:
It's kind of pure price action - previous yearly highs, trendlines, a 50% retracement from the top, round numbers, Fibonacci levels, equal waves, and channel projections. For breakout trades, determined strong and waited for confirmation before pulling the trigger.
The Results
While the S&P 500 has gained around 35% over this period , my selected stocks from the same list have made +62%! Out of the 75 stocks I picked, 67 have hit my target zones and 54 are currently in the green. That’s an 82% hit rate, and for me, that’s a good number!
Now, for those who favor fundamental analysis, don’t get me wrong, it has its place. But remember, fundamentals tell you what to buy, while technicals tell you when to buy - to be a perfect investor, you need them both. You could hold a fundamentally strong stock for years, waiting for it to catch up to its "true value," while a technical analyst might ride multiple trends and capture far superior returns during that same time. Also, the opposite can happen – you may see a great technical setup, but if the fundamental factors are against it, you could end up with your money stuck in a bad trade.
To put these ideas in perspective, starting with a simulated portfolio of $76,000, where each stock had an equal investment of around $1,000–$1,100, the portfolio is now worth around $124,000. The results are based on buying at marked zones and holding until today. I calculated entries from the middle of the target zone, as it’s a more realistic and optimal approach compared to aiming for perfect lows (which, frankly, feels a bit scammy) to get much(!) higher returns. This method reflects real-world trading.
Before we dive in, here are the current Top 5 stocks from My Picks:
NVDA: +735%
ANET: +343%
TT: +227%
META: +209%
LEN: +164%
These numbers demonstrate the effectiveness of a solid technical strategy. Many say it's tough to beat the market with individual stock picks, but these results show it’s not just possible, it’s absolutely achievable with the right tools and approach.
Now, let's dive into the charts!
1. Apple (AAPL) - a load-it-up type of setup has worked out nicely. Used previously worked resistance levels. If the stocks performing well and the market cap is big enough then these levels can help you to get on board.
Current profit 65%
Before:
After:
---------------------------
2. Adobe (ADBE) - came down sharply, but the price reached the optimal area and reversed.
Current profi 38%.
Before:
After:
---------------------------
3. Advanced Micro Devices (AMD) - round number, strong resistance level becomes support and the climb can continue.
Current profit 101%
Before:
After:
---------------------------
4. Amazon (AMZN) - came down from high prices to the marked levels and those who were patient enough got rewarded nicely.
Current profit 66%
Before:
After:
---------------------------
5. Arista Networks (ANET) - retest of the round nr. worked perfectly, as a momentum price level, after the strong breakout.
Current profit 343%
Before:
After:
---------------------------
6. Aptiv PLC (APTV): Came down quite sharply and it will take some time to start growing from here, if at all. The setup was quite solid but probably fundamentals got weaker after the all-time high.
Current loss -24%
Before:
After:
---------------------------
7. American Express (AXP) - firstly the round nr. 200 worked as a strong resistance level. Another example is to avoid buying if the stock price approaches bigger round numbers the first time. Came to a previous resistance level and rejection from there…
Current profit 104%
Before:
After:
---------------------------
8. Bio-Rad Laboratories (BIO) - in general I like the price action, kind of smoothly to the optimal zone. It might take some time to start growing from here but also fundamentals need to look over.
Current loss 6%
Before:
After:
---------------------------
9. BlackRock (BLK) - kind of flawless. All criteria are in place and worked perfectly.
Current profit 81%
Before:
After:
---------------------------
10. Ball Corporation (BALL) - a perfect example of why you should wait for a breakout to get a confirmed move. No trade.
Before:
After:
---------------------------
11) Berkshire Hathaway (BRK.B) - Buy the dip. Again, as Apple, a big and well-known company - all you need to do is to determine the round numbers, and small previous resistances that act as support levels, and you should be good.
Current avg. profit from two purchases 64%
Before:
After:
---------------------------
12) Cardinal Health (CAH) - the retest isn't as deep as wanted but still a confirmed breakout and rally afterward. Still, the bias was correct!
Before:
After:https://www.tradingview.com/x/83OmlWuv/
---------------------------
13) Ceridian HCM Holding (DAY) - found support from the shown area but not much momentum.
Current profit 20%
Before:
After:
---------------------------
14) Charter Communications (CHTR) - technically speaking it is a quite good price action but kind of slow momentum from the shown area. Probably came too sharply and did not have enough previous yearly highs to support the fall.
Current loss -10%
Before:
After:
---------------------------
15) Comcast Corp. (CMCSA) - got liquidity from new lows, pumped up quickly, and is currently fairly solid.
Current profit 10%
Before:
After:
---------------------------
16) Cummins (CMI) - got rejected from 2028 and 2019 clear highs, fairly hot stock, and off it goes.
Current profit 80%
Before:
After:
---------------------------
17) Salesforce.com (CRM) - perfect. 50% drop, strong horizontal area, and mid-round nr did the work.
Current profit 83%
Before:
After:
---------------------------
18) Cisco Systems (CSCO) - worked and slow grind upwards can continue.
Current profit 30%
Before:
After:
---------------------------
19) Caesars Entertainment (CZR) - not in good shape imo. It has taken too much time and the majority of that is sideways movement. Again, came too sharply to the optimal entry area.
Current loss -16%
Before:
After:
---------------------------
20) Devon Energy (DVN) - inside the area and actually active atm. Still, now I’m seeing a bit deeper correction than shown.
Before:
After:
---------------------------
21) Electric Arts (EA) - 6 years of failed attempts to get a monthly close above $150 have ended here. It got it and we are ready to ride with it to the higher levels.
Current profit: kind of BE
Before:
After:
---------------------------
22) eBay (EBAY) - it took some time but again, worked nicely.
Before:
After:
---------------------------
23) Enphase Energy (ENPH) - got a breakout, got a retest, and did a ~76% rally after that! If you still hold it, as I do statistics, then…
Current loss -59%
Before:
After:
---------------------------
24) Expeditors International of Washington (EXPD) - kind of worked but didn't reach. No trade.
Before:
After:
---------------------------
25) Meta Platforms (META) - the bottom rejection from the round number $100 is like a goddamn textbook :D At that time 160 and 200 were also a good area to enter. Here are several examples of the sharp falls/drops/declines - watch out for that, everything should come fairly smoothly. Still, it ended up nicely and we have a massive winner here...
Current profit 209%
Before:
After:
---------------------------
26) FedEx (FDX) - I love the outcome of this. Very solid price action and multiple criteria worked as they should. Perfect.
Current profit 60%
Before:
After:
---------------------------
27) First Republic Bank (FRC) - firstly got a solid 30 to 35% gain from the shown area but...we cannot fight with the fundamentals.
Current loss 99%
Before:
After:
---------------------------
28) General Motors (GM) - finally found some liquidity between strong areas and we are moving up.
Current profit 47%
Before:
After:
---------------------------
29) Alphabet (GOOG) - load it up 3.0, a good and strong company, and use every previous historical resistance level to jump in.
Current avg. profit after three different price level purchases 63%
Before:
After:
---------------------------
30) Genuine Parts (GPC) - coming and it looks solid.
Before:
After:
---------------------------
31) Goldman Sachs (GS) - really close one.
Current profit 86%
Before:
After:
---------------------------
32) Hormel Foods (HRL) - quite bad performance here. Two trades, two losses.
The current loss combined these two together is 35%
Before:
After:
---------------------------
33) Intel (INTC) - at first perfect area from where it found liquidity, peaked at 65%. Still, I make statistics if you still holding it then…
Current loss -21%
Before:
After:
---------------------------
34) Ingersoll Rand (IR) - beautiful!
Current profit 144%
Before:
After:
---------------------------
35) Intuitive Surgical (ISRG) - the trendline, 50% drop, strong horizontal area. Ready, set, go!
Current profit 157%
Before:
After:
---------------------------
36) Johnson Controls International (JCI) - second rest of the area and then it started to move finally..
Current profit 55%
Before:
After:
---------------------------
37) Johnson & Johnson (JNJ) - Buy the dip and we had only one dip :)
Current profit 13%
Before:
After:
---------------------------
38) CarMax (KMX) - the area is strong but not enough momentum in it so I take it as a weakness.
Current profit kind of BE
Before:
After:
---------------------------
39) Kroger Company (KR) - without that peak it is like walking on my lines
Current profit 15%
Before:
After:
---------------------------
40) Lennar Corp. (LEN) - strong resistance level becomes strong support. Beautiful!
Current profit 164%
Before:
After:
---------------------------
41) LKQ Corp. (LKQ) - just reached and it should be solid. Probably takes some time, not the strongest setup but still valid I would say.
Before:
After:
---------------------------
42) Southwest Airlines (LUV) - no breakout = no trade! Don’t cheat! Your money can be stuck forever but in the meantime, other stocks are flying as you also see in this post. If there is a solid resistance, wait for the breakout and possibly retest afterward! Currently only lower lows and lower highs.
Before:
After:
---------------------------
43) Las Vegas Sands (LVS) - channel inside a channel projection ;) TA its own goodness!
Current profit 70%
Before:
After:
---------------------------
44) Microchip Technology Incorporated (MCHP) - worked!
Current profit 37%
Before:
After:
---------------------------
45) Altria Group (MO) - got a bit deeper retest, liquidity from lower areas, and probably a second try..
Currently kind of BE
Before:
After:
---------------------------
46) Moderna (MRNA) - "seasonal stocks", again too sharp and we are at a loss…
Current loss -37%
Before:
After:
---------------------------
47) Morgan Stanley (MS) - the first stop has worked, and got some nice movements.
Current profit 62%
Before:
After:
---------------------------
48) Microsoft (MSFT) - Load it up 4.0, buy the dip has worked again with well-known stock.
Three purchases and avg. return from these are amazing 70%
Before:
After:
---------------------------
49) Match Group (MTCH) - it happens..
Current loss -53%
Before:
After:
---------------------------
50) Netflix (NFLX) - almost the same as Meta. Came quite sharply but the recovery has been also quick. Another proof is that technical analysis should give you a psychological advantage to buy these big stocks on deep corrections.
Current profit 153%
Before:
After:
---------------------------
51) NRG Energy (NRG) - Perfect weekly close, perfect retest…
Current profit 90%
Before:
After:
---------------------------
52) NVIDIA (NVDA) lol - let this speak for itself!
Current profit 735%
Before:
After:
---------------------------
53) NXP Semiconductors (NXPI) - usually the sweet spot stays in the middle of the box, and also as I look over these ideas quite a few have started to climb from the first half of the box. Touched the previous highs.
Current profit 74%
Before:
After:
---------------------------
54) Pfizer (PFE) - actually quite ugly, TA is not the strongest. Probably results-oriented but yeah..
Current loss -25%
Before:
After:
---------------------------
55) PerkinElmer - “after” is EUR chart but you get the point.
Current profit 25%
Before:
After:
---------------------------
56) Pentair (PNR) - worked correctly, 50% drop combined with the horizontal area, easily recognizable, and the results speak for themselves.
Current profit 124%
Before:
After:
---------------------------
57) Public Storage (PSA) - again, previous yearly highs and the trendline did the job.
Current profit 36%
Before:
After:
---------------------------
58) PayPal (PYPL) - the area just lowers the speed of dropping, but slowly has started to recover.
Current loss -14%
Before:
After:
---------------------------
59) Qorvo (QRVO) - slow, no momentum.
Current profit 10%
Before:
After:
---------------------------
60) Rockwell Automation (ROK) - previous yearly high again, plus some confluence factors.
Current profit 32%
Before:
After:
---------------------------
61) Rollins (ROL) - after posting it didn’t come to retest the shown area. Being late for a couple of weeks. Worked but cannot count it in, the only thing I can count is that my bias was correct ;)
Before:
After:
---------------------------
62) Snap-On Incorporated (SNA) - same story!
Before:
After:
---------------------------
63) Seagate Technology (STX) - firstly it came there! Look how far it was, the technical levels are like magnets, the price needs to find some liquidity for further growth and these areas can offer it. I like this a lot, almost all the criteria are in place there.
Current profit 73%
Before:
After:
---------------------------
64) Skyworks Solutions (SWKS) - one of the textbook examples of how trendline, 50% drop, round nr. and strong horizontal price zone should match. Still a bit slow and it will decrease the changes a bit.
Kind of BE
Before:
After:
---------------------------
65) TE Connectivity (TEL) - came down, and got a rejection. “Simple” as that.
Current profit 37%
Before:
After:
---------------------------
66) Thermo Fisher Scientific (TMO) - mister Ranging Market.
Current profit 19%
Before:
After:
---------------------------
67) Trimble (TRMB) - finally has started to move a bit. Got liquidity from previous highs again and..
Current profit 45%
Before:
After:
---------------------------
68) Tesla (TSLA) - made a split. Have been successfully recommended many times after that here and there but two years ago we traded in these price levels and..
Current profit 19%
Before:
After:
---------------------------
69) Train Technologies (TT) - dipped the box and off it goes! Epic!
Current profit 227%
Before:
After:
---------------------------
70) Take-Two Interactive Software (TTWO) - I like this analysis a lot. Worked as a clockwork.
Current profit 60%
Before:
After:
---------------------------
71) United Rentals (URI) - WHYY you didn’t reach there :D Cannot count it.
Before:
After:
---------------------------
72) Waters Corp. (WAT) - came to the box as it should be slow and steady. As the plane came to the runway.
Current profit 41%
Before:
After:
---------------------------
73) Exxon Mobil Corp. (XOM) - another escaped winner. Didn’t come down to retest my retest area so, missed it.
Before:
After:
---------------------------
74) Xylem (XYL) - perfect trendline, good previous highs, 50% drop from the peak and..
Current profit 76%
Before:
After:
---------------------------
75) Autodesk (ADSK) - took a bit of time to start climbing but everything looks perfect. Nice trendline, 50% drop from ATH, previous yearly highs - quite clean!
Current profit 66%
Before:
After:
The strategies above show how useful price action, key levels, and psychology can be for investing. By spotting breakouts, and pullbacks, or focusing on round numbers and past highs, technical analysis helps give traders an edge in understanding the market.
Regards,
Vaido

What Is Stage Analysis in Trading?Stage analysis is a powerful technique in trading that segments market trends into distinct phases, each offering unique opportunities and challenges. Developed by Stan Weinstein, this method helps traders understand and anticipate market movements. This article delves into the four stages of this analysis, offering insights into how traders apply these concepts, particularly in the context of stock trading.
Understanding Stage Analysis
Stan Weinstein’s stage analysis, a concept introduced in his seminal work "Secrets for Profiting in Bull and Bear Markets," offers a structured approach to evaluating market phases. Stage analysis in stocks divides the market cycle into four distinct phases. Each represents a specific phase in a stock's lifecycle, characterised by unique price movements and investor behaviour.
Weinstein's methodology is rooted in the identification of these stages through technical analysis, focusing on price action and volume. By discerning the current phase of a stock, traders gain insights into its probable future trajectory. This analytical framework assists traders in making more informed decisions about entry and exit points, aligning their strategies with the market's natural rhythm. Notably, it can be used in both intraday trading and long-term investing.
Below, we’ll walk through the four stages of Weinstein’s methodology. To better understand the topic, consider following along in FXOpen’s free TickTrader platform.
Stage 1: The Basing Area
In Weinstein stage analysis, the basing stage, or stage 1, marks the beginning of a stock's life cycle. This period is characterised by a period of consolidation after a previous downtrend. Prices typically fluctuate within a narrow range, indicating a lack of clear direction as the market sentiment shifts from negative to neutral. This transition is often overlooked in stage analysis trading, as it doesn't present immediate opportunities for significant gains.
During the basing stage, trading volumes generally diminish, reflecting a reduction in selling pressure. As buying volume increases, accumulation-distribution tools like on-balance volume (OBV) tend to bottom out and move higher, typically in tandem with price. OBV helps in tracking volume flow, offering insights into whether the volume is flowing in or out of an asset.
Additionally, investors watch for a gradual flattening of the price’s moving averages, a sign that the downward momentum is waning. It's a period of accumulation for savvy investors who recognise the potential for future upside. However, traders are cautious as stocks can linger in this phase for an extended period, and premature entry can lead to capital being tied up in inactive investments.
Traders employing Weinstein's method use this phase to prepare for potential entry points, keeping a close watch on stocks that show signs of breaking out of their base. The successful identification of a market transitioning from Stage 1 to Stage 2 – the Advancing Stage – may position traders to capitalise on the early beginnings of a new uptrend.
Stage 2: Advancing
In stock stage analysis, stage 2, known as the advancing stage, is where investors may see the potential gains. This phase begins when a stock breaks out from the basing stage (stage 1) with notable volume. It signifies a transition from a neutral to bullish market sentiment as more investors start acknowledging the market’s potential.
A key characteristic of Stage 2 is the sustained upward movement in the stock's price, often accompanied by increasing trading volumes. This rise in interest confirms the growing interest and commitment from investors, reinforcing the trend's strength. During this phase, the price typically moves above its key moving averages, such as the 30-period moving average, which acts as a dynamic support.
OBV is also useful in this period. An increasing OBV alongside rising prices is a positive sign, indicating that the upward price movements are supported by strong volume, thus validating the trend.
Traders focus on stocks that maintain their price above key moving averages and show a consistent increase in OBV in this phase. Such alignment of price and volume dynamics provides a more robust confirmation for continuing the trade in the advancing direction.
Stage 3: Top Area
Stage 3, known as the top area, marks a significant shift in the stock's cycle. This phase signifies the transition from an uptrend to a potential downtrend, characterised by a levelling off of the stock’s price movement after its advance in Stage 2. It's a period of distribution where early investors start to take potential returns, and new investors may enter based on the stock's past performance, not its future potential.
During this phase, price movements become less definitive, often moving sideways and creating a resistance level that the stock struggles to exceed. Price begins to hover around its key moving averages, such as the 30-period moving average, without a clear direction. This indecisiveness in price action is a crucial indicator of the weakening momentum.
Volume analysis during Stage 3 is vital. A divergence between price and volume starts to emerge; while prices might still be high, interest often shows a noticeable decrease. This reduced volume hints at a lack of conviction among investors, assuming that the stock may not sustain its previous upward trajectory.
Traders monitoring stocks in Stage 3 should be cautious. It’s a time to closely watch for signs of a breakdown or a continuation of the trend, as the stock may either revert to Stage 1 or unexpectedly surge into a renewed Stage 2.
Stage 4: The Declining Phase
Stage 4 marks the declining phase, where a stock transitions from a period of distribution to a clear downtrend. This period is characterised by a sustained drop in the stock’s price, often initiated by a decisive break below key support levels and moving averages, like the 30-period moving average.
The declining phase is typically accompanied by increasing trading volumes, reflecting a growing consensus among investors that the stock’s peak performance is behind it. This phase can be accelerated by negative news or poor earnings reports, further driving down the price.
The on-balance volume (OBV) is again a critical tool in this phase. A declining OBV indicates that selling pressure is increasing, reinforcing the downtrend. This downtrend is marked by lower highs and lower lows in both price and volume, signalling weakening investor confidence and diminishing interest in the stock.
For traders, stage 4 is a period of high caution. It's often considered a signal to exit positions to avoid further losses. Short-selling strategies may be employed by more experienced traders who seek to capitalise on the market’s downward trajectory. However, it's essential to approach this phase with a clear risk management strategy, as the volatility can lead to rapid changes in price.
The Bottom Line
Mastering stage analysis may equip traders with a structured approach to navigate the stock market's ebb and flow. By understanding and applying the principles of each stage, traders can potentially make more informed decisions, aligning their strategies with market trends. For those ready to apply these insights in real-world trading, opening an FXOpen account offers a platform to implement stage analysis techniques effectively in a dynamic trading environment.
This article represents the opinion of the Companies operating under the FXOpen brand only. It is not to be construed as an offer, solicitation, or recommendation with respect to products and services provided by the Companies operating under the FXOpen brand, nor is it to be considered financial advice.

Mastering Support and Resistance: Part 1Hello Traders, and welcome to a new year of endless learning opportunities! Today, we will kick off 2024 by exploring the concept of support and resistance, how to identify these levels and common misconceptions about them. Support and resistance levels play a crucial role in technical analysis and can greatly impact your trading strategy. Understanding these levels and knowing how to effectively use them can make all the difference in your trading success. We will be doing a deeper dive in a subsequent article later this week where we will cover more advanced techniques and the psychology behind support and resistance. In the meantime, are you ready to dive in?
Understanding Support and Resistance Levels in Trading
Support and resistance levels are key aspects of technical analysis that traders incorporate into several different trading decisions. Support refers to a price level where buying pressure is expected to be strong enough to prevent the price from falling further. On the other hand, resistance is a price level where selling pressure is expected to be strong enough to prevent the price from rising higher. These levels are based on the idea that markets often go through similar patterns and respond to certain prices.
The Importance of Support and Resistance in Technical Analysis
Support and resistance levels are crucial in technical analysis for several reasons. Firstly, they provide traders with valuable information about market sentiment. When the price approaches a support level, it indicates that buyers are likely to step in and try to push the price up. Conversely, when the price approaches a resistance level, it suggests that sellers are likely to enter the market to push the price down. Understanding market sentiment can help traders avoid potential losses.
Secondly, support and resistance levels act as a reference point for setting profit targets and stop-loss levels. By analyzing historical price movements, traders can identify key support and resistance levels that are likely to be tested in the future. These levels can be used to determine when to take profits or cut losses, providing a clear framework for risk management.
Lastly, support and resistance levels can act as confirmation tools for trading signals. For example, if a trader receives a buy signal from a set of technical indicators and the price is approaching or bouncing off of a strong support level, it adds credibility to the signal.
Similarly, if a sell signal is generated and the price is approaching or moving away from a major resistance level, it strengthens the validity of the signal. By combining support and resistance levels with other technical indicators, traders can increase the accuracy of their trading signals.
Identifying Support and Resistance Levels on Price Charts
Identifying support and resistance levels on price charts is a fundamental skill for any trader. Several methods can be used to identify these levels, depending on the trader's preference and trading style. Here are a few common techniques:
Swing Highs and Lows: Horizontal support and resistance levels can be identified by analyzing price charts. A support level is typically formed by connecting multiple swing lows, where the price has previously bounced back up. Conversely, a resistance level is formed by connecting multiple swing highs, where the price has previously reversed its upward trajectory. By identifying these levels, traders can anticipate potential reversals or breakouts and adjust their trading strategy accordingly.
It is important to note that support and resistance levels are not exact price points, but rather zones where buying or selling pressure is expected to be strong. Traders should use a combination of these techniques and exercise discretion to identify the most relevant support and resistance levels on their price charts.
Moving Averages: Moving averages are commonly used to identify trends in price charts, but they can also act as dynamic support and resistance levels. For example, a 200-day moving average is often considered a strong support or resistance level. When the price approaches this moving average, it is likely to either bounce off or breakthrough, depending on the prevailing trend.
Fibonacci Levels: Fibonacci levels are based on mathematical sequences. These levels are used to identify potential support and resistance levels based on the percentage retracement of a previous price move. Traders often look for confluence between Fibonacci levels and other technical indicators to increase the reliability of their analysis. Several different tools on TradingView can be used to identify these levels such as a Fibonacci retracement or Fibonacci Channel.
How to Effectively Use Support and Resistance in Your Trading Strategy
Once you have identified support and resistance levels on your price charts, it is important to know how to effectively use them in your trading strategy. Here are some key considerations:
Combine with other indicators: Support and resistance levels should not be used in isolation but should be combined with other technical analysis techniques. Relying solely on support and resistance levels can result in false signals, as price can break through or reverse at unexpected times. Consider using trend lines, candlestick patterns, or oscillators to confirm your support and resistance levels and increase the accuracy of your trading signals.
Price Action: Observing price action around support and resistance levels can provide valuable insights into market sentiment. Look for signs of price rejection, such as long wicks or multiple failed attempts to break through a level. Price patterns may also form around support or resistance levels. These signs can indicate potential reversals or breakouts.
Risk Management: Support and resistance levels can be used to determine stop-loss levels and profit targets. When entering a trade, set your stop-loss just below a support level for long positions or just above a resistance level for short positions. Similarly, set your profit target at the next significant support or resistance level to ensure a favorable risk-reward ratio.
Multiple Timeframes: Analyzing support and resistance levels across multiple timeframes can provide a broader perspective on market dynamics. A level that appears strong on a daily chart may be insignificant on a weekly or monthly chart. Consider higher timeframe levels for long-term trades and lower timeframe levels for short-term trades.
Common Misconceptions About Support and Resistance
There are several common misconceptions about support and resistance levels that traders should be aware of. Understanding these misconceptions can help you avoid common pitfalls and make better trading decisions. Here are three common misconceptions:
Support and Resistance Levels Are Fixed: One of the most common misconceptions is that support and resistance levels are fixed and remain unchanged over time. In reality, these levels are dynamic and can shift as market conditions change. Traders should regularly reevaluate and adjust their support and resistance levels based on new price information.
Support Turns into Resistance and Vice Versa: Another misconception is that support levels always turn into resistance levels when broken, and vice versa. While this can sometimes be the case, it is not always true. Market dynamics can change, and a support level that has been broken may become irrelevant in the future. Traders should not blindly assume that a broken support level will act as a strong resistance level.
Support and Resistance Levels Are Foolproof: Many traders mistakenly believe that support and resistance levels are infallible and always result in predictable price movements. While these levels can provide valuable guidance, they are not guaranteed to hold or reverse the price. Traders should always use support and resistance levels in conjunction with other technical analysis tools and exercise proper risk management.
By understanding these misconceptions, traders can avoid relying solely on support and resistance levels and develop a more comprehensive trading strategy. We implore you to be thorough in practice and understanding of S&R as there is a great degree of subjectivity to them. The more you understand about these levels the greater accuracy you can obtain.
Tips for Mastering Support and Resistance
Mastering support and resistance requires practice and experience. Here are some tips to help you improve your skills in identifying and utilizing these levels:
Backtesting: Backtesting is a valuable tool for evaluating the effectiveness of support and resistance levels in historical price data. By analyzing past price movements, you can assess how well your identified levels have held or reversed the price. This can provide valuable insights into the reliability of your levels and help you refine your approach.
Focus on Key Levels: Not all support and resistance levels are equally significant. Focus on key levels that have been tested multiple times and have resulted in strong price reactions. These levels are more likely to hold or reverse the price and can provide more reliable trading opportunities.
Practice Patience: Support and resistance levels often require patience to be effective. Wait for clear confirmation before entering a trade, and avoid chasing price or making impulsive decisions based on a single level. Patience and discipline are key to successful trading.
By incorporating these tips into your trading routine, you can enhance your mastery of support and resistance levels and improve your trading performance.
What Does it All Add Up To?
In conclusion, understanding and mastering support and resistance levels is crucial for successful trading. These levels provide valuable information about market sentiment, act as reference points for setting profit targets and stop-loss levels, and can confirm trading signals. By identifying support and resistance levels on price charts using techniques like swing highs and lows, moving averages, and Fibonacci levels, traders can make better judgments in deciding what actions to take. However, it is important to use support and resistance levels in conjunction with other indicators and consider price action for confirmation. Overall, integrating support and resistance levels into a trading strategy can help break through barriers and achieve trading success.

Psychographic Analysis - Life Cycle of InvestorImagine an investment as a journey with twists and turns. Knowing its different stages is like having a map for investors. It helps them decide if they want a thrilling ride with big potential rewards or a smoother path with steady stability, based on their comfort with risk. For investors, understanding the life cycle is crucial because it directly impacts the investor's risk appetite.
✨Personality characteristics of investors
✨Risk/Return Trade-Offs for Investors:
🔸 Risk/reward trade-offs are related to the relationship that exists between the degree of risk an investor takes and the potential reward for the investment. larger-risk investments have the potential for greater returns, but they also have the potential for greater losses as well. Lower-risk investments, on the other hand, have the potential for lower profits, but also for fewer losses.
🔸 The risk tolerance and investment objectives of investors will change over time. Younger investors who are just starting out are more likely to be on the risk/reward spectrum, willing to take on more risk in exchange for the chance of larger profits. This is because they have a longer time horizon with which to invest and recoup from losses. Investors may grow more risk-averse and migrate to the left side of the spectrum as they near retirement. They may need to start withdrawing from their assets to fund their retirement, so they want to protect their money and avoid large losses.
✨Phases of the Investment Life Cycle:
↪️ Here is a breakdown of the investment life cycle and how risk/reward trade-offs may change at each stage:
1️⃣ Accumulation Phase
In the initial stage, known as the accumulation phase, individuals find themselves with a modest net worth relative to their liabilities. Their investment portfolio tends to be limited and less diversified. Goals often include funding education, purchasing a home, and laying the groundwork for future financial independence. With a long time horizon and potential income growth, investors in this phase can afford to explore high-return, high-risk capital gain-oriented investments.
2️⃣ Consolidation Phase
As individuals progress through their mid-to-late careers, they enter the consolidation phase. Characterized by income surpassing expenses, this period, although still distant from retirement, prompts a shift towards capital preservation. Investors start balancing high capital gain investments with lower-risk assets, creating a more stable and resilient portfolio.
3️⃣ Spending Phase
The spending phase marks a transition when living expenses are no longer sustained by earned income but by accumulated assets, such as investments and retirement funds. With a decreased likelihood of returning to work, stability becomes paramount in the investment portfolio. Preferences shift towards investments generating steady income through dividends, interest, and rentals. Despite the reduced time horizon, some growth-focused investments are retained to hedge against inflation.
4️⃣ Gifting Phase
In the final phase, the gifting phase, investors realize an abundance of assets beyond personal needs. At this juncture, the purpose of investments may evolve, focusing on leaving a lasting legacy or supporting charitable causes.
📊 Importance:
It's like having a guide for your financial journey when you understand the investor life cycle. It assists you in choosing, depending on your comfort level with danger, between an exhilarating, high-risk ride and a more steady, smooth road. Understanding the various investment phases is essential as it influences your willingness to accept risk. It's similar to changing your game plan as you move through different stages of life, such as the exuberant early years and the more measured approach as you near retirement. Put simply, understanding the investor life cycle assists you at every stage in reaching your financial objectives and making wise decisions.
By @Money_Dictators on @TradingView Platform

Ichimoku Cloud Demystified: A Comprehensive Deep DiveHello TradingView Community, it’s Ben with LeafAlgo! Today we will discuss one of my favorite indicators, the Ichimoku Cloud. The Ichimoku is a versatile trading tool that has captivated traders with its unique visual representation and powerful insights. We will dive deep into understanding the Ichimoku Cloud, explore its history, discuss its parts, highlight real-life examples, and address potential pitfalls. By the end of this article, we believe you will know how to leverage the Ichimoku Cloud effectively in your trading endeavors. Let’s dive in!
Origin of The Ichimoku Cloud
The Ichimoku Cloud, also known as Ichimoku Kinko Hyo, was developed by Goichi Hosoda in the late 1930s but was not published until later in the 1960s. Its name translates to "one glance equilibrium chart," reflecting its ability to provide a holistic view of market dynamics with a single glance. Over time the Ichimoku Cloud has become a popular trading tool among new and seasoned traders.
Components of The Ichimoku Cloud
Some traders believe the Ichimoku cloud is a complex jumble of lines with no rhyme or reason, but this is not necessarily true. The best way to understand the Ichimoku cloud is to break it down into its respective parts. Each element contributes to the overall interpretation of price action, trend direction, support and resistance levels, and potential entry and exit points.
The Ichimoku Cloud has five components: Tenkan-sen, Kijun-sen, Senkou Span A and B, and Chikou Span.
The Tenkan-sen and Kijun-sen, often called the Conversion Line and Base Line, respectively, are essential in identifying trend direction and momentum. Below we can see a bullish signal happens when the Tenkan-sen crosses above the Kijun-sen. Conversely, a bearish signal occurs when the Tenkan-sen crosses below the Kijun-sen. Typical length inputs for the Tenkan-sen and Kijun-sen are 9 and 26.
The Senkou Span A and B form the cloud or "Kumo." These components serve as dynamic support and resistance levels, with Senkou Span A calculated as the average of the Conversion Line and Base Line and Senkou Span B representing the midpoint of the highest high and lowest low over a specified period, typically 52. The cloud's thickness and color provide visual cues for potential market strength and volatility.
The Chikou Span, or the Lagging Span, is the current closing price plotted 26 periods back on the chart. It helps traders gauge the relationship between the current price and historical price action, providing insights into potential trend reversals or continuation.
Putting the parts together gives us a complete picture of the Ichimoku Cloud. Each aspect contributes to the one-glance equilibrium theory, giving traders a more holistic view of price action.
Applying the Ichimoku Cloud in Trading
We now better understand all parts of the Ichimoku cloud, but that means little if we don’t understand how it can be utilized in trading. Let's explore examples that demonstrate the practical application of the Ichimoku Cloud:
Example 1: Trend Following
In an uptrend, we would look for the Tenkan-sen to cross above the Kijun-sen while the price remains above the cloud. When the price retraces to the cloud, a long position opportunity may arise, with the cloud acting as support. The Chikou Span should also be above the historical price action, confirming the bullish sentiment.
Example 2: Trend Reversals and Breakout Opportunities
A potential trend reversal or continuation can be identified when the Tenkan-sen crosses above the Kijun-sen and the price moves above the cloud. A breakout trade can initiate when the price breaks through the cloud's upper boundary, indicating a shift in momentum. For the Ichimoku cloud to give its strongest confirmation of a reversal, some traders will take a fairly conservative approach and wait for a few things to occur. Traders typically wait for a kumo twist, the Tenkan-sen/Kijun-sen cross, and the Chikou Span to break the cloud and be above the price.
The reverse of these signals can be used in the same fashion for a short position.
Example 3: The Kumo Twist
In a trend, a Kumo Twist can signal a potential trend reversal. Look for the Senkou Span A to cross above or below the Senkou Span B within the cloud. This twist can confirm a shift in market sentiment. Traders can enter a position when the twist is confirmed, placing a stop loss above or below the cloud or the recent swing high/low. I think of the Kumo twists and subsequent clouds as a trend filter. Placing longs on the bullish side or shorts on the bearish side, however, some traders use the Ichimoku Cloud in a contrarian fashion. Contrarian trades can be profitable using this method as price tends to pull back to the clouds A or B span where support or resistance may lie.
Pitfalls and Challenges: Avoiding Common Mistakes
While the Ichimoku Cloud is a powerful tool, it is paramount to be aware of potential pitfalls. Here are a few challenges to navigate:
False Signals and Choppy Market Conditions
In ranging or volatile markets, cloud signals may generate false indications. During such periods combine the Ichimoku Cloud with other technical indicators or wait until the market picks a direction.
Moving out to higher time frames can help clear the murkiness of consolidation phases and provide a clearer picture of the trend, in turn, weeding out false signals.
Overcomplicating Analysis
The Ichimoku Cloud provides a wealth of information, but it's crucial to maintain simplicity and focus. Avoid overcrowding the chart with an abundance of indicators, especially other overlays. It is easy to get lost in the sauce or run into redundancies with too much on the chart.
Testing and Adapting
Each market has its characteristics or volatility, and it's essential to backtest the Ichimoku Cloud strategy, experiment with different parameters, and adapt to market conditions over time. Many traders rely on the standard settings, but in my time developing trading algorithms, I have learned that those settings do not hold from market to market or consistently over time. It is critical to regularly revisit your settings or overall trading strategy to make sure you are drawing on the best available information the Ichimoku Cloud can give.
Enhancing the Ichimoku Cloud Strategy
To enhance your understanding and utilization of the Ichimoku Cloud, consider the following:
Incorporating Other Technical Indicators
Combining the Ichimoku Cloud with other indicators, such as oscillators, to confirm signals can be beneficial. I know I said not to over-clutter your chart with other indicators, but that is a rule of thumb more set for overlays.
Timeframe Considerations
Adapt the Ichimoku Cloud to different timeframes based on your trading style. Higher time frames may provide more reliable signals, while lower timeframes may offer shorter-term opportunities. I don’t believe it ever hurts to back out a few time frames to get a clear picture of market dynamics and avoid tunnel vision.
Conclusion
The Ichimoku Cloud is a versatile indicator, and today we scratched the surface of how it can be appropriately used. Remember, practice, patience, and continuous learning are critical for refining your skills and adapting the Ichimoku Cloud strategy to ever-evolving market conditions. If there is anything unclear or you have any questions, please don’t hesitate to comment below. Trading education is our passion, and we are happy to help. Happy trading! :)

Preserving Your Capital Like A ChampIn the world of trading, effective trading capital management can mean the difference between success and failure. We cannot stress enough how critical this aspect is to long-term success. Today we will delve into the importance of managing your trading capital, the various strategies employed by many successful traders, and how you can implement these techniques to safeguard your investment and maximize profits.
Understanding the Importance of Trading Capital Management
Trading capital refers to the amount of money allotted for the purpose of trading your desired market. Proper management of trading capital is crucial for traders, as it helps them minimize losses and in turn, maximize profits. In essence, trading capital management is all about striking the right balance between taking risks and preserving your hard-earned money.
One key aspect that differentiates successful traders from gamblers is their mindset. Gamblers tend to chase big wins, hoping for a life-changing payout, while traders focus on consistently generating small, predictable returns over the long term. Don’t get us wrong, big wins can and do happen, and they feel great when they do. Think of trading as a really long boxing match. It's rare and impractical for a boxer to believe they can knock out their opponent by flying out of a corner with no defense and going straight for a haymaker each time. The foundation for success takes many consistent jabs, and an unwavering defense, much like trading. Traders who want to be long-term successful will prioritize risk management and capital preservation, ensuring that they can continue trading even after incurring losses so they can pursue consistent profits.
The Struggle is Real For New Traders
New traders often find difficulty in managing their trading capital effectively. This is primarily due to their focus on making profits rather than minimizing risks. The desire to make money can lead to taking unnecessary risks, which can result in significant losses. It is crucial to remember that every loss must be recovered through a profitable trade to regain lost ground. So why not implement strategies that mitigate that lost ground in the first place?
Strategies To Adopt for Long-Term Success
So, what are some of the techniques that successful traders use to optimize their chances of consistent profits in the markets? Here are a few suggestions to improve your trading capital management:
Implementing Stop-Loss Orders
Always trade with a stop-loss. There are countless ways to implement a stop-loss, and we covered this in great detail in a previous article that is linked below. A stop-loss order allows you to specify a price at which your trade will be automatically closed if the market moves against you. This is the most practical and easily enactable capital management technique you can use. Some would consider trading without a stop-loss to be one of the cardinal sins of trading, as it prevents you from managing risk effectively.
Utilizing Reward Risk Ratios (RRR)
Every trade carries the risk of making a loss. Successful traders assess their potential trade risk and potential reward before entering a position. Utilizing reward-to-risk ratios may seem complicated, but it doesn't have to be. Many traders will often aim for a reward that is twice their risk or a ratio of 2 to 1. So in theory for every $1 you risk you aim to make $2 in profit. Your RRR can also help you understand what your theoretical minimum win rate would need to be a profitable trader.
Utilizing this information is very handy when backtesting and forward-testing your strategy. In the early stages of a trader's journey, we highly recommend to keep a trading journal to keep track of these metrics. Keeping track of your wins and losses and keeping your RRR consistent offers deep insight into whether you are on the right path to consistency.
Managing Your Money
How much capital are you risking per trade? It's difficult to predict which trades will be profitable, but it's essential to risk a consistent amount on every trade. Coupled with an appropriate risk-to-reward ratio, this approach can help protect your trading account. For example, consider risking only 1-2% of your total trading portfolio on each individual trade with a maximum overall of 10% among your trades. This may not seem like much, but if you can remain disciplined with your stop losses and RRR you greatly increase the odds of success. If you have a small account don’t sweat it. It will help you grow that account size and compound those gains in a stable fashion that would outlast the method of throwing your entire account into each trade.
Hedging
Holding long and short positions on various assets in different sectors can help protect against any aggressive moves that affect the market as a whole. For instance, if there was a sudden 'flash crash,' the traders who solely went long would experience a loss or a potentially significant loss without proper risk mitigation. However, if you held both long and short positions, you could have made profits to offset the losses. Obviously, market events are hard to account for, but hedging can be a useful capital preservation strategy.
Focusing on a Single Asset to Limit Risk Exposure
Some traders prefer to concentrate on trading one asset to minimize risk exposure. This can be effective, especially when the trader has in-depth knowledge of the specific asset being traded. The potential downside is that this can limit your trading opportunities, but we highly advise this approach for new traders. Focusing on one asset can help you grow your experience and hone your strategy through a rigorously disciplined approach.
Consistency in Risk and Money Management
There is no one-size-fits-all approach to trading, and that's part of the beauty of it all. A strategy that works for one trader may not work for another. The key to improving your trading strategy is to adopt a disciplined approach to risk and money management. While this approach may not be as flashy as some in the trading community portray, consistently minimizing risk is an essential aspect of enhancing overall profitability and is a massive attribute to long-term success.
Final Thoughts on Trading Capital Management
Effective trading capital management is crucial for success in the world of trading. By adopting a disciplined approach to risk and money management, traders can minimize losses, maximize profits, and safeguard their investments. The techniques discussed – implementing stop-loss orders, utilizing reward-to-risk ratios, managing money, and diversifying trades – are all essential components of a successful trading capital management strategy.
Remember, the key to success in trading lies not in chasing the knockouts but rather by consistently landing the jabs while maintaining a stout defense. By following these strategies adopted by long-term, successful traders and focusing on preserving capital, you can improve your chances of obtaining that same long-term success in the markets.

IBM - Harmonics (theory)The first thing to look for when identifying the Bat pattern is the impulsive leg or the XA leg. We’re looking for a strong move up or down depending if we either have a bullish or a bearish Bat structure.
The next thing that needs to be satisfied for a valid Bat pattern structure is a minimum 0.382 Fibonacci retracement of the XA leg and it can go as deep as 0.50 Fibonacci retracement of the XA leg, but it can’t break below the 0.618. This will create the B leg of our Bat pattern.
How to trade the bat pattern
The next thing we’re going to look for is a retracement of the AB leg up to at least 0.382 Fibonacci ratios, but it can’t go above 0.886, and this will create our third point C of the harmonic Bat pattern strategy.
The last thing we want to establish is the D point and in order to get to the D point, all we do is to find the 0.886 Fibonacci ratios of the impulsive XA leg, which will result in a deep CD leg and finally it will complete the whole Bat pattern structure.
In the current scenario, I presented also a surprising correlation between the time cycles, where the X and A leg time frame could indicate potential CD range. As described above - if this scenario turns true and price action will indeed form a bullish harmonic bat here, the initial retracement could potentially reach levels of the previous low of this cycle (X).
This is just a tutorial and an idea for a potential Long, at the bottom of the formation and end of the current time cycle - nevertheless, I mark this idea as Neutral and place IBM in my 'watched' list.

M2 Adjusted FAAMNG Tutorial/AnalysisThe current FAANG symbol does not have a very long history. Depending on the symbol, you get a chart that either starts from mid-2019 or 2016. We get couple more years of data in this chart, back to early 2014. I weighted each stock equally according to its 60 month average, and adjusted for M2 expansion, which gives us a very consistent support line. There's also a horizontal resistance line that extends from 2018 onward that is currently being tested as support, which raises the questions:
Is historical support now resistance? Is the resistance line now support? Or will we drop below the resistance line once again?
It wouldn't surprise me if we got a bounce here to once again test that the Support line is *actually* now resistance and the drop in price wasn't a fluke. Which, maybe it was. But on the other hand, smaller caps have gotten completely crushed, look at the M2 Adjusted Russell 2000 for example:
We're getting close to the "value" zone, but we're still at the bottom range of wholesale prices. I wouldn't be surprised if there's even more stop-loss style liquidations at these prices.
There are many many unprofitable companies, roughly 50%?!, that are feeling the pain in the Russell. It's not crazy to think that once the smaller caps fall, the rest of the larger dominoes fall. First, there were drops in sort of intangibly valued companies like Netflix/Peloton. Market shrugged it off. Then we saw a single day -0.25 trillion$ valuation drop in Facebook. Market shrugged it off. Now in the past few weeks, Amazon is finally looking terrible, and this is the first time in YEARS that the market seems to be taking it seriously. How long until Apple/Tesla bite the bullet? The market can only shrug off so much localized losses before it becomes systemic. It's only a matter of weeks or months, in my opinion, until we see the remaining FAANMG and others reflect the state of rest of the market.
So how did i manage to get the symbol on the chart?
This method is not perfect. There's lots of ways to do this. I decided to equally weight each stock by their 60 month SMA, given that mean reversion is a well known phenomenon. But you can use any anything you wish, as long as it normalizes the price in a way that you like. Literally anything.
First, I wrote down the SMAs like this:
60 month SMA:
FB = 221.34
AMZN = 2250.99
AAPL = 85.60
MSFT = 173.64
NFLX = 380.58
GOOG = 1585.70
Notice that AAPL has the lowest average, 85.6.
We can use AAPL as our "benchmark".
Divide every SMA by 85.6:
FB = 2.5857
AMZN = 26.296
AAPL = 1
MSFT = 2.0285
NFLX = 4.4460
GOOG = 18.524
Now we can add each price together, and divide by our adjuster that we just calculated, to get a fairly crude, but accurate enough, equally average-weighted basket:
AAPL+
FB/2.5857+
AMZN/26.296+
MSFT/2.0285+
NFLX/4.4460+
GOOG/18.524
Mash it all together, you get:
NASDAQ:AAPL+NASDAQ:FB/2.5857+NASDAQ:AMZN/26.296+NASDAQ:MSFT/2.0285+NASDAQ:NFLX/4.4460+NASDAQ:GOOG/18.524
And adjust for M2 if you want:
(NASDAQ:AAPL+NASDAQ:FB/2.5857+NASDAQ:AMZN/26.296+NASDAQ:MSFT/2.0285+NASDAQ:NFLX/4.4460+NASDAQ:GOOG/18.524)/FRED:WM2NS
This looks ugly though. The value is so small, there's no horizontal bars on the chart because of a display bug in TV or some other problem. So we can simply multiply the entire series by a value. in this case 15, until we get something that looks good.
(NASDAQ:AAPL+NASDAQ:FB/2.5857+NASDAQ:AMZN/26.296+NASDAQ:MSFT/2.0285+NASDAQ:NFLX/4.4460+NASDAQ:GOOG/18.524)/FRED:WM2NS*15
There's a lot of ideas fairly similar to this out there, but I hope this helps someone who might be curious how people came up with these crazy long symbols. Try it with your favorite sectors! Make your own sector benchmarks. You can combine up to 10 symbols at once! Here we only used 6 symbols (7 if you include WM2NS).
Good luck and don't forget to hedge your bets :)

How do you enterpret this observation?These are my observations:
1- MSFT correction in January 2022, was the biggest and sharpest correction since March 2020. (Post pandemic)
2- Highest Price-volume ever..(295 Billion) + Biggest negative monthly return since 2016.
3- Making a dome shape Top, after a sharp bullish move in November 2021, Some call this pattern Bump and Run.
The bump and Run chart pattern is a remarkable reversal pattern that will help you spot the end of a trend and the beginning of a new one.
What do you think???
For further information you can read this article: (interesting content, I can not share because of copyright)
Zheng, Yuechu & Si, Yain Whar & Wong, Raymond. (2021). Feature extraction for chart pattern classification in financial time series. Knowledge and Information Systems. 63. 10.1007/s10115-021-01569-1.
Extracting shape-related features from a given query subsequence is a crucial preprocessing step for chart pattern matching in rule-based, template-based, and hybrid pattern classification methods. The extracted features can significantly influence the accuracy of pattern recognition tasks during the data mining process. Although shape-related features are widely used for chart pattern matching in financial time series, the intrinsic properties of these features and their relationships to the patterns are rarely investigated in the research community. This paper aims to formally identify shape-related features used in chart patterns and investigates their impact on chart pattern classifications in financial time series. In this paper, we describe a comprehensive analysis of 14 shape-related features which can be used to classify 41 known chart patterns in the technical analysis domain. In order to evaluate their effectiveness, shape-related features are then translated into rules for chart pattern classification. We perform extensive experiments on real datasets containing historical price data of 24 stocks/indices to analyze the effectiveness of the rules. Experimental results reveal that the features put forward in this paper can be effectively used for recognizing chart patterns in financial time series. Our analysis also reveals that high-level features can be hierarchically composed of low-level features. Hierarchical composition allows the construction of complex chart patterns from features identified in this paper. We hope that the features identified in this paper can be used as a reference model for future research in chart pattern analysis.
You can see the most important support(green line) and resistance (red line) levels.
Best,
Moshkelgosha
DISCLAIMER
I’m not a certified financial planner/advisor, a certified financial analyst, an economist, a CPA, an accountant, or a lawyer. I’m not a finance professional through formal education. The contents on this site are for informational purposes only and do not constitute financial, accounting, or legal advice. I can’t promise that the information shared on my posts is appropriate for you or anyone else. By using this site, you agree to hold me harmless from any ramifications, financial or otherwise, that occur to you as a result of acting on information found on this site.

How to know BULLISH or BEARISH next day to CALL or not?I tried trading on some tickers with my logic to determine the Stock Direction BULLISH or BEAR.
I looked at timeframe 2H and 4H (mainly 4H), logic:
1. Determine 4H Price > SMA20 then next day is BULLISH, should be CALL (conjunction EMA20 cross up EMA50 then strong market to CALL)
2. Determine 4H Price < SMA20 then BEARISH, don't CALL, should follow before PUT
I have been monitoring for 2 weeks and this logic satisfies about 80%.

Trading Options - CALL optionsIt is my logic to trade options, CALL option
Steps:
Crawl options data to get "date change" every day
I will focus on the third expiration, ex: this week 01/07/2022 then expiration to trade: 01/21/2022
I will alert as overchange of 5 days of any strike over +150% then I will follow this one
Setting up indicators: EMA5, EMA10. If price > EMA5 and EMA5 cross up EMA10 then I will CALL
I tried and won some cases.
The above logic is an example very simple to trading CALL options.

If you think technical analysis does not work, look at this!I published this analysis on October 18, 2021.
Today, you can see it hit the target zone!
If you have no time to learn different tools in technical analysis, at least do yourself a favor and learn how to use regression channels!
However, Regression channels are not pure technical analysis!
It is actually a statistical tool..!
Most quant funds use statistical models to open and close their position..!
The most famous model is mean reversion!
What Is Regression?
Regression is a statistical method used in finance, investing, and other disciplines that attempt to determine the strength and character of the relationship between one dependent variable (usually denoted by Y) and a series of other variables (known as independent variables).
Now, let's consider Y=Price and X=Time!
Now, you should do the math..! But do not forget we have different types of regression models: Quadratic, Qubic, Sinusoidal, and logistic...etc.
Look at these examples:
Bitcoin:
Solana:
NFLX:
USOIL:


The Magical 50 days Exponential Moving Average (50EMA)In 2021, we should take the price reaction to 50EMA very seriously! Especially if you like to buy the dips!
I believe it could be single best tool to help you find the best entry and exit point in many tickers..!
Let's review few examples:
1- NASDAQ:NVDA
2- NASDAQ:MSFT
3- NASDAQ:AAPL
4- NASDAQ:GOOG
5- NASDAQ:FB
6- NYSE:CRM
7- NASDAQ:CSCO
8- NYSE:SNOW
9- NYSE:BAC
10- NYSE:XOM
and major indexes:
SP:SPX
TVC:NDX
TVC:DJI
What is Price Action?
Price action is the movement of a security's price plotted over time. Price action forms the basis for all technical analysis of a stock, commodity, or other asset charts. Many short-term traders rely exclusively on price action and the formations and trends extrapolated from it to make trading decisions. Technical analysis as a practice is a derivative of price action since it uses past prices in calculations that can then be used to inform trading decisions.
Price action generally refers to the up and down movement of a security's price when it is plotted over time.
Different looks can be applied to a chart to make trends in price action more obvious for traders.
Technical analysis formations and chart patterns are derived from price action. Technical analysis tools like moving averages are calculated from price action and projected into the future to inform trades.
How to Use Price Action
Price action is not generally seen as a trading tool like an indicator, but rather the data source off which all the tools are built. Swing traders and trend traders tend to work most closely with price action, eschewing any fundamental analysis in favor of focusing solely on support and resistance levels to predict breakouts and consolidation. Even these traders must pay some attention to additional factors beyond the current price, as the volume of trading and the time periods being used to establish levels all have an impact on the likelihood of their interpretations being accurate.
Limitations of Price Action
Interpreting price action is very subjective. It's common for two traders to arrive at different conclusions when analyzing the same price action. One trader may see a bearish downtrend and another might believe that the price action shows a potential near-term turnaround. Of course, the time period being used also has a huge influence on what traders see as a stock can have many intraday downtrends while maintaining a month-over-month uptrend. The important thing to remember is that trading predictions made using price action on any time scale are speculative. The more tools you can apply to your trading prediction to confirm it, the better. In the end, however, the past price action of a security is no guarantee of future price action. High probability trades are still speculative trades, which means traders take on the risks to get access to the potential rewards.
Conclusion:
Monitor asset reaction to 50EMA and define your entry and exit strategy based on this simple tool!
Reference Article::
www.investopedia.com

Be an inquirer, Not a Believer..!Words cannot express how much my followers mean to me.
I’m eternally grateful for all the support and kindness I have received in the past few months from my followers on this platform.
I came across an interesting story written by Friedrich Nietzsche, so I decided to share it here. I believe it will give you a clear pathway on how to follow others in life and trading as a part of your life.
The Bestowing Virtue
Zarathustra—a sage who is also the central character of the book—tells his followers to stop following him. He says, “I now go alone, my disciples! You too go now, alone! Thus I want it. I advise you: depart from me, and guard yourselves against Zarathustra! And better still: be ashamed of him! Perhaps he has deceived you.”
A young student (S) spent years searching for enlightenment. He traveled across many countries and lived among various groups of ascetics, but after searching for years, he found his quest to be fruitless. Finally, he gave up and decided to work on a farm. The farmer (F) he worked with was a simple man. He didn’t talk much, but when he did, he enjoyed a good philosophical debate with the student. At first, the student was open to debate, doubting much of what the farmer said, thinking he was similar to the other ascetics the student had met in the past. But after some time, the young student sensed an immense wisdom and tranquility inside the farmer. He started to agree with the farmer more and more. The students desire for enlightenment had returned, and so the student worked with the farmer for months, absorbing his knowledge. Eventually, the farmer noticed that the student had stopped debating with him, and the following conversation ensued.
F: I think it’s time for you to leave me.
S: Leave? Why?
F: Listen, when you first arrived here, we had many things to teach one another. We grew together and learned from each other. Your mind was inquisitive. But recently, you’ve begun to believe everything I say. You’ve gone from an inquirer to a believer, and I won’t let you do that to yourself or to me. We’re both better off if you leave.
S: But I came seeking the truth, and I found it in you.
F: The truth! You’re lost kid.
S: Why would you send me away like this? How can you do that to me?
F: Let me show you something. Take a look at this map. What do you see?
S: I see our farm, the river nearby, and the mountains.
F: No, you see /an image/ of our farm, the river nearby, and the mountains—not the things themselves. Now tell me, what can you learn from this map?
S: I can learn where the farm and the river are, the height of the mountain, where the berry trees are, where we plant our carrots…
F: No you can’t. Give it a few millennia. The river will dry up, the mountains will move, and this farm may be a city. You can’t learn anything about the farm as it is, you can only see an image of it as it was at some point in time. See, a man’s memory is like this map. It can capture a shadow of reality, and he can share that with you, but he can never give you the reality itself. A man can give you his memories of the truth, but he can never give you the truth itself. He can tell you where the farm was, but you’d still have to verify it for yourself. If you want the truth as you say, there can be no intermediaries, no middlemen. If there’s a middleman, then he is the one you are following, not the truth.
S: But what’s wrong with following you?
F: If you follow me, you’ll live according to /my/ memories. You’ll live according to /my/ map, and you’ll never learn to construct your own. What if my map is wrong? Then you’ll be lost with me, and you won’t be able to correct me because you never learned to navigate on your own. And if you can’t correct me, then we’re no longer able to help each other. But if you learn to see for yourself, if you learn to construct your own map of reality, then we can come together as friends and individuals. We can compare our maps and help one another see reality as it really is. And when we both see reality as it is, we can journey through it together, as equals.
S: I guess you’re right. I’ll start packing my things.
I believe if you change some words in this conversation and read it again it would be nice:
Farmer: Analyst
Student: Trader
Map: Analysis
Farm: Market
River: Trend
Mountain: price pattern
...
Nothing would be better than to finish my post number 1111 than expressing my gratitude once again:
I am more grateful to you than you’ll ever know.
Best,
Moshkelgosha
Reference:
freedominthought.com

This is called WSB effect..!The goal of this article is to explain the Wallstreet Bets methods.
I believe all the market participants should be aware of their effects on the market and how they could derail any asset from a normal movement.
Let's look at some of their manipulations first:
1- NASDAQ:MVST
2- NASDAQ:WISH
3- NYSE:SPCE
4- NYSE:NIO
5- NASDAQ:FORD
6- NASDAQ:AMD
7- NASDAQ:MRNA
8- NASDAQ:NVDA
9- NASDAQ:TSLA
10- NASDAQ:AAPL
11- NYSE:PFE
At this point, you must be able to see the similarities between charts and also group them into 2 different categories!
Cluster 1: Small caps
Cluster 2: Big caps
In cluster 1: they usually target 100% or above
In cluster 2: The bigger the market cap of that company the smaller the wave they could push.
The big question is Are they predictable?
I believe their movement especially on the Topside could be predicted with acceptable accuracy if you know how to monitor their money injection.
Let's review some of my published analysis about their plays:
August 17, 2021, one day before manipulation ends:
NYSE:PFE
August 10th, 2021, right at the last day!
NASDAQ:MRNA
August 4th, right at the last day..!
AMD
Defining the hypothesis:
1-The Wall Street Bets phenomenon could be a very smart Algorithmic Trading Platform that creates bullish and bearish rallies by smart money injection or withdrawal, and it is not a group of "Apes".
2- Their target prices could be predictable using Option trades data
3- Their pattern of behavior is not Pump and Dump, but it is "Dump-Pump-Dump"
4- Most of their plays were in the ARK Invest's ETFs weeks or months ago.
I do not want to make this post very long, so I encourage my followers to read this article and looking at the charts carefully.
I will share my findings of WSB in future posts.
Moshkelgosha

A None Random Walk Down the Inefficient Wall Street..!What Is the Random Walk Theory?
The random walk theory raised many eyebrows in 1973 when author Burton Malkiel coined the term in his book "A Random Walk Down Wall Street.
Random walk theory suggests that changes in stock prices have the same distribution and are independent of each other. Therefore, it assumes the past movement or trend of a stock price or market cannot be used to predict its future movement. In short, the random walk theory proclaims that stocks take a random and unpredictable path that makes all methods of predicting stock prices futile in the long run.
Random walk theory suggests that changes in stock prices have the same distribution and are independent of each other.
Random walk theory infers that the past movement or trend of a stock price or market cannot be used to predict its future movement.
Random walk theory believes it's impossible to outperform the market without assuming additional risk.
Random walk theory considers technical analysis undependable because it results in chartists only buying or selling security after a move has occurred.
Random walk theory considers fundamental analysis undependable due to the often-poor quality of information collected and its ability to be misinterpreted.
Random walk theory claims that investment advisors add little or no value to an investor’s portfolio.
Efficient Markets are Random
The efficient market hypothesis states that stock prices fully reflect all available information and expectations, so current prices are the best approximation of a company’s intrinsic value. This would preclude anyone from exploiting mispriced stocks consistently because price movements are mostly random and driven by unforeseen events.
The problem is in 1973, there were no Computer, Internet, Algorithmic trading, Quant Funds, AI, and Machine learning..!
Moreover, there were no Social Media like Reddit or Twitter that make the systematic repetitive market manipulations new normalcy..!
This chart presents the price movement of
NASDAQ:AAPL
NASDAQ:MSFT
NASDAQ:AMZN
NASDAQ:FB
NASDAQ:GOOG
and Major indexes:
TVC:SPX
TVC:NDX
Question 1:
Can you distinguish which line presents which stock or index?
Question 2:
Does it really matter to distinguish which one is which???
These 7 tickers have a significant positive correlation which means they will go Up/Down together, so if you are a trader don't waste your time, pick one and you can take a similar position in others with more than a 95% confidence interval. (either buy/sell)
*A perfectly positive correlation means that 100% of the time, the variables in question move together by the exact same percentage and direction.
**In exploratory studies, p-values enable the recognition of any statistically noteworthy findings. Confidence intervals provide information about a range in which the true value lies with a certain degree of probability, as well as about the direction and strength of the demonstrated effect.
Related Articles:
www.investopedia.com

Apple or Microsoft ???This comparison may sound like comparing Apples and oranges but from price movement and patterns they are almost identical.
In the past trading year, they have a Significant Positive correlation with a P-value of 0..!
This means they will go together in 100% of the cases..!
If you are interested in giant techs, buy and sell them together..!
1 Month:
3 Months:
6 Montha:
5 year:
Conclusion:
do not waste your time choosing one over the other, they are like CR7 and Messi of the financial market, fortunately, you can have both in your team.

What Is a Bubble?A comparison between Apple, Microsoft, Amazon, Google, Facebook, and Tesla in the past decade.
Top chart: last 10 years
Bottom chart: last trading year
A bubble is an economic cycle that is characterized by the rapid escalation of market value, particularly in the price of assets. This fast inflation is followed by a quick decrease in value or a contraction, which is sometimes referred to as a "crash" or a "bubble burst."
Typically, a bubble is created by a surge in asset prices that is driven by exuberant market behavior. During a bubble, assets typically trade at a price, or within a price range, that greatly exceeds the asset's intrinsic value (the price does not align with the fundamentals of the asset).
The cause of bubbles is disputed by economists; some economists even disagree that bubbles occur at all (on the basis that asset prices frequently deviate from their intrinsic value). However, bubbles are usually only identified and studied in retrospect, after a massive drop in prices occurs.
At the end of a bubble, resources are moved again, causing prices to deflate.
(Investopedia)
How could fundamental analysis explain this phenomenon?
Tesla's stock price has approximately outperformed more than 5x of Amazon, 11x of Apple, 15x of Microsoft, 16x of Facebook, and 30x of Google in the past 10 years.
It becomes more interesting if we look at the total annual revenue and net income of these companies..!
While Tesla had 31.53 Billion revenue and 690 million net income in 2020, in the very same timeframe, Apple had 274.15 Billion in revenue (9x of Tesla) and 57.41 billion net income (83x of Tesla), Microsoft had 143.01 B in revenue and 44.28 B net income (4.5x, 64x of Tesla), Amazon had 386.06 B in revenue and 21.33 B net income (+12x, 31x of Tesla ), Google had 182.35 B in revenue and 40.27 B net income( 5.8x and 58.36 Of Tesla) and Facebook had 86 B in revenue and 29.15 B net income( 2.7x and 42x of Tesla).
Based on the information provided, you can judge if Tesla is experiencing a bubble or not??? to answer this question, you should divide Tesla's stock price behavior from 2011 to May 2019, and what happened after that.
Moshkelgosha

Focus On What Matters The Most... Trend Trading!Sometimes as traders we tend to focus on every little move and get overwhelmed with price action.
I personally believe making your charts simple is the key to success!
1. Trend Trading
2. Risk Management
The 2 things that matter the most by far when it comes to trading. You as a trader need to step away from focusing on every price action move in the markets, and focus on trend. Trying to be overly aggressive on trying to capture exact bottoms and exact tops will only lead to more stress. With trend trading we can filter out a lot of the noise and focus on what matters the most!
Here we look to buy or sell when all 3 charts line up the same color to identify bigger moves in the markets. This is good for both swing trading and daytrading. The reason a lot of traders FAIL as daytraders is because they get lost in all of the noise on the lower timeframes and also try to play every breakout. If you just focus on trend you will have a better chance at becoming a better trader.
We than manage our risk whenever we do get a trend chop and learn how to get out of a trade and not let them run against us.
Trend + Risk Management = Happy Trader 😁

Upcoming earnings and year-to-date price action This chart shows the biggest companies reporting earnings this week and their year-to-date performance. Our platform makes earnings season a breeze. We give you the data, tools, and information you need to make the best possible decisions. In this post, we'll walk you through a few quick tips and tricks.
Earnings calendar
The earnings calendar is where you can find upcoming earnings reports, estimates, and fundamental stats to sort by including market cap. Bookmark the earnings calendar so that you never miss another earnings report.
Earnings on your chart
In your settings, you can add earnings labels to the chart. Go to your chart settings by right-clicking. Then click the Events tab and check the box that says Show Earnings on Chart. Now that your earnings labels are shown, hover over the Earnings icon (E) to see dates, estimates, and more.
Watchlist and earnings data
Located on the right-side toolbar, at the very top, is a button to open your watchlist and see more details about the chart you're looking at. If it's a publicly traded company you'll see fundamental data, earnings information, and recent price performance. This is invaluable for your research. Study price action while simultaneously understanding the financial history of a company.
Publish your ideas
Feel free to share this week's earnings with friends or to use it as inspiration to publish your own ideas. If you're planning any earnings trades, publish your charts and commentary about the following tickers so we can check them throughout the week:
Monday: IBM, HAL, LOGI
Tuesday: SNAP, KO, LMT, AMTD, IBKR, TXN, UAL, PM
Wednesday: TSLA, MSFT, CMG, CSX, LVS, BIIB, NDAQ
Thursday: INTC, TWTR, AAL, T, LUV, ALK, BX, FCX
Friday: VZ, AXP, SLB, HON
We hope you enjoyed this post. You can leave questions or feedback in the comments below. Thanks for reading!

Microsoft ($MSFT) and Apple ($APPL) 💻 | New Highs for the Market🐮🖥️🐮 Apple and Microsoft are giants of tech and some of the largest holdings of the major indexes. If these companies run, not to mention the other tech giants like Facebook and Alphabet, then the markets will almost certainly run with them.
Just look at the top 5 holdings of the S&P :
Microsoft Corporation 5.68%
Apple Inc. 5.60%
Amazon.com, Inc. 4.26%
Facebook, Inc. Class A2.16%
Alphabet Inc. Class A1.68%
Alphabet Inc. Class C1.68%
Here are the top 5 holdings of the Nasdaq :
Apple Inc. 11.83%
Microsoft Corporation 11.41%
Amazon.com, Inc. 10.25%
Facebook, Inc. Class A 4.35%
Alphabet Inc. Class A 3.88%
Alphabet Inc. Class C 3.85%
Here is the top DOW holdings With non-tech excluded (Microsoft is the 6th on the list, Apple is still #1):
Apple Inc.9.14%
Microsoft Corporation 5.07%
It should be obvious to you now what we mean when we say " if these stocks run, then the market runs ." We mean, they are the biggest parts of the major indexes!
This is good news for the bulls, because run is exactly what is about to happen based on historical trends.
Some people seem to think that these tech stocks rushing past new all-time-highs perhaps signals the top of not only these companies but the market. In fact, we commonly hear this sort of sentiment every time it happens. Reality is just the opposite.
The fact that these companies are breaking all-time-highs is actually bullish for them and the market as a whole.
On top of that, the news is bullish for these companies as well (COVID aside). We have new iPhones, a slick new MacBook Pro, a new Surface Duo, and a declaration against Face ID for Microsoft.
In short, there is nothing really substantial to bring these giants down aside from the broader market, but again, it is more likely they bring the market up. Don't take our word for it though, the historic patterns are clearly illustrated on our charts.
On the charts, you can see yellow horizontal lines marking off each new high. You can clearly see that the longstanding pattern is that breaking a new high is bullish for both Apple and Microsoft (with this being true in spite of any bearish disbelief).
In summary, breaking all-time-highs with conviction is bullish for the tech giants, which is bullish for the markets. So after that last break, our only questions are "when" and "how high?"
Resources: www.etf.com + www.forbes.com + www.forbes.com + www.foxnews.com + mspoweruser.com
✨ Drop a comment asking for an update, we do NEW setups every day! ✨
Like, Comment & Follow to help the community grow 🎉🎉
