Why Bitcoin Feels Stuck And What Options Have To Do With ItWhat are options? 🧾
- An option is a contract on Bitcoin.
-Calls = right to buy BTC later at a fixed price.
-Puts = right to sell BTC later at a fixed price.
Big traders and market‑makers hedge these contracts by buying or selling real BTC and futures. When there is a lot of options at a few key prices, their hedging can hold BTC in a tight range.
Why BTC feels stuck around 85k–93k 🧲
For December there is a lot of open interest around:
~85k (many puts).
~100k (many calls).
Because of this:
- When BTC moves up, dealers often sell to hedge → upside gets capped.
- When BTC moves down, they often buy → downside gets supported.
Result: price just chops sideways in a band, instead of trending strongly.
What changes after 26 December? 🎄➡️📈📉
On 26 December, a huge batch of Bitcoin options expires (tens of billions in notional value). When they expire:
- Those hedges are no longer needed.
- The “invisible wall” around 85k–100k weakens.
BTC is freer to move.
What that usually means:
Before 26 Dec: sideways range is likely to continue.
After 26 Dec: we can expect bigger, faster moves, either:
Up, if fresh spot buying / ETF inflows stay strong and macro is calm.
Or down, if sentiment turns risk‑off and new buyers don’t step in.
Optionstrading

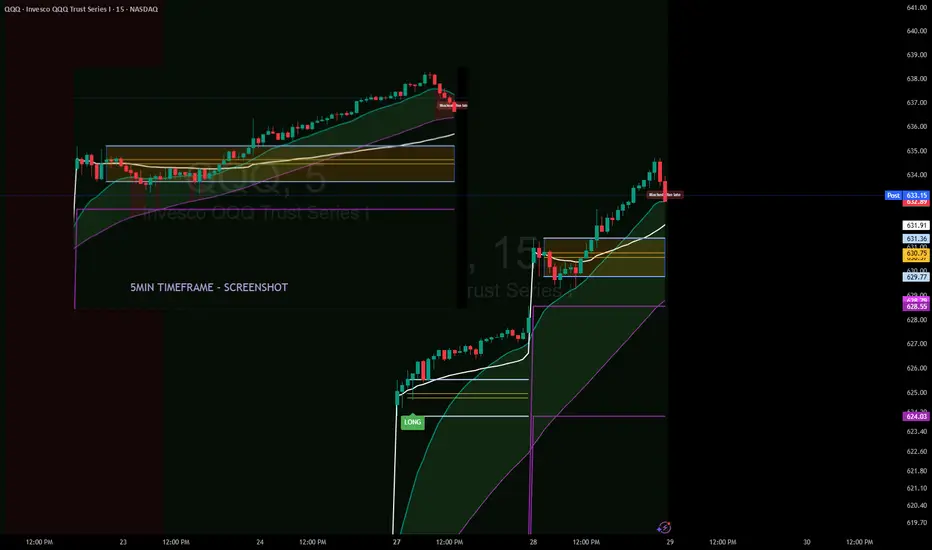
Trades with B – Daily Recap (Nov 6 2025)Ticker: QQQ / NQ1! (5 min & 15 min TF)
Strategy: ORB Pro + Golden Pocket Retest + Volume Filter
Focus: Confirmation Entry + HTF Trend Confluence
🧭 Market Context
The Nasdaq futures (NQ1!) opened with a sharp push into a key supply zone marked by the previous day’s Golden Pocket.
After an early fake push up, the market rolled over cleanly beneath the EMA cluster and the ORB box on both timeframes.
The first true confirmation signal came mid-morning — the 15 min and 5 min timeframes synced short, and the volume aligned perfectly with trend continuation.
🧠 Trade Review
Entry: 11:02 EST QQQ $613 Put (ORB Pro Short Trigger)
Exit: 11:35 EST — ORB extension target hit → secured profit into momentum flush
System Validation: Perfect alignment across EMA trend + HTF bias + retest rejection signal
P/L: +$199.78 net profit ( + $289.94 closed gain – $190.05 entry cost )
This trade was clean — confirmation entry, defined risk, and no over-trading.
📊 Performance Snapshot
Metric Value
Win Rate 100 % (today’s single trade)
Best Trade +$289.94
Largest Loss – $190.05
Net Result +$199.78 (Realized)
Setup Accuracy Excellent – Full confirmation alignment
📈 Chart Breakdown
The ORB Pro short triggered as price retested the upper Golden Pocket zone and failed to hold above the purple EMA band.
Both the 15 min and 5 min charts show a clean EMA curl-down with volume confirmation.
The short target zone was hit precisely before a small midday bounce, validating the system’s filter timing.
💡 Key Takeaways
Wait for alignment – when HTF and LTF agree, you get momentum moves.
Clean entry > early entry – confirmation beat anticipation again.
ORB Pro filter precision – blocked late entries, protecting the green.
🧘♂️ Reflection
“The setup was textbook — patience finally paid off. One trade, one signal, and one profit. The goal now is simple: keep filtering for these perfect alignments and size up responsibly as consistency builds.”
🧩 Next Steps
✅ Focus only on HTF + LTF confirmation signals
✅ Avoid re-entries once target zone is hit
✅ Document each setup screenshot for pattern library

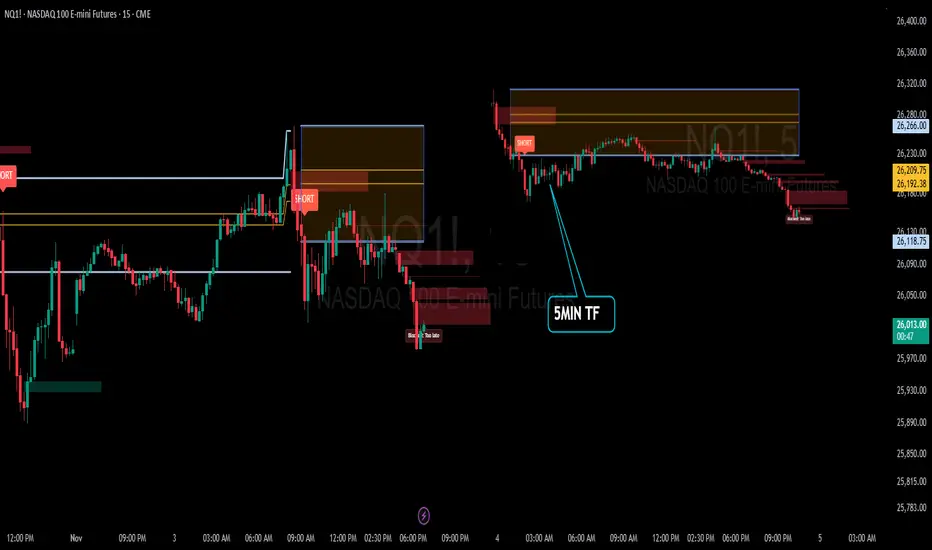
Recap: ORB Pro in Action | “Discipline > Direction”Date: November 3rd 2025
Ticker: QQQ / NQ1! (5-min TF)
Strategy: ORB Pro + Golden Pocket Retest + Volume Filter
Focus: Trend confirmation & controlled execution
🧭 Market Context
The morning opened sideways inside the ORB range — no clean conviction early on.
Around mid-morning, sellers gained control as lower highs formed beneath the EMA band and the Golden Pocket retest (0.5/0.618) failed with volume confirmation.
That break produced the clean short setup of the day, perfectly aligned with the higher-timeframe (HTF) downtrend.
🧠 Trade Review
Early Entries: Entered pre-confirmation and took initial heat.
Mid-Morning Setup: All filters aligned — EMA, volume, HTF direction. This was the textbook short that delivered follow-through.
Late Session Attempts: Momentum faded after lunch, with signals correctly blocked as “Too Late.”
Result: Several small wins offset by early losses, closing the day + $7.34 realized P/L after fees.
📊 Performance Snapshot
Metric Value
Win Rate ≈ 42 %
Best Trade + $287.94
Largest Loss – $189.05
Net Result + $7.34 (Realized)
Setup Accuracy High — execution mixed
📈 Chart Breakdown
The 5-minute chart highlighted a short trigger around 26 260 – 26 280, with smooth continuation into ORB extensions.
The ORB Pro filter marked “Blocked / Too Late” after the move — confirming that the system logic protected capital from late chases.
💡 Key Takeaways
Patience > Prediction — early entries rarely pay off.
Protect Green — partial profit lock once 1 R:R is reached.
System Strength — ORB Pro continues to validate structure when filters align.
🧘♂️ Reflection
“The system nailed the move — I jumped early. Still finished green, proving that execution discipline is the real edge. Tomorrow’s goal: one clean setup, one confident hold, and protect the profit.”
🧩 Next Steps
✅ Wait for full confirmation before entry
✅ Hold until 1:2 R:R min
✅ Avoid re-entries once HTF zone is tapped
Recap: No Signal? No Problem. Reading Price Like a ProFellow Traders,
I had some time today to do a quick recap — let’s break it down.
Opening Morning
What happened? Exactly what needed to happen: nothing.
No signal. No golden pocket retracements. Nothing worth forcing a trade.
We saw a break of the ORB at 10:40 AM on the 5-minute chart. A bearish candle closed just below that level, but there was no signal giving any conviction of a further move.
Between 10:00 AM and 10:20 AM, the 5-minute candles also showed no real conviction. Even though they played right in the Golden Pocket, there was no close inside the pocket itself.
Looking for confluences in other signals — particularly the 0DTE Context Indicator — price action on both the 5-minute and 15-minute charts never pushed below any of the EMA, SMA, or VWAP lines. Again, no conviction for the bears to step in.
First Entry
I played the waiting game today. My first trade on QQQ 0DTE didn’t happen until 11:05 AM. When I saw price holding above my lines and refusing to break lower, I knew a trade was setting up to the upside.
You’re probably wondering what kind of contracts I took.
I typically trade CALL or PUT options with a Greek Delta of 0.40 or higher, which puts me just under an ITM option. Once I’m in, I aim for a 50% profit target, which can come fast with the right move. The lower the Delta, the higher the risk — so I keep it tight.
If you want more details on how I time those entries, feel free to DM me.
Price Action Confirmation
After entering, I made a few additional plays as price began to push above my 0DTE Context Indicator lines. On the 5-minute chart, the candles between 12:05 PM and 12:20 PM played directly into the Golden Pocket — this gave me strong conviction that price was heading for new highs.
Final Thoughts
Today was a bit tricky. It required more patience and reading the tape than I would have liked. But as traders, we’ll see plenty of days like this. The key is to not overstay your welcome. Don’t force trades. Let price action finish its story before making your move.
I hope these recaps help you better understand how to use the indicators I’ve built. If you have any questions or feedback, drop a comment or DM me — I’d love to hear from you.
Thank you again for the continued support.
— TradeswithB
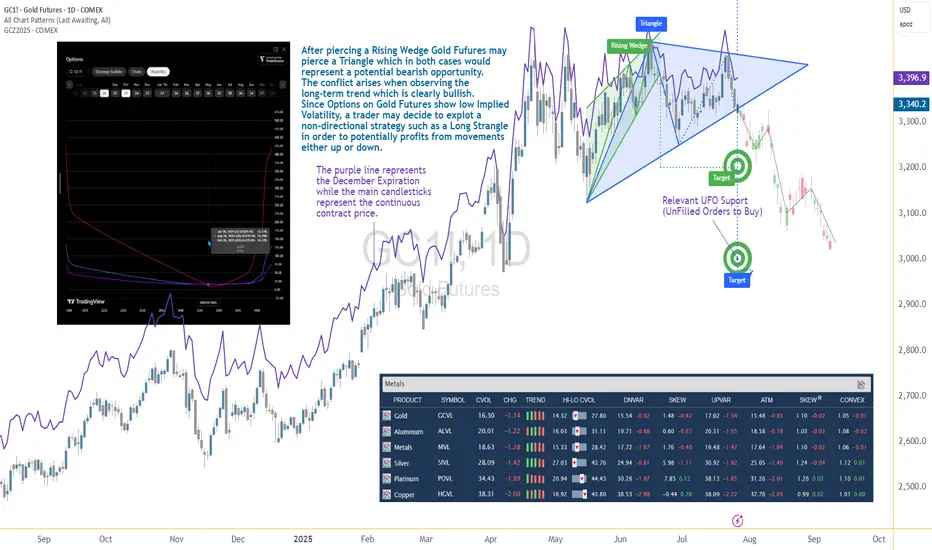
Options Blueprint Series [Intermediate]: Gold Triangle Trap PlayGold’s Volatility Decline Meets a Classic Chart Setup
Gold Futures have been steadily declining after piercing a Rising Wedge on June 20. Now, the market structure reveals the formation of a Triangle pattern nearing its apex — a point often associated with imminent breakouts. While this setup typically signals a continuation or reversal, the direction remains uncertain, and the conflict grows when juxtaposed with the longer-term bullish trajectory Gold has displayed since 2022.
The resulting dilemma for traders is clear: follow the short-term bearish patterns, or respect the dominant uptrend? In situations like these, a non-directional approach may help tackle the uncertainty while defining the risk. This is where a Long Strangle options strategy becomes highly relevant.
Low Volatility Sets the Stage for an Options Play
According to the CME Group’s CVOL Index, Gold’s implied volatility currently trades near the bottom of its 1-year range — hovering just above 14.32, with a 12-month high around 27.80. Historically, such low readings in implied volatility are uncommon and often precede sharp price movements. For options traders, this backdrop suggests one thing: options are potentially underpriced.
Additionally, an IV analysis on the December options chain reveals even more favorable pricing conditions for longer-dated expirations. This creates a compelling opportunity to position using a strategy that benefits from volatility expansion and directional movement.
Structuring the Long Strangle on Gold Futures
A Long Strangle involves buying an Out-of-the-Money (OTM) Call and an OTM Put with the same expiration. The trader benefits if the underlying asset makes a sizable move in either direction before expiration — ideal for a breakout scenario from a compressing Triangle pattern.
In this case, the trade setup uses:
Long 3345 Put (Oct 28 expiration)
Long 3440 Call (Oct 28 expiration)
With Gold Futures (Futures December Expiration) currently trading near $3,392.5, this strangle places both legs approximately 45–50 points away from the current price. The total cost of the strangle is 173.73 points, which defines the maximum risk on the trade.
This structure allows participation in a directional move while remaining neutral on which direction that move may be.
Technical Backdrop and Support Zones
The confluence of chart patterns adds weight to this setup. The initial breakdown from the Rising Wedge in June signaled weakness, and now the Triangle’s potential imminent resolution may extend that move. However, technical traders must remain alert to a false breakdown scenario — especially in trending assets like Gold.
Buy Orders below current price levels show significant buying interest near 3,037.9 (UFO Support), suggesting that if price drops, it may find support and rebound sharply. This adds further justification for a Long Strangle — the market may fall quickly toward that zone or fail and reverse just as violently.
Gold Futures and Micro Gold Futures Contract Specs and Margin Details
Understanding the product’s specifications is crucial before engaging in any options strategy:
🔸 Gold Futures (GC)
Contract Size: 100 troy ounces
Tick Size: 0.10 = $10 per tick
Initial Margin: ~$15,000 (varies by broker and volatility)
🔸 Micro Gold Futures (MGC)
Contract Size: 10 troy ounces
Tick Size: 0.10 = $1 per tick
Initial Margin: ~$1,500
The options strategy discussed here is based on the standard Gold Futures (GC), but micro-sized versions could be explored by traders with lower capital exposure preferences.
The Trade Plan: Long Strangle on Gold Futures
Here's how the trade comes together:
Strategy: Long Strangle using Gold Futures options
Direction: Non-directional
Instruments:
Buy 3440 Call (Oct 28)
Buy 3345 Put (Oct 28)
Premium Paid: $173.73 (per full-size GC contract)
Max Risk: Limited to premium paid
Breakeven Points on Expiration:
Upper Breakeven: 3440 + 1.7373 = 3613.73
Lower Breakeven: 3345 – 1.7373 = 3171.27
Reward Potential: Unlimited above breakeven on the upside, substantial below breakeven on the downside
R/R Profile: Defined risk, asymmetric potential reward
This setup thrives on movement. Whether Gold rallies or plunges, the trader benefits if price breaks and sustains beyond breakeven levels by expiration.
Risk Management Matters More Than Ever
The strength of a Long Strangle lies in its predefined risk and unlimited reward potential, but that doesn’t mean the position is immune to pitfalls. Movement is key — and time decay (theta) begins to erode the premium paid with each passing day.
Here are a few key considerations:
Stop-loss is optional, as max loss is predefined.
Precise entry timing increases the likelihood of capturing breakout moves before theta becomes too damaging. Same for exit.
Strike selection should always balance affordability and distance to breakeven.
Avoid overexposure, especially in low volatility environments that can lull traders into overtrading due to the potentially “cheap” options.
Using strategies like this within a broader portfolio should always come with well-structured risk limits and position sizing protocols.
When charting futures, the data provided could be delayed. Traders working with the ticker symbols discussed in this idea may prefer to use CME Group real-time data plan on TradingView: www.tradingview.com - This consideration is particularly important for shorter-term traders, whereas it may be less critical for those focused on longer-term trading strategies.
General Disclaimer:
The trade ideas presented herein are solely for illustrative purposes forming a part of a case study intended to demonstrate key principles in risk management within the context of the specific market scenarios discussed. These ideas are not to be interpreted as investment recommendations or financial advice. They do not endorse or promote any specific trading strategies, financial products, or services. The information provided is based on data believed to be reliable; however, its accuracy or completeness cannot be guaranteed. Trading in financial markets involves risks, including the potential loss of principal. Each individual should conduct their own research and consult with professional financial advisors before making any investment decisions. The author or publisher of this content bears no responsibility for any actions taken based on the information provided or for any resultant financial or other losses.
Scalping with ATM Options Using Candle + OI Confirmation!Hello Traders!
If you love quick entries and fast exits with defined logic, then ATM Option Scalping is your game. But scalping without confirmation often leads to stop-loss hits. That’s why combining candlestick structure with live Open Interest (OI) data gives you a serious edge. Let’s break down the exact setup I use to scalp with ATM options in Nifty & BankNifty .
Why ATM Options for Scalping?
Better Liquidity: ATM strikes have tight spreads and high volumes, making execution quick and efficient.
Quick Premium Movement: Even small index moves reflect fast in ATM premiums.
Less Theta Decay (Intraday): Within first half of day, theta doesn’t hurt much. Scalping avoids time decay traps.
Scalping Strategy: Candle + OI Confirmation
Step 1 – Watch 5-Min Candle Setup:
Look for strong breakout candles, bullish/bearish engulfing, or reversal candles at key zones like VWAP/PDH/PDL.
Step 2 – Confirm with OI Shift:
Check ATM strikes on option chain.
Put OI rising + Price sustaining = bullish confirmation.
Call OI rising + Price rejecting = bearish confirmation.
Step 3 – Take Trade in ATM Option:
Enter CE or PE near breakout candle close with proper SL below/above that candle.
Step 4 – Exit Fast (Scalp Mode):
Book partial profits at 30–40% or when next resistance/support is hit. Avoid overholding!
Bonus Risk Management Tips
Avoid Trading Near News or Events: OI gives false signals in high volatility zones.
1 Trade = 1 Risk Unit Only: Do not revenge trade. Scalping is about accuracy, not frequency.
Trade only when both candle + OI align: No confirmation = no entry.
Rahul’s Tip
Let the chart speak, but let the OI validate. When both agree — that’s where scalpers win big.
Conclusion
Scalping with ATM options using candle structure + OI shift is a powerful setup if executed with discipline. It’s fast, clean, and logical. Focus on 1–2 setups a day — and make them count.
Do you scalp ATM options? Share your entry rules or struggles in the comments below!

Options Blueprint Series [Intermediate]: Optimal Options StrikesI. Introduction
Options on futures offer traders a flexible way to participate in market movements while managing risk effectively. The Japanese Yen Futures (6J) market provides deep liquidity, making it a preferred instrument for options traders. In this article, we will explore how to optimize Bull Call Spreads in Yen Futures (6J) by understanding price equivalency and strike selection.
One of the most critical aspects of trading options on futures is recognizing that continuous futures charts and contract-specific charts display different prices. This discrepancy must be accounted for when setting up trade entries and exits. Additionally, strike price selection significantly impacts the reward-to-risk ratio, breakeven price, and probability of profitability.
By identifying key support and resistance levels (UFO), we will define trade setups that likely align with market structure, targeting precise entry and exit points. We will also compare different Bull Call Spread variations to understand how adjusting the strike selection impacts risk and potential reward.
II. Understanding the Japanese Yen Futures Contract
Before diving into the options strategy, it is essential to understand the specifications of the CME-traded Japanese Yen Futures (6J) contract:
Contract Size: Each futures contract represents 12,500,000 Japanese Yen
Tick Size: 0.0000005 USD per JPY (equivalent to $6.25 per tick)
Trading Hours: Nearly 24-hour trading cycle with short maintenance breaks
Margin Requirements: Currently $2,900 (varies through time).
For this article, we focus on December 2025 Yen Futures (6JZ2025). Since the market price displayed on continuous charts (6J1!) differs from contract-specific charts, we need to establish price equivalencies to align our trade analysis.
III. Price Equivalency Between Continuous and Contract-Specific Futures
Futures traders commonly use continuous charts (such as 6J1!) for analysis, but when trading options, it is crucial to reference the specific futures contract month (such as 6JZ2025). Due to roll adjustments and term structure variations, prices differ between these two charts.
In this setup, we identify key UFO-based support and resistance levels and adjust for contract-specific price equivalency:
Support Level Equivalency: 0.0066325 (6J1!) = 0.0068220 (6JZ2025)
Resistance Level Equivalency: 0.0069875 (6J1!) = 0.0072250 (6JZ2025)
These adjusted price levels ensure that the trade is structured accurately within the December 2025 contract, aligning option strikes with meaningful technical levels.
IV. The Bull Call Spread Strategy on Yen Futures
A Bull Call Spread is a vertical options spread strategy used to express a bullish outlook while reducing cost and limiting risk. This strategy involves:
Buying a lower-strike call (gaining upside exposure)
Selling a higher-strike call (reducing cost in exchange for capping maximum profit)
This setup provides a defined risk-reward structure and is particularly useful when targeting predefined resistance levels. Given that we identified 0.0068220 as support and 0.0072250 as resistance, we will structure multiple Bull Call Spreads to compare strike selection impact.
Now that the trade structure is established, let’s explore how different strike selections affect risk, reward, and breakeven prices.
V. Strike Selection and Its Impact on Risk-Reward Ratios
Selecting the appropriate strike prices is crucial when structuring a Bull Call Spread, as it directly affects the breakeven price, maximum risk, and maximum reward. To illustrate this, we compare three different Bull Call Spread variations using December 2025 Yen Futures (6JZ2025).
1. 0.00680/0.00720 Bull Call Spread
Breakeven: 0.006930
Maximum Risk: -0.00013
Maximum Reward: +0.00027
2. 0.00680/0.00750 Bull Call Spread
Breakeven: 0.0069789
Maximum Risk: -0.00018
Maximum Reward: +0.00052
3. 0.00680/0.00700 Bull Call Spread
Breakeven: 0.006879
Maximum Risk: -0.00008
Maximum Reward: +0.00012
Observing these variations, key insights emerge. The 0.00680/0.00750 spread offers the highest potential reward but comes with the highest breakeven and greater risk. Meanwhile, the 0.00680/0.00700 spread minimizes risk but provides a lower profit potential. Strike selection, therefore, becomes a balance between profitability potential and probability of success.
A wider spread (such as 0.00680/0.00750) has a higher reward-to-risk ratio, but it requires the price to move further before generating profits. Conversely, a narrower spread (like 0.00680/0.00700) has a lower breakeven price, increasing the probability of profitability but limiting potential upside.
VI. Trade Plan for a Bull Call Spread
Based on the analysis of strike selection, a balanced trade plan can be structured using the 0.00680/0.00720 Bull Call Spread, which offers a favorable reward-to-risk ratio while maintaining a reasonable breakeven price.
Market Bias: Bullish, expecting a move toward resistance
Selected Strikes: Long 0.00680 call, short 0.00720 call
Breakeven Price: 0.006930
Target Exit Price: 0.0072250
Maximum Risk: -0.00013
Maximum Reward: +0.00027
Reward-to-Risk Ratio: 2.08:1
This setup capitalizes on the previously identified UFO support to define the entry point, while the UFO resistance provides a target for exit. The breakeven price remains at a reasonable level, ensuring a greater probability of the spread moving into profitability.
VII. Risk Management Considerations
While the Bull Call Spread limits risk compared to outright long calls, proper risk management is still necessary. Traders should consider the following:
Using Stop-Loss Orders: If price breaks below the UFO support level at 0.0068220, traders may exit the position early to avoid excessive losses.
Hedging with Puts: If volatility spikes or market sentiment shifts, a put option or put spread can serve as a hedge against adverse movements.
Position Sizing: Adjusting contract size ensures that total exposure remains within acceptable risk limits based on account size.
Time Decay Considerations: Since time decay negatively impacts long call options, traders should monitor the spread's profitability as expiration approaches and adjust positions accordingly.
By implementing these risk management techniques, traders can optimize their Bull Call Spread strategy while mitigating unnecessary exposure.
When charting futures, the data provided could be delayed. Traders working with the ticker symbols discussed in this idea may prefer to use CME Group real-time data plan on TradingView: www.tradingview.com - This consideration is particularly important for shorter-term traders, whereas it may be less critical for those focused on longer-term trading strategies.
General Disclaimer:
The trade ideas presented herein are solely for illustrative purposes forming a part of a case study intended to demonstrate key principles in risk management within the context of the specific market scenarios discussed. These ideas are not to be interpreted as investment recommendations or financial advice. They do not endorse or promote any specific trading strategies, financial products, or services. The information provided is based on data believed to be reliable; however, its accuracy or completeness cannot be guaranteed. Trading in financial markets involves risks, including the potential loss of principal. Each individual should conduct their own research and consult with professional financial advisors before making any investment decisions. The author or publisher of this content bears no responsibility for any actions taken based on the information provided or for any resultant financial or other losses.

COFORGE Options Trading Strategy: Breakout and Momentum-BasedIn this post, we’ll explore a couple of options strategies for COFORGE using the data for strike price 9000 . By closely monitoring the price action and key option data, we can make informed decisions that align with market trends. Here’s how we can approach trading this stock’s options effectively:
Key Option Data Breakdown
Call Short Covering: Indicates that the market sentiment is bullish as traders are closing their call positions, signaling a potential upward movement.
Put Writing: A strong sign of bullishness as traders are actively writing puts, expecting the price to stay above the 9000 strike.
Call and Put LTP (Last Traded Price):
Calls LTP: 278.8 (indicating that calls are gaining traction).
Puts LTP: 100.7 (a lower LTP for puts suggests lower demand).
Open Interest (OI) and Change in OI:
Calls OI Change: -47,850 (indicating a reduction in call positions due to short covering).
Puts OI Change: +123,975 (signifying an increase in put writing, which reinforces the bullish sentiment).
Strategy 1: Buying the Call or Put Based on the First 5-Minute Candle
This strategy involves observing the price movement in the initial 5 minutes after the market opens and deciding whether to buy a call or put, depending on the price action and option data.
When to Buy the Call or Put:
If the first 5-minute candle shows a bullish move, consider buying the call option as the market sentiment appears to be in favor of upward movement.
If the first 5-minute candle shows a bearish move, consider buying the put option. However, given the overall data showing strong put writing, this could be less likely.
Why It Works:
The first 5 minutes are crucial for gauging market sentiment, and with the data indicating strong bullishness (due to call short covering and put writing), a call option is likely to perform well.
Considerations:
This strategy requires watching for clear momentum during the first 5 minutes. If the market remains indecisive, it may be better to stay on the sidelines to avoid wasting premium.
Strategy 2: Breakout Strategy – Buy Calls or Puts on the Break of Highs
This strategy involves waiting for a breakout of the call or put’s high price. The breakout indicates a shift in momentum, and we’ll enter the trade based on whichever direction triggers first.
When to Buy the Call:
Watch for the call’s high price (389.85). If the call option breaks this level, it signals that the upward momentum is gaining strength. Buy the call to capitalize on the breakout.
When to Buy the Put:
If the call option doesn’t break its high and the price starts to show weakness, consider buying the put once it breaks its high (360.6). However, the data suggests that the market bias is bullish, so a call breakout is more likely.
Why It Works:
Breakouts are powerful signals of market momentum. Since the data shows heavy put writing, the call option is more likely to break its high first. This creates an opportunity to buy calls in a bullish trend.
Considerations:
Always monitor the volume and the price action for confirmation of the breakout. If both calls and puts test their highs without clear direction, consider waiting for a clearer signal.
Conclusion:
Given the strong bullish sentiment reflected in the options data—call short covering and put writing—the most reliable strategy is Strategy 2. Watch for a call breakout above 389.85 or a put breakout above 360.6 (if the call fails to break its high). The bullish bias suggests that the call option is more likely to outperform, but a breakout in either direction can trigger the strategy.
Pro-Tip: Set a stop loss just below the breakout level to manage risk effectively. The market sentiment is heavily tilted towards bullishness, so a call option breakout is the most probable outcome.

Options Indicator Explained - so you can SEE what you tradeEver since we created this indicator back around 2020 on the TradingView platform it is so far the best platform for our analysis, research, coding, and development of different trading tools. This was 4 years ago, but we have been with TradingView almost for a decade !
The whole concept of this indicator came when a long time ago we read the big big book of options, and could not understand how come the stock price moved up but our calls are losing money ! Yes, we have been there too. And then came this indicator to life. We don't make a trade without it ever since. If you saw the video, you clearly know why.
Let's delve into some key concepts that can elevate your trading game:
### 1. Visualizing Profit and Loss
One of the most powerful tools in an options trader's arsenal is the ability to plot profit and loss lines on a chart. This visualization helps you understand the time decay of the options you buy or sell. By seeing how your potential profits or losses change over time, you can make more informed decisions about when to enter or exit trades.
### 2. Moving Beyond the Greeks
The Greeks—Delta, Gamma, Theta, and Vega—are often emphasized in options trading, but their standalone value can be limited. What truly matters is how these metrics impact your profit and loss curvature. Think of it like driving a car: while an acceleration meter provides some information, what you really need is the speedometer and a clear view of the road. Focusing on the profit and loss curves allows you to grasp the real impact of these factors on your trades.
### 3. Identifying Pivot Points
By observing profit and loss lines, you gain insights into optimal entry and exit points. Placing trades at pivot points can enhance your reward-to-risk ratios. Certain options offer generous room for stop-loss placement and quick profits if you choose pivot points where price rejections are likely. Seeing these lines helps confirm that your trading idea has a high probability of success.
### 4. Conducting Volatility Simulations
Professional volatility testing with your indicator is crucial. It allows you to anticipate how changes in volatility will affect your options' profit and loss. Each case is unique and dependent on the underlying stock, so it's vital to have contingency plans and avoid trading blindly. You must always take into account that the volatility can drop or rise against you, and you need to see that even if it happens, you will still be okay, and not be a dreamer. Reality is everything, trade realistically.
### 5. Timing Your Trades
Boost your performance by understanding how much profit you can lose (when buying options) or gain (when selling options) over the duration of your trade. This knowledge helps you make better timing decisions and manage your trades more effectively while you are inside the trade. In some trades you can clearly see that you just don't have the time to survive a correction and then wait for the next pulse wave to come and save you, you can see clearly that it is better to take profit today, since you just do not have enough time for a correction and a bounce back to the current profitable price. In options, what it is profitable today is NOT profitable tomorrow. I show you this in the video.
### 6. Simplifying with Profit Lines
You don't need to rely heavily on the Greeks anymore. Profit lines already account for these metrics, freeing your mind to focus on price action. This approach eliminates the confusion often associated with the non-linear behavior of options, rooted in complex models like Black-Scholes.
### 7. The Black-Scholes Model and Implied Volatility
Understanding the Black-Scholes model and implied volatility is fundamental. These concepts help you grasp how options are priced and how market conditions can impact their value. Using the indicator, you don't need even to know who or what is the Black-Scholes Model, since it does all the work and heavy lifting for you, by plotting you exactly what you truly need... Where you make a profit, where you will make a loss, and how much (profit lines).
### 8. In the Money vs. Out of the Money
Knowing the difference between "in the money" and "out of the money" options is crucial. In-the-money options have intrinsic value, while out-of-the-money options are more speculative and rely on price movements to become profitable.
### 9. Short-Term vs. Long-Term Options
Short-term call options offer quick potential gains but come with higher risks due to time decay. Long-term call options, on the other hand, provide more time for your trade to work out, reducing the impact of time decay but often requiring a larger capital investment. I show a clear example in the video.
### 10. Maintaining Reward-to-Risk Ratios
You should make sure you always maintain the reward-to-risk ratios in your favor BEFORE you enter the trade, this is what keeps you in the game and makes you thrive and not just survive. Do you think they let a pilot to land an airplane, just with his "gut feeling" or do they give them an indicator to SEE the runway? If you don't see your profit and loss lines, you don't see the runway when you land your plane. We've all seen those wallstreetbets BLIND crash landings in options and know how they end before they started. This can and should be avoided, always know your risk, and your potential reward.
### 11. Proof of Accuracy
Finally, reliable indicators provide proof of accuracy, showing you the same profit or loss you'd experience given stock movements and implied volatility changes. This consistency gives you confidence in your trades, eliminating confusion and preventing unexpected losses.
In the end of the video, there is proof of the accuracy, that the indicator in did shows you the same profit or loss you will have in the position, given the stock movement and implied volatility changes, so you can rest assured that your landing indicator will not surprise you no matter the weather, you will have full control on your options trade. No more the feeling of confusion and then your fast profit crushes to zero or even a loss and you don't know why.
Master these concepts, and you'll have a robust framework for navigating the complexities of options trading with precision and confidence.

How to PROTECT your profits while letting them runIn the trading business you need to let your profits run while also managing your risks that means to cut your losses short.
Losses of unrealized profits are real profits that are lost. What if you could save them?
Well, there is a way...
It is not always available but it is one you want to know since if you can save 3 points of wiggle room and pay 1 point or less, over the long run it adds up to HUGE chunk of profit to your bottom line.
The reason I applied this method is because TSLA was doing 3 days in a row a push and gap up, so it seems likely people will want to take profits... but this is TSLA... it can shoot up above 500 and reach who knows where... (she did it before...).
So I want to TAKE MY HUGE profit, while giving it the option to continue to the moon, if it will want to do so...
You can never take the very top anyway, so if you "give back" 1 point of profit it is considered reasonable, but if in case the price falls down sharply or gapped down I can give back maybe 3 points with this strength of volatility, which is undesireable.
So what I did?
I sold the PUT option at strike 470 at a price of $15 (my point was $17) so for me it is even less than a point so it is very attractive deal to me...
Then... if the price had crushed down it meant for me that I sold my stocks at a price of 470 while paying the hedge cost of the PUT option of 15 so it is equivalent to me that I sold my stock at a price of 455, which is ALMOST the top. Making sure ~90% of the profit stays in my pocket. So I WIN.
If the price would continue to shoot up, then I making SUPER HUGE MONEY, while sleeping like a baby, that I already realized my HUGE profit. So I WIN.
So either way, I WIN !
Since the price did not crushed the next day and hold, and my stop loss advanced, so there was no longer need to my PUT option hedge since if price will fall I will get out with the stop loss with the same profit. So I sold the PUT hedge for a small loss, so the hedge cost me 0.25 a point overall. SUPER WORTH IT !
FYI, this comes from years of experience, but I give you some of my experience, you could do it too.
The moral of the story... when you have HUGE profit, and you feel itchy to take profit, don't ! and try to hedge yourself with options ! this way, if you were wrong and you have GME, AMC on your hand, you don't let them go, and you WIN either way ! Sleeping like a baby.

Crypto Options Trading: A Beginner's GuideCrypto options trading is emerging as a popular way for traders to hedge risk, amplify profits, and diversify their trading strategies. As the cryptocurrency market matures, options trading is gaining traction among both traditional and crypto-native traders who seek a new way to leverage the volatility of digital assets. Here’s an in-depth look at what crypto options are, why they’re compelling, and how to navigate this evolving market.
What Are Crypto Options?
In simple terms, a crypto option is a financial contract that gives the trader the right—but not the obligation—to buy or sell an underlying asset (like Bitcoin or Ethereum) at a predetermined price, known as the “strike price,” within a specific time frame. Options can either be:
Call Options: These give the holder the right to buy the underlying asset at the strike price.
Put Options: These allow the holder to sell the underlying asset at the strike price.
Crypto options can be a valuable tool to manage risk in a market characterized by high volatility. The premium paid for an option can be significantly lower than the outright purchase of the cryptocurrency, allowing traders to gain exposure with limited capital at risk.
Why Trade Crypto Options?
The benefits of trading crypto options go beyond just leveraging price movements. Here are some core reasons why crypto options have become attractive:
Hedging: Options allow investors to hedge against adverse price movements. For example, a Bitcoin holder can buy put options to offset potential losses if Bitcoin’s price drops.
Leverage: Options provide leverage, allowing traders to control a large position with relatively small capital. This magnifies potential gains, though it also increases potential losses.
Profit in All Market Conditions: Options strategies can be designed for various market conditions—bullish, bearish, or even sideways. This flexibility can be a game-changer in the highly volatile crypto market.
Limited Downside Risk: When buying options, the maximum loss is limited to the premium paid, making it a potentially safer way to speculate than futures or spot trading.
Key Terms in Crypto Options Trading
Before diving into trading strategies, it's essential to understand the core terms:
Premium: The cost of purchasing the option, which the buyer pays to the seller.
Strike Price: The predetermined price at which the option can be exercised.
Expiration Date: The date at which the option contract expires.
In-the-Money (ITM): When an option has intrinsic value. For example, a call option is ITM if the underlying asset’s price is above the strike price.
Out-of-the-Money (OTM): When an option has no intrinsic value. For example, a put option is OTM if the asset’s price is above the strike price.
Mention the key terms related to the option shown in the image below.
Types of Crypto Options
Crypto options primarily fall into two types:
American Options: These can be exercised at any time before expiration.
European Options: These can only be exercised at expiration.
Most crypto exchanges offering options (such as CoinCall, Binance) focus on European-style options due to their simplicity and cost efficiency.
Popular Crypto Options Trading Strategies
Long Call: This involves buying a call option when you expect the price to rise. The upside potential is unlimited, while the maximum loss is limited to the premium paid.
Long Put: Ideal for bearish outlooks, buying a put option allows you to profit from a price decline. Again, the maximum risk is limited to the premium.
Covered Call: For this, you hold a long position in the asset and sell a call option. This generates income through the premium while capping potential gains if the price rises beyond the strike price.
Protective Put: Similar to a stop-loss, a protective put allows you to hold a long position while buying a put option to protect against downside risk.
Straddle: A strategy for high volatility, a straddle involves buying a call and a put option at the same strike price and expiration. Profits occur if the price moves significantly in either direction.
Strangle: Like a straddle but with different strike prices for the call and put options. It’s a good strategy if you expect volatility but aren’t sure of the direction.
Risks of Crypto Options Trading
While crypto options trading provides flexibility, it comes with risks:
Volatility Risk: Crypto markets are highly volatile, and while this is favorable for some options strategies, extreme fluctuations can result in significant losses.
Liquidity Risk: Not all crypto options have high liquidity, especially for less popular assets. This can lead to wider spreads and difficulty in executing trades at desired prices.
Complexity: Options trading requires a deep understanding of various strategies and how options prices react to market changes. Without adequate knowledge, traders can incur losses.
Time Decay: Options lose value as expiration approaches (especially for OTM options). This phenomenon, known as “theta decay,” can erode potential profits if the market doesn’t move favorably soon enough.
Key Metrics in Crypto Options: The “Greeks”
To understand the dynamics of options pricing, traders should familiarize themselves with the “Greeks,” which measure the sensitivity of the option’s price to various factors.
Delta: Measures how much the option’s price changes with a $1 change in the underlying asset’s price.
Gamma: Measures the rate of change of delta over time.
Theta: Represents time decay, showing how much value the option loses each day as it nears expiration.
Vega: Measures the sensitivity of the option’s price to changes in volatility.
Rho: Indicates how much the option’s price changes with a change in interest rates, which is often minimal in the crypto space.
Crypto options trading provides a valuable addition to a trader’s toolkit, offering flexibility and an alternative way to profit from market volatility. Whether you’re looking to hedge a position, profit from volatility, or speculate with defined risk, crypto options can be highly beneficial. Yet, success in options trading doesn’t come from guesswork; it requires a solid understanding of the mechanics, diligent strategy testing, and constant risk assessment. For those who put in the time to learn and adapt, crypto options trading can open new avenues for profit in an ever-evolving market.

Options: Why the Odds Are Stacked Against YouThe Hidden Challenges of Options Trading:
Options trading may seem like an exciting way to profit from market movements, but beneath the surface lies a trading environment that is heavily biased against individual traders. Many retail investors jump into options trading unaware of the many disadvantages they face, making it more of a gamble than a calculated investment. In this post, we’ll explore the major challenges that make options trading so difficult for individual traders and why you need more than luck to succeed.
1. The Odds Are Biased: Complex Algorithms Unlevel the Playing Field
The first thing to understand is that the playing field is not even. Professional traders and market makers use complex algorithms that evaluate a wide range of factors—volatility, market conditions, historical data, time decay, news and more—before they even think about entering a trade. These systems are designed to assess risks, manage exposure, and execute trades with a precision that most individual traders simply can’t match.
For an individual trader, manually analyzing these factors or using basic tools available online is nearly impossible. By the time you’ve analyzed one factor, the market may have already shifted. The reality is that unless you have access to these advanced algorithmic systems, you're trading with a massive handicap.
2. Market Makers Hold the Upper Hand: Your Trades Are Their Game
Market makers play a critical role in options trading by providing liquidity. However, they also hold an unbeatable advantage. They see both sides of the trade, control the bid-ask spreads, and use their position to ensure they’re on the winning side more often than not. For them, it’s not about making speculative bets; it’s about managing risk and profiting from the flow of orders they receive.
When you trade options, you're often trading against these market makers, and their strategies are designed to maximize their advantage while minimizing their risk. This means your trades are, in essence, a bad gamble from the start. The house always wins, and in this case, the house is the market maker.
3. They Will Fool You Every Time: Bid-Ask Spreads and the Math You Don’t See
One of the most overlooked challenges in options trading is understanding the bid-ask spread. This spread represents the difference between the price you can buy an option (ask) and the price you can sell it (bid). While this may seem straightforward, it’s an area where professionals easily outsmart retail traders.
Advanced traders and market makers use complex mathematical models to manage and manipulate these spreads to their advantage. If you don’t have the mathematical skills to properly evaluate whether the spread is fair or skewed, you’re setting yourself up to overpay for options, leading to unnecessary losses.
4. Information and Tools: A Professional-Only Advantage
Another critical challenge is the vast difference in information and tools available to retail traders versus professionals. Institutional traders have access to data streams, proprietary tools, and execution platforms that the average trader can only dream of. They can monitor market sentiment, analyze volatility in real-time, and execute trades at lightning speed, often milliseconds faster than any retail investor.
These tools give professionals an enormous edge in identifying trends, hedging positions, and managing risk. Without them, individual traders are flying blind, trying to compete in an arena where the best information is reserved for the pros.
5. Volatility and Time Decay: The Ultimate Account Killers
Two of the most critical factors in options trading are volatility and time decay (known as theta). These are the silent killers of options accounts, and pros use them to their advantage.
Volatility: When volatility increases, option prices go up, which might sound great. However, volatility is unpredictable, and when it swings in the wrong direction, it can destroy your position’s value almost overnight. Professionals have sophisticated strategies to manage and hedge against volatility; most individual traders don’t.
Time Decay: Time is constantly working against you in options trading. Every day that passes, the value of an option slowly erodes, and as expiration approaches, this decay accelerates. For most retail traders, this is a ticking time bomb. Pros, on the other hand, know how to structure trades to profit from time decay, leaving amateurs at a disadvantage.
Conclusion: Trading Options Is No Easy Game
The challenges of options trading are real and significant. Between the advanced algorithms, the market makers’ advantages, the mathematical complexities of bid-ask spreads, and the tools and information reserved for professionals, the odds are stacked against you. Add to that the constant threat of volatility and time decay, and it’s clear that options trading is a difficult and often losing game for individual traders.
If you’re thinking about jumping into options trading, it’s crucial to understand the risks involved and recognize that the deck is stacked. To succeed, you need more than just a basic understanding—you need tools, strategy, and a deep awareness of how the pros operate. Without that, you're gambling, not trading.

Options Trading PrimerTradingView has recently introduced the Options Strategy Builder, a powerful tool designed to help you learn the mechanics of options trading and create efficient strategies. In this video, I explain the basics of options trading and demonstrate how to use the Strategy Builder. This video is helpful for those who are new to options but wish to explore this area.

Options Blueprint Series: Bear Put Diagonal Fly on Euro FuturesIntroduction
Euro FX EUR/USD Futures are a key instrument in the futures market, allowing traders to speculate on the future value of the Euro against the US Dollar. Trading Euro FX EUR/USD Futures provides exposure to the currency markets, enabling traders to hedge risk or capitalize on market movements.
Key Contract Specifications:
Contract Size: 125,000€
Tick Size: 0.00005
Tick Value: $6.25
Margin Requirements: Approximately $2,100 (varies by broker and market conditions and changes through time)
These contract specs are crucial for understanding the potential profit and loss scenarios when trading Euro Futures. The tick size and value help determine the smallest price movement and its monetary impact, while the margins indicate the amount of capital required to initiate a position.
Strategy Explanation
The Bear Put Diagonal Fly is an advanced options strategy designed to profit from a bearish market outlook. This strategy involves buying and selling put options with different expiration dates and strike prices, creating a diagonal spread.
Bear Put Diagonal Fly Breakdown:
Buy 1 Put (longer-term expiration): This long put provides downside protection over a longer period, benefiting from a significant decline in the underlying asset.
Sell 1 Put (intermediate-term expiration): This short put helps to offset the cost of the long put, generating premium income and partially financing the trade.
Buy 1 Put (shorter-term expiration): This additional long put offers further downside protection, particularly for a shorter duration, enhancing the overall bearish exposure.
Purpose of the Strategy: The Bear Put Diagonal Fly is structured to take advantage of a declining market with specific price movements over different time frames. The staggered expiration dates allow the trader to benefit from time decay and volatility changes.
Advantages:
Cost Reduction: The premium received from selling the put helps to reduce the overall cost.
Enhanced Bearish Exposure: The additional shorter-term put provides extra exposure.
Flexibility: The strategy can be adjusted or rolled over as market conditions change.
Potential Risks:
Time Decay: If the market does not move as expected, the long puts may lose value due to time decay.
Volatility Risk: Changes in market volatility can impact the value of the options.
Application on Euro Futures
To apply the Bear Put Diagonal Fly strategy on Euro Futures, careful selection of strike prices and expiration dates is crucial. This strategy involves three options positions with different expirations to optimize the potential profit from a bearish market move.
Selecting Strike Prices and Expiration Dates:
Long Put (longer term): Choose a strike price above the current market price of Euro Futures to benefit from a significant decline.
Short Put (intermediate term): Select a strike price closer to the market price to maximize premium income while reducing the overall cost of the strategy.
Long Put (shorter term): Pick a strike price below the market price to provide additional bearish exposure.
Why This Strategy is Suitable for Euro Futures:
Market Conditions: As seen on the upper chart, the current market outlook for the Euro suggests potential downside due to technical factors, making a bearish strategy appropriate.
Volatility: Euro Futures often experience significant price movements, which can be advantageous for the Bear Put Diagonal Fly strategy, as it thrives on volatility.
Flexibility: The staggered expiration dates allow for adjustments and management of the trade over time, accommodating changing market conditions.
Futures (underlying using the 6E1! continuous ticker symbol) Entry, Target, and Stop-Loss Prices:
Short Entry: 1.09000
Target: 1.08200
Stop-Loss: 1.09400
Options Trade Setup (using Futures September cycle with 6EU2024 ticker symbol):
The Bear Put Diagonal Fly on Euro Futures involves a structured approach to setting up the trade. Here’s a step-by-step guide to executing this strategy:
1. Buy 1 Put (Sep-6 expiration):
Strike Price: 1.095
Premium Paid: 0.0102 (or $1,275 per contract)
2. Sell 1 Put (Aug-23 expiration):
Strike Price: 1.09
Premium Received: 0.0061 (or $762.5 per contract)
3. Buy 1 Put (Aug-9 expiration):
Strike Price: 1.085
Premium Paid: 0.0021 (or $262.5 per contract)
Risk Calculation:
Net Cost = ($1,275 + $262.5) - $762.5 = $775
Risk: The initial net cost of the strategy. Risk = $775
Trade and Risk Management
Effective risk management is essential when trading options strategies like the Bear Put Diagonal Fly on Euro Futures. Effectively managing the Bear Put Diagonal Fly on Euro Futures is crucial to optimize potential profits and mitigate risks. Here are common guidelines for managing this options strategy:
Using Stop-Loss Orders:
In the Bear Put Diagonal Fly strategy, setting a stop-loss at 1.0940 ensures that if Euro Futures move against the expected direction, the losses are contained.
Avoiding Undefined Risk Exposure:
The Bear Put Diagonal Fly is a defined risk strategy, meaning the maximum loss is known upfront and limited to the initial net cost.
Precise Entries and Exits:
Timing the Market: Entering and exiting trades at the right time is crucial. Using technical analysis tools such as UFO Support or Resistance levels can help identify optimal entry and exit points.
Monitor Time Decay:
Keep a close eye on how the time decay (theta) impacts the value of the options. As the short put approaches expiration, assess whether to roll it to a later date or let it expire.
Volatility Changes:
Changes in market volatility can affect the strategy’s profitability.
Rolling Options:
If the market moves unfavorably, rolling the options to different strike prices or expiration dates can help manage risk and maintain the strategy’s viability.
Regular Check-ins:
Review the position regularly to ensure it aligns with the expected market movement. Adjust if the market conditions change or if the position starts to deviate from the initial plan.
Profit Targets:
Set predefined profit targets and consider taking profits when these targets are reached.
Exit Strategies:
Have a clear exit plan for different scenarios, at least for when the stop-loss or target is hit.
By implementing robust risk management practices, traders can enhance their ability to manage potential losses and improve the overall effectiveness of their trading strategies. Managing the Bear Put Diagonal Fly requires active monitoring and the flexibility to adjust the positions as market conditions evolve. This proactive approach helps in maximizing potential returns while mitigating risks.
Conclusion
The Bear Put Diagonal Fly is an advanced options strategy tailored for a bearish outlook on Euro Futures. By strategically selecting options with different expiration dates and strike prices, this strategy offers a cost-effective way to capitalize on anticipated declines in the Euro while managing risk.
Summary of the Bear Put Diagonal Fly Strategy:
Cost Reduction: The short put helps to offset the cost of the long puts, making the strategy more affordable.
Enhanced Bearish Exposure: The additional long put provides extra downside protection.
Flexibility: The staggered expiration dates allow for adjustments and trade management over time.
Why This Strategy Could Be Beneficial:
The current market conditions suggest potential downside for Euro Futures, making a bearish strategy like the Bear Put Diagonal Fly appropriate.
The defined risk nature of the strategy ensures that maximum potential losses are known upfront.
Effective trade and risk management techniques can further enhance the strategy’s performance and mitigate potential risks.
By understanding the mechanics of the Bear Put Diagonal Fly and applying it to Euro Futures, traders can leverage this advanced options strategy to navigate bearish market conditions with greater confidence and precision.
When charting futures, the data provided could be delayed. Traders working with the ticker symbols discussed in this idea may prefer to use CME Group real-time data plan on TradingView: www.tradingview.com This consideration is particularly important for shorter-term traders, whereas it may be less critical for those focused on longer-term trading strategies.
General Disclaimer:
The trade ideas presented herein are solely for illustrative purposes forming a part of a case study intended to demonstrate key principles in risk management within the context of the specific market scenarios discussed. These ideas are not to be interpreted as investment recommendations or financial advice. They do not endorse or promote any specific trading strategies, financial products, or services. The information provided is based on data believed to be reliable; however, its accuracy or completeness cannot be guaranteed. Trading in financial markets involves risks, including the potential loss of principal. Each individual should conduct their own research and consult with professional financial advisors before making any investment decisions. The author or publisher of this content bears no responsibility for any actions taken based on the information provided or for any resultant financial or other losses.

Exploring Bullish Plays with E-minis, Micro E-minis and OptionsIntroduction
The S&P 500 futures market offers a variety of ways for traders to capitalize on bullish market conditions. This article explores several strategies using E-mini and Micro E-mini futures contracts as well as options on futures. Whether you are looking to trade outright futures contracts, create sophisticated spreads, or leverage options strategies, this guide will help you design effective bullish plays while managing your risk.
Choosing the Right Contract Size
When considering a bullish play on the S&P 500 futures, the first decision is choosing the appropriate contract size. The E-mini and Micro E-mini futures contracts offer different levels of exposure and risk.
E-mini S&P 500 Futures:
Standardized contracts linked to the S&P 500 index with a point value = $50 per point.
Suitable for traders seeking significant exposure to market movements.
Greater potential for profits but also higher risk due to larger contract size.
TradingView ticker symbol is ES1!
Margin Requirements: As of the current date, the margin requirement for E-mini S&P 500 futures is approximately $12,400 per contract. Margin requirements are subject to change and may vary based on the broker and market conditions.
Micro E-mini S&P 500 Futures:
Contracts representing one-tenth the value of the standard E-mini S&P 500 futures.
Each point move in the Micro E-mini S&P 500 futures equals $5.
Ideal for traders who prefer lower exposure and risk.
Allows for more precise risk management and position sizing.
TradingView ticker symbol is MES1!
Margin Requirements: As of the current date, the margin requirement for Micro E-mini S&P 500 futures is approximately $1,240 per contract. Margin requirements are subject to change and may vary based on the broker and market conditions.
Choosing between E-mini and Micro E-mini futures depends on your risk tolerance, account size, and trading strategy. Smaller contracts like the Micro E-minis provide flexibility, especially for newer traders or those with smaller accounts.
Bullish Futures Strategies
Outright Futures Contracts:
Buying E-mini or Micro E-mini futures outright is a straightforward way to express a bullish view on the S&P 500. This strategy involves purchasing a futures contract in anticipation of a rise in the index.
Benefits:
Direct exposure to market movements.
Simple execution and understanding.
Ability to leverage positions due to the margin requirements.
Risks:
Potential for significant losses if the market moves against your position.
Requires substantial margin and capital.
Mark-to-market losses can trigger margin calls.
Example Trade:
Buy one E-mini S&P 500 futures contract at 5,588.00.
Target price: 5,645.00.
Stop-loss price: 5,570.00.
This trade aims to profit from a 57-point rise in the S&P 500, with a risk of a 18-point drop.
Futures Spreads:
1. Calendar Spreads: A calendar spread, also known as a time spread, involves buying (or selling) a longer-term futures contract and selling (or buying) a shorter-term futures contract with the same underlying asset. This strategy profits from the difference in price movements between the two contracts.
Benefits:
Reduced risk compared to outright futures positions.
Potential to profit from changes in the futures curve.
Risks:
Limited profit potential compared to outright positions.
Changes in contango could hurt the position.
Example Trade:
Buy a December E-mini S&P 500 futures contract.
Sell a September E-mini S&P 500 futures contract.
Target spread: Increase in the difference between the two contract prices.
In this example, the trader expects the December contract to gain more value relative to the September contract over time. The profit is made if the spread between the December and September contracts widens.
2. Butterfly Spreads: A butterfly spread involves a combination of long and short futures positions at different expiration dates. This strategy profits from minimal price movement around a central expiration date. It is constructed by buying (or selling) a futures contract, selling (or buying) two futures contracts at a nearer expiration date, and buying (or selling) another futures contract at an even nearer expiration date.
Benefits:
Reduced risk compared to outright futures positions.
Profits from stable prices around the middle expiration date.
Risks:
Limited profit potential compared to other spread strategies or outright positions.
Changes in contango could hurt the position.
Example Trade:
Buy one December E-mini S&P 500 futures contract.
Sell two September E-mini S&P 500 futures contracts.
Buy one June E-mini S&P 500 futures contract.
In this example, the trader expects the S&P 500 index to remain relatively stable.
Bullish Options Strategies
1. Long Calls: Buying call options on S&P 500 futures is a classic bullish strategy. It allows traders to benefit from upward price movements while limiting potential losses to the premium paid for the options.
Benefits:
Limited risk to the premium paid.
Potential for significant profit if the underlying futures contract price rises.
Leverage, allowing control of a large position with a relatively small investment.
Risks:
The potential loss of the entire premium if the market does not move as expected.
Time decay, where the value of the option decreases as the expiration date approaches.
Example Trade:
Buy one call option on E-mini S&P 500 futures with a strike price of 5,500, expiring in 73 days.
Target price: 5,645.00.
Stop-loss: Premium paid (e.g., 213.83 points x $50 per contract).
If the S&P 500 futures price rises above 5,500, the call option gains value, and the trader can sell it for a profit. If the price stays below 5,500, the trader loses only the premium paid.
2. Synthetic Long: Creating a synthetic long involves buying a call option and selling a put option at the same strike price and expiration. This strategy mimics owning the underlying futures contract.
Benefits:
Similar profit potential to owning the futures contract.
Flexibility in managing risk and adjusting positions.
Risks:
Potential for unlimited losses if the market moves significantly against the position.
Requires margin to sell the put option.
Example Trade:
Buy one call option on E-mini S&P 500 futures at 5,500, expiring in 73 days.
Sell one put option on E-mini S&P 500 futures at 5,500, expiring in 73 days.
Target price: 5,645.00.
The profit and loss (PnL) profile of the synthetic long position would be the same as owning the outright futures contract. If the price rises, the position gains value dollar-for-dollar with the underlying futures contract. If the price falls, the position loses value in the same manner.
3. Bullish Options Spreads: Options are incredibly versatile and adaptable, allowing traders to design a wide range of bullish spread strategies. These strategies can be tailored to specific market conditions, risk tolerances, and trading goals. Here are some popular bullish options spreads:
Vertical Call Spreads
Bull Call Spreads
Call Debit Spreads
Ratio Call Spreads
Diagonal Call Spreads
Calendar Call Spreads
Bullish Butterfly Spreads
Bullish Condor Spreads
Etc.
The following Risk Profile Graph represents a Bull Call Spread made of buying the 5,500 call and selling the 5,700 call with 73 to expiration:
For detailed explanations and examples of these and other bullish options spread strategies, please refer to the many published ideas under the "Options Blueprint Series." These resources provide in-depth analysis and step-by-step guidance.
Trading Plan
A well-defined trading plan is crucial for successful execution of any bullish strategy. Here’s a step-by-step guide to formulating your plan:
1.Select the Strategy: Choose between outright futures contracts, calendar or butterfly spreads, or options strategies based on your market outlook and risk tolerance.
2. Determine Entry and Exit Points:
Entry price: Define the price level at which you will enter the trade (breakout, UFO support, indicators convergence/divergence, etc.)
Target price: Set a realistic target based on technical analysis or market projections.
Stop-loss price: Establish a stop-loss level to manage risk and limit potential losses.
3. Position Sizing: Calculate the appropriate position size based on your account size and risk tolerance. Ensure that the position aligns with your overall portfolio strategy.
4. Risk Management: Implement risk management techniques such as using stop-loss orders, hedging, and diversifying positions to protect your capital. Risk management is vital in trading to protect your capital and ensure long-term success
Conclusion and Preview for Next Article
In this article, we've explored various bullish strategies using E-mini and Micro E-mini S&P 500 futures as well as options on futures. From outright futures contracts to sophisticated spreads and options strategies, traders have multiple tools to capitalize on bullish market conditions while managing their risk effectively.
Stay tuned for our next article, where we will delve into bearish plays using similar instruments to navigate downward market conditions.
When charting futures, the data provided could be delayed. Traders working with the ticker symbols discussed in this idea may prefer to use CME Group real-time data plan on TradingView: www.tradingview.com This consideration is particularly important for shorter-term traders, whereas it may be less critical for those focused on longer-term trading strategies.
General Disclaimer:
The trade ideas presented herein are solely for illustrative purposes forming a part of a case study intended to demonstrate key principles in risk management within the context of the specific market scenarios discussed. These ideas are not to be interpreted as investment recommendations or financial advice. They do not endorse or promote any specific trading strategies, financial products, or services. The information provided is based on data believed to be reliable; however, its accuracy or completeness cannot be guaranteed. Trading in financial markets involves risks, including the potential loss of principal. Each individual should conduct their own research and consult with professional financial advisors before making any investment decisions. The author or publisher of this content bears no responsibility for any actions taken based on the information provided or for any resultant financial or other losses.

Visualize $TSLA CALL pricing skew due to the upcoming earningsLet’s take a look at our new tradingview options screener indicator to see what we observe, as the options chain data has recently been updated.
When we look at the screener, we can immediately see that NASDAQ:TSLA has an exceptional Implied Volatility Rank value of over 100, which is extremely high. This is clearly due to the upcoming earnings report on July 23rd.
As we proceed, we notice that Tesla's Implied Volatility Index is also high, over 70. This means that not only the relative but also the absolute implied volatility of Tesla is high. Because the IVX value is above 30, Tesla’s IV Rank is displayed with a distinguishable black background. This favors credit strategies such as iron condors, broken wing butterflies, strangles, or simple short options.
Next, let’s examine how this IV index value has changed over the past five days. We can see it has increased by more than 6%, indicating an upward trend as we approach the earnings report.
In the next cell, we see a significant vertical price skew. Specifically, at 39 days to expiration, call options are 84% more expensive than put options at the same distance. This indicates that market participants are pricing in a significant upward movement in the options chain.
The call skew is so pronounced that at 39 days to expiration, the 16 delta call value exits the expected range. This signifies a substantial delta skew twist, which I will show you visually.
We see a horizontal IV index skew between the third and fourth weeks in the options chain. This means the front weekly IVX is lower than the IVX for the following week, which may favor calendar or diagonal strategies. Hovering over this with the mouse reveals it’s around the third and fourth week.
In the last cell, we observe that there’s a horizontal IVX skew not just in weekly expirations but also between the second and third monthly expirations.
Now, let’s see how these values appear visually on Tesla’s chart using our Options Overlay Indicator. On the right panel, the previously mentioned values are displayed in more detail when you hover over them with the mouse. The really exciting part is setting the 16 delta curve and seeing the extent of the upward shift in options pricing. This significant skew is also visible at closer delta values.
When we enable the expected move and standard deviation curves, it immediately becomes clear what this severe vertical pricing skew in favor of call options means. Practically, market participants are significantly pricing in upward movement right after the earnings report.
Hovering over the colored labels associated with the expirations displays all data precisely, showing the number of days until expiration and the high implied volatility index value for that expiration. Additionally, a green curve indicating overpricing due to extra interest is displayed. Weekly expiration horizontal IVX skew values appear in purple, and those affected by monthly skew are shown in turquoise blue.
The 'Lite' version of our indicators is available for free to everyone, where you can also view Tesla as demonstrated. Pro indicators are available more than 150 US market symbols like SPY, S&P500, Nvidia, bonds, etfs and many others.
Trade options like a pro with TanukiTrade Option Indicators for TradingView.
Thank you for your attention.

Options Blueprint Series: Swap Strategies for High VolatilityIntroduction
CME Group Gold Futures have always been a cornerstone in the commodities market, offering investors and traders a way to hedge against economic uncertainties and inflation. With the current market environment exhibiting heightened volatility, traders are looking for strategies to capitalize on these fluctuations. One such strategy is the Straddle Swap, which is particularly effective in high volatility scenarios.
By utilizing the Straddle Swap strategy on Gold Futures, traders can potentially benefit from price swings driven by news events, economic data releases, and other market-moving occurrences.
Strategy Explanation
The Straddle Swap strategy is designed to capitalize on high volatility by leveraging options with different expirations. Here’s a detailed breakdown of how this strategy works:
Components of the Straddle Swap:
1. Buy one call option (longer expiration)
This long call option benefits from upward price movements in Gold Futures.
2. Sell one call option (shorter expiration)
This short call option generates premium income, which offsets the cost of the long call option. As it has a shorter expiration, it benefits from faster time decay.
3. Buy one put option (longer expiration)
This long put option benefits from downward price movements in Gold Futures.
4. Sell one put option (shorter expiration)
This short put option generates premium income, which offsets the cost of the long put option. It also benefits from faster time decay due to its shorter expiration.
Rationale for Different Expirations:
Longer Expirations: The options with more days to expiration provide a longer timeframe to capture significant price movements, whether upward or downward.
Shorter Expirations: The options with less days to expiration decay more quickly, providing premium income that reduces the overall cost of the strategy. This helps mitigate the effects of time decay on the longer-dated options.
Market Analysis Using TradingView Charts:
To effectively implement the Straddle Swap strategy, it’s crucial to analyze the current market conditions of Gold Futures using TradingView charts. This analysis will help identify optimal entry and exit points based on volatility and price trends.
The current price action of Gold Futures along with key volatility indicators. Recent data shows that the 1-month, 2-month, and 3-month Historical Volatilities have all been on the rise, confirming a high volatility scenario.
Application to Gold Futures
Let’s apply the Straddle Swap strategy to Gold Futures given the current market conditions.
Identifying Optimal Entry Points:
Call Options: Buy one call option with a 100-day expiration (Sep-25 2024) at a strike price of 2370 @ 64.5. Sell one call option with a 71-day expiration (Aug-27 2024) at the same strike price of 2370 @ 53.4.
Put Options: Buy one put option with a 100-day expiration (Sep-25 2024) at a strike price of 2350 @ 63.4. Sell one put option with a 71-day expiration (Aug-27 2024) at the same strike price of $2350 @ 52.5.
Target Prices:
Based on the relevant UFO support and resistance levels, set target prices for potential profit scenarios:
Upper side, target price: 2455.
For put options, target price: 2260.
Potential Profit and Loss Scenarios:
Scenario 1: Significant Upward Movement
If Gold Futures rise sharply above 2370 within 100 days, the long call option will generate a potentially substantial profit. The short call option will expire in 71 days, limiting potential losses.
Scenario 2: Significant Downward Movement
If Gold Futures fall sharply below 2350 within 100 days, the long put option will generate a potentially substantial profit. The short put option will expire in 71 days, limiting potential losses.
Scenario 3: Minimal Movement
If Gold Futures remain relatively stable, the premiums collected from the short options (71-day expiration) will offset some of the cost of the long options (100-day expiration), minimizing overall losses. Further options could be sold against the long 2350 call and long 2350 put once the shorter expiration options have expired.
Specific Action Plan:
1. Initiate the Straddle Swap Strategy:
Enter the positions as outlined above following your trading plan, ensuring to buy and sell the options at the desired strike prices and expirations.
2. Monitor Market Conditions:
Continuously monitor Gold Futures prices and volatility indicators.
Adjust or close the strategy if necessary based on significant market changes.
3. Manage Positions:
Use stop-loss orders to limit potential losses.
If the market moves favorably, consider exiting the positions at the target prices to lock in profits.
4. Reevaluate Periodically:
Periodically reevaluate the positions as the options approach their expiration dates.
Make any necessary adjustments to the strategy based on updated market conditions and volatility.
By following this type of trade plan, traders can effectively implement the Straddle Swap strategy, taking advantage of high volatility in Gold Futures while managing risk through careful monitoring and the use of stop-loss orders.
Risk Management
Effective risk management is crucial for success in options trading, particularly when employing strategies like the Straddle Swap. Here, we will discuss the importance of risk management, key techniques, and best practices to ensure that traders can mitigate potential losses and protect their capital.
Importance of Risk Management:
Minimizing Losses: Trading inherently involves risk. Effective risk management helps minimize potential losses, ensuring that a single adverse move does not significantly impact the trader’s overall portfolio.
Preserving Capital: By managing risk, traders can preserve their capital, allowing them to stay in the market longer and capitalize on future opportunities.
Enhancing Profitability: Proper risk management allows traders to optimize their strategies, potentially increasing profitability by avoiding unnecessary losses.
Key Risk Management Techniques:
1. Stop-Loss Orders:
Implementing stop-loss orders helps limit potential losses by automatically closing a position if the market moves against it.
For the Straddle Swap strategy, set stop-loss orders for the long call and put options to exit positions if prices reach predetermined levels where losses would exceed the desired trade risk set by the trader.
2. Hedging:
Use hedging techniques to protect positions from adverse market movements. This can involve purchasing protective options or futures contracts.
Hedging provides an additional layer of security, ensuring that losses in one position are offset by gains in another.
3. Avoiding Undefined Risk Exposure:
Ensure that all positions have defined risk parameters. Avoid strategies that can result in unlimited losses.
The Straddle Swap strategy inherently has limited risk due to the offsetting nature of the long and short options.
4. Precision in Entries and Exits:
Timing is crucial in options trading. Ensure precise entry and exit points to maximize potential gains and minimize losses.
Use technical analysis key price levels such as UFO support and resistance prices, and volatility indicators to identify optimal entry and exit points.
5. Regular Monitoring and Adjustment:
Continuously monitor market conditions and the performance of open positions.
Be prepared to adjust the strategy based on changing market dynamics, such as shifts in volatility or unexpected news events.
Additional Risk Management Practices:
Diversification: Spread risk across multiple positions and asset classes to reduce the impact of any single trade. Other liquid options markets could be WTI Crude Oil Futures; Agricultural products such as Wheat Futures, Corn Futures, or Soybean Futures; Index Futures such as the E-mini S&P 500 Futures; and even Bond and Treasury Futures such as the 10-Year Note or the 30-Year Bond Futures.
Position Sizing: Carefully determine the size of each position based on the trader’s overall portfolio and risk tolerance.
Education and Research: Stay informed about market conditions, economic indicators, and trading strategies to make well-informed decisions.
By incorporating these risk management techniques, traders can effectively navigate the complexities of options trading and protect their investments. Ensuring more precision with entries and exits, using stop-loss orders, and implementing hedging strategies are essential practices that contribute to long-term trading success.
When charting futures, the data provided could be delayed. Traders working with the ticker symbols discussed in this idea may prefer to use CME Group real-time data plan on TradingView: www.tradingview.com This consideration is particularly important for shorter-term traders, whereas it may be less critical for those focused on longer-term trading strategies.
General Disclaimer:
The trade ideas presented herein are solely for illustrative purposes forming a part of a case study intended to demonstrate key principles in risk management within the context of the specific market scenarios discussed. These ideas are not to be interpreted as investment recommendations or financial advice. They do not endorse or promote any specific trading strategies, financial products, or services. The information provided is based on data believed to be reliable; however, its accuracy or completeness cannot be guaranteed. Trading in financial markets involves risks, including the potential loss of principal. Each individual should conduct their own research and consult with professional financial advisors before making any investment decisions. The author or publisher of this content bears no responsibility for any actions taken based on the information provided or for any resultant financial or other losses.

Options Blueprint Series: Cost Efficient Skip Strike ButterflyUnderstanding Skip Strike Butterfly
The Skip Strike Butterfly strategy is a unique and cost-effective options trading strategy that builds upon the traditional butterfly spread. This strategy involves buying and selling options at different strike prices to create a position with limited risk and potential for profit. Unlike the traditional butterfly spread, the Skip Strike Butterfly "skips" a strike price, which reduces the overall cost of the trade while maintaining a similar payoff profile.
Benefits:
Cost Efficiency: Lower upfront cost compared to traditional butterfly spreads.
Limited Risk: The maximum risk is limited to the net premium paid for the strategy.
Profit Potential: Potential for significant returns if the underlying asset moves within the expected range.
Understanding the mechanics of the Skip Strike Butterfly strategy can provide traders with a versatile tool for navigating market conditions when trading Corn Futures. This strategy allows traders to participate in market movements with a well-defined risk and reward profile, making it an attractive option for those looking to optimize their trading costs.
Strategy Setup
Setting up the Skip Strike Butterfly strategy for Corn Futures involves selecting the appropriate strike prices and expiration dates. Here, we detail the steps to configure this strategy effectively.
Steps to Set Up the Skip Strike Butterfly:
1. Select the Expiration Date:
Choose an expiration date that aligns with your market outlook and trading plan. Ensure you select an expiration that provides enough time for the expected price movement to occur.
2. Determine the Strike Prices:
Identify the current price of Corn Futures.
Typically, use calls for bullish setups and puts for bearish setups.
Buy one in-the-money (ITM) option.
Sell two at-the-money (OTM) options using a strike located near to where the trade target price is.
Skip one or multiple strikes and buy one further out-of-the-money (OTM) option.
3. Calculate the Cost:
Calculate the net premium paid for the strategy by considering the premiums of each option involved. The net cost is generally lower due to the skipped strike price.
4. Establish the Payoff Structure:
The maximum profit is realized if the price of Corn Futures closes at the middle strike at expiration.
The maximum loss is limited to the net premium paid for the strategy.
Application to Corn Futures
Analyzing the current market conditions for Corn Futures is crucial before implementing the Skip Strike Butterfly strategy. Let's examine the market and set up a trade based on recent data and trends.
Market Analysis:
Current Price: Corn Futures are trading at 456'6 per contract.
Market Trend: The market has shown moderate volatility with a tendency to hover around the 450 level.
Technicals: Recently, buy UnFilled Orders (UFOs) have formed around the 450 level, indicating strong buying interest and potential support at this price. On the other hand, sell UFOs are positioned much higher, around the 490 level, suggesting limited selling pressure in the immediate range and opening the door for a directional move with a potentially strong reward-to-risk ratio.
Setting Up the Trade:
Based on our analysis, we will implement the Skip Strike Butterfly strategy as follows:
Current Price of Corn Futures: 456'6
Expiration Date: 74 days from today.
Strike Prices and Premiums:
Buy 1 ITM Call: Strike Price 450, Premium 27.25
Sell 2 ATM Calls: Strike Price 480, Premium 16 each
Buy 1 OTM Call: Strike Price 540, Premium 6
Net Premium Paid: 27.25 (buy) - 32 (sell) + 6 (buy) = 1.25 points = $62.5 (Point Value is $50/point)
Source: Options chain available at www.tradingview.com
Trade Execution:
Entry Price: The trade is entered at 1.25 points, making it highly cost-efficient.
Target Price: The optimal scenario is for Corn Futures to close at 480 at expiration, where the maximum profit is realized.
Break-Even Points: Calculate the break-even points to ensure clarity on potential losses or gains. For this setup, the break-even points are 451.25 and 508.75.
Risk: In the worst-case scenario, this trade could incur a loss of 31.25 points if Corn Futures surpasses the upper break-even point. Conversely, a minor loss of 1.25 points would occur if Corn Futures falls below the lower break-even point.
Source: Risk profile graph available at www.tradingview.com
Risk Management
Risk management is a critical aspect of any trading strategy, and it is especially important when trading options like the Skip Strike Butterfly. Effective risk management helps protect against unexpected market movements and ensures that losses are minimized while maximizing potential gains.
Importance of Risk Management:
Limit Losses: By setting clear stop-loss levels, traders can limit the amount of capital at risk and prevent large losses.
Preserve Capital: Protecting trading capital is essential for long-term success. Effective risk management allows traders to stay in the game even after a series of losing trades.
Emotional Control: Having a risk management plan helps traders stick to their strategy and avoid emotional decisions driven by market volatility.
Maximize Gains: Proper risk management enables traders to capitalize on profitable opportunities while keeping losses in check.
Techniques for Managing Risk with Skip Strike Butterfly:
1. Stop-Loss Orders:
Set stop-loss orders at predetermined price levels to automatically exit the trade if the market moves against you.
2. Position Sizing:
Only allocate a small percentage of your trading capital to any single trade. This helps to mitigate the impact of any one trade on your overall portfolio.
3. Diversification:
Diversify your trading strategies and instruments to spread risk across different markets and reduce the impact of adverse movements in any one asset.
4. Hedging:
Use other options strategies to hedge your positions. For example, buying protective puts can limit downside risk if the market moves significantly against your position.
5. Regular Monitoring:
Continuously monitor the market and your positions. Be prepared to adjust your strategy or exit the trade if market conditions change.
Conclusion
The Skip Strike Butterfly strategy offers a cost-efficient and flexible approach for trading Corn Futures. By strategically setting up options at different strike prices while skipping an intermediate strike, traders can reduce the cost of the trade while maintaining a similar payoff structure to a traditional butterfly spread. This strategy is particularly useful in markets exhibiting limited price movements, making it ideal for the current conditions in Corn Futures.
Key Takeaways:
Cost Efficiency: The Skip Strike Butterfly reduces the upfront cost of entering a trade, providing a significant advantage over traditional butterfly spreads.
Limited Risk: With a well-defined risk profile, this strategy ensures that losses are capped at the net premium paid.
Profit Potential: Although the maximum profit is achieved if the underlying asset closes at the middle strike price, the strategy still offers substantial profit opportunities within a specific price range.
Risk Management: Implementing robust risk management techniques is essential for success. Utilizing stop-loss orders, managing position sizes, diversifying strategies, and regular market monitoring can help protect trading capital and maximize gains.
When trading options and employing strategies like the Skip Strike Butterfly, it is crucial to stay disciplined and adhere to your trading plan. Always ensure that your risk management measures are in place to navigate market uncertainties effectively.
When charting futures, the data provided could be delayed. Traders working with the ticker symbols discussed in this idea may prefer to use CME Group real-time data plan on TradingView: www.tradingview.com This consideration is particularly important for shorter-term traders, whereas it may be less critical for those focused on longer-term trading strategies.
General Disclaimer:
The trade ideas presented herein are solely for illustrative purposes forming a part of a case study intended to demonstrate key principles in risk management within the context of the specific market scenarios discussed. These ideas are not to be interpreted as investment recommendations or financial advice. They do not endorse or promote any specific trading strategies, financial products, or services. The information provided is based on data believed to be reliable; however, its accuracy or completeness cannot be guaranteed. Trading in financial markets involves risks, including the potential loss of principal. Each individual should conduct their own research and consult with professional financial advisors before making any investment decisions. The author or publisher of this content bears no responsibility for any actions taken based on the information provided or for any resultant financial or other losses.

Options Blueprint Series: Secure Interest Rates with Box SpreadsIntroduction
The E-mini S&P 500 Futures is a popular and widely traded derivative product. These futures are used by traders and investors to hedge their portfolios, gain market exposure, and manage risk.
The Options Box Strategy is an advanced options trading technique that involves creating a synthetic long position and a synthetic short position simultaneously. This strategy is designed to lock in interest rates and profit from price discrepancies, essentially securing a risk-free return through arbitrage. By using Box Spreads, traders can secure interest rates and achieve a potential arbitrage opportunity in a controlled and predictable manner.
An interesting application of the Box Spread strategy is using unutilized capital in a trading account. Traders can earn a risk-free return on idle cash by deploying it in Box Spreads. This approach maximizes the utility of available capital, providing an additional revenue stream without increasing market risk exposure, thus enhancing overall portfolio performance.
E-mini S&P 500 Futures Contract Specifications:
Contract Size: $50 times the S&P 500 Index
Minimum Tick Size: 0.25 index points, equal to $12.50 per contract
Trading Hours: Nearly 24 hours a day, five days a week
Margin Requirement: $11,800 at the time of publishing this article
Micro E-minis: 10 times smaller than the E-minis
Understanding Box Spreads
A Box Spread is a sophisticated options strategy that involves simultaneously entering a long call and short put at one strike price and a long put and short call at another strike price.
Components of a Box Spread:
Long Call: Buying a call option at a specific strike price.
Short Put: Selling a put option at the same strike price as the long call.
Long Put: Buying a put option at a different strike price.
Short Call: Selling a call option at the same strike price as the long put.
How Box Spreads Secure Interest Rates: Box Spreads are designed to exploit mispricings between the synthetic long and short positions. By locking in these positions, traders can secure interest rates as the net result of the Box Spread should theoretically yield a risk-free return. This strategy is particularly useful in stable market conditions where interest rate fluctuations can impact the profitability of other trading strategies.
Advantages of Using Box Spreads:
Arbitrage Opportunities: Box Spreads allow traders to capitalize on discrepancies in the pricing of options, securing a risk-free profit.
Predictable Returns: The strategy locks in a fixed rate of return, providing certainty and stability.
Risk Management: By simultaneously holding synthetic long and short positions, the risk is minimized, making it an effective strategy for conservative traders.
Applying Box Spreads on E-mini S&P 500 Futures
To apply the Box Spread strategy on E-mini S&P 500 Futures, follow the following step-by-step approach.
Step-by-Step:
1. Identify Strike Prices:
Choose two strike prices for the options. For instance, select a lower strike price (LK) and a higher strike price (HK).
2. Enter Long Call and Short Put:
Buy a call option at the lower strike price (K1).
Sell a put option at the same lower strike price (K1).
3. Enter Long Put and Short Call:
Buy a put option at the higher strike price (K2).
Sell a call option at the same higher strike price (K2).
Potential Outcomes and Rate Security: The Box Spread locks in a risk-free return by exploiting price discrepancies. The profit is determined by the difference between the strike prices minus the net premium paid. In stable market conditions, this strategy provides a predictable and secure return, effectively locking in interest rates.
Advantages of Applying Box Spreads:
Risk-Free Arbitrage: The primary benefit is securing a risk-free profit through arbitrage.
Predictable Returns: Provides a fixed return, beneficial for conservative traders.
Minimal Risk: By holding both synthetic long and short positions, market risk is mitigated.
Considerations:
Ensure precise execution to avoid slippage and maximize the arbitrage opportunity.
Account for transaction costs, as they can impact the overall profitability.
Monitor market conditions to ensure the strategy remains effective.
Example Trade Setup:
Let's consider a practical example of setting up a Box Spread on the E-mini S&P 500 Futures while its current trading price is 5,531. We'll use the following strike prices:
Lower Strike Price (K1): 5450
Higher Strike Price (K2): 5650
Transactions:
Sell Call at 5650: Premium = 240.01
Buy Put at 5650: Premium = 352.85
Sell Put at 5450: Premium = 270.59
Buy Call at 5450: Premium = 347.39
Note: We are using the CME Group Options Calculator in order to generate fair value prices and Greeks for any options on futures contracts.
Net Premium Calculation:
Net premium paid = 347.39 - 240.01 + 352.85 - 270.59 = 189.64
Potential Profit Calculation:
Profit = (Higher Strike Price - Lower Strike Price) - Net Premium Paid
Profit = 5650 – 5450 – 189.64 = 10.36 points = $518 ($50 per point)
Rate Of Return (ROR) Calculation:
Margin Requirement = (Higher Strike Price - Lower Strike Price) × Contract Multiplier = 200 x 50 = $10,000
ROR = 518 / 10000 = 5.18%
Annualized ROR = 518 / 10000 x 365.25 / 383 = 4.94% (based on the screenshots, expiration will take place in 383.03 days while a year is made of 365.25 days)
Interesting Application: Utilizing Box Spreads with Unutilized Capital
An intriguing application of the Box Spread strategy is the use of unutilized capital in a trading account. Traders often have idle cash in their accounts that isn't actively engaged in trading. By deploying this capital in Box Spreads, traders can earn a risk-free return on otherwise dormant funds. This approach not only maximizes the utility of available capital but also provides an additional revenue stream without increasing market risk exposure. Utilizing Box Spreads in this manner can enhance overall portfolio performance, making efficient use of all available resources.
Importance of Risk Management
Risk management is a critical aspect of any trading strategy, including the implementation of Box Spreads on E-mini S&P 500 Futures. Effective risk management ensures that traders can mitigate potential losses and protect their capital, leading to more consistent and sustainable trading performance.
Conclusion
Implementing the Options Box Strategy on E-mini S&P 500 Futures may allow traders to secure interest rates and potentially achieve risk-free arbitrage opportunities. By understanding the mechanics of Box Spreads and applying them effectively, traders can capitalize on price discrepancies in the options market to lock in predictable returns.
Key points to remember include:
E-mini S&P 500 Futures offer accessible and efficient trading opportunities for both hedging and speculative purposes.
Box Spreads combine synthetic long and short positions, providing a powerful tool for securing interest rates through arbitrage.
By following the outlined steps and leveraging classical technical indicators, traders can enhance their ability to set up and analyze Box Spreads, making the most of this advanced options strategy.
Utilizing Box Spreads on E-mini S&P 500 Futures not only can secure interest rates but can also provide a structured and disciplined approach to trading, leading to more consistent and sustainable trading performance.
When charting futures, the data provided could be delayed. Traders working with the ticker symbols discussed in this idea may prefer to use CME Group real-time data plan on TradingView: www.tradingview.com This consideration is particularly important for shorter-term traders, whereas it may be less critical for those focused on longer-term trading strategies.
General Disclaimer:
The trade ideas presented herein are solely for illustrative purposes forming a part of a case study intended to demonstrate key principles in risk management within the context of the specific market scenarios discussed. These ideas are not to be interpreted as investment recommendations or financial advice. They do not endorse or promote any specific trading strategies, financial products, or services. The information provided is based on data believed to be reliable; however, its accuracy or completeness cannot be guaranteed. Trading in financial markets involves risks, including the potential loss of principal. Each individual should conduct their own research and consult with professional financial advisors before making any investment decisions. The author or publisher of this content bears no responsibility for any actions taken based on the information provided or for any resultant financial or other losses.

New Product Launch: How to Use TradingView OptionsWe’ve rolled out our newest product and we’re eager to brag about it! It’s an options platform — TradingView Options. More precisely, it’s a powerful set of tools for options traders who want to keep a close eye on every little detail and fine-tune their strategy to perfection.
What Are Options?
Options are financial derivatives that give the buyer the right, but not the obligation, to buy or sell the underlying asset at a set price within a set period.
TradingView Options
TradingView Options is designed to illuminate your options trading strategy from the first step to the last one. Get razor-sharp options strategies on gold futures ( COMEX-GC1! ), oil futures ( NYMEX-CL1! ), and many more.
Let’s break it down and discuss what it's about. For starters, you’ve got three key components — Strategy Builder, Options Chain, and Volatility Analysis.
1. Strategy Builder
Create, test and visualize options strategies with real-time data.
Use pre-built strategies filtered by bullish, bearish, or neutral outlooks.
Customize strategies with adjustable parameters like expiration dates and strike prices.
Get estimates for max profit, max loss, win rate, and more.
Compare multiple strategies on a single chart for performance analysis.
2. Options Chain
Options chains are broken down into two sections — calls and puts.
Strike price is displayed in the center column — it’s where the put or call can be exercised.
Next to Strike is IV, %, which stands for Implied Volatility in percentages.
Measure options risk with the Greeks: Delta, Gamma, Theta, Vega, and Rho.
Easily switch underlying assets with a simple symbol search at the top left.
3. Volatility
Analyze market volatility to understand potential price movements and risks.
Market Coverage
Currently, TradingView Options supports options contracts from major exchanges including CME and its subsidiaries NYMEX, COMEX, and CBOT, alongside NSE , and BSE .
Conclusion
The new options trading tools by TradingView empower traders with the data and analytical capabilities needed to whip up high-probability strategies and explore new opportunities for profit in global markets.
Are you an options trader? What’s your trading style? Let us know in the comments!

Structure Lesson This is a mini analysis of AMEX:XLK structure. I point out structure, momentum, liquidations, and what to look for when entering longs/reversals. Follow along with the notes on the chart and back test!

Options Blueprint Series: Pre and Post OPEC+ WTI Options PlaysIntroduction
The world of crude oil trading is significantly influenced by the decisions made by the Organization of the Petroleum Exporting Countries (OPEC) and its allies, collectively known as OPEC+. These meetings, which often dictate production levels, can lead to substantial market volatility. Traders and investors closely monitor these events, not only for their immediate impact on oil prices but also for the broader economic implications.
In this article, we explore two sophisticated options strategies designed to capitalize on the volatility surrounding OPEC+ meetings, specifically focusing on WTI Crude Oil Futures Options. We will delve into the double calendar spread, a strategy to exploit the expected rise in implied volatility (IV) before the meeting, and the transition to a long iron condor, which aims to profit from potential post-meeting volatility adjustments.
Understanding the Market Dynamics
OPEC+ meetings are pivotal events in the global oil market, with decisions that can significantly influence crude oil prices. These meetings typically revolve around discussions on production quotas, which directly affect the supply side of the oil market. The anticipation and outcomes of these meetings create a fertile ground for volatility, especially in the days leading up to and immediately following the announcements.
Implied Volatility (IV) Dynamics
Pre-Meeting Volatility: In the days leading up to an OPEC+ meeting, implied volatility (IV) often rises. This increase is driven by market uncertainty and the potential for significant price moves based on the meeting's outcome. Traders buy options to hedge against or speculate on the potential price movements, thereby increasing the demand for options and pushing up IV.
Post-Meeting Volatility: After the meeting, IV can either spike or drop sharply, depending on whether the outcome aligns with market expectations. An unexpected decision can cause a significant IV spike due to the new uncertainty introduced, while a decision in line with expectations can lead to a sharp drop as the uncertainty dissipates.
Strategy 1: Double Calendar Spread
The double calendar spread is a sophisticated options strategy that can potentially take advantage of rising implied volatility (IV) leading up to significant market events, such as the OPEC+ meeting. This strategy involves establishing positions in options with different expiration dates but the same strike price, allowing traders to profit from the increase in IV while managing risk effectively.
Structure
Long Legs: Buy longer-term call and put options.
Short Legs: Sell shorter-term call and put options.
The strategy typically involves setting up two calendar spreads at different strike prices (one higher and one lower), thus the term "double calendar."
Rationale
The rationale behind this strategy is that the longer-term options will experience a greater increase in IV as the event approaches, inflating their premiums more than the shorter-term options. As the short-term options expire, traders can realize a profit from the difference in premiums, assuming IV rises as expected.
Strategy 2: Transition to Long Iron Condor
As the OPEC+ meeting date approaches and the double calendar spread positions reach their peak profitability due to the elevated implied volatility (IV), it becomes strategic to transition into a long iron condor. This shift aims to capitalize on potential volatility changes and capture profits from the expected IV drop.
Structure
Closing the Double Calendar: Close the short-term call and put options from the double calendar spread.
Setting Up the Long Iron Condor: Sell new OTM call and put options with the same expiration date as the long legs of the double calendar spread.
The result is a position where the trader holds long options closer to the money and short options further out, creating a long condor structure.
Rationale
The rationale for transitioning to a long iron condor is to capture profits from a potential decrease in IV after the OPEC+ meeting.
Practical Example
To illustrate the application of the double calendar spread and the transition to a long iron condor, let's walk through a detailed example using hypothetical WTI Crude Oil Futures prices.
Double Calendar Spread Setup
1. Initial Conditions:
Current price of WTI Crude Oil Futures: $77.72 per barrel.
Date: One week before the OPEC+ meeting.
2. Long Legs:
Buy a call option with a strike price of $81, expiring on Jun-7 2024 @ 0.32.
Buy a put option with a strike price of $74, expiring on Jun-7 2024 @ 0.38.
3. Short Legs:
Sell a call option with a strike price of $81, expiring on May-31 2024 @ 0.05.
Sell a put option with a strike price of $74, expiring on May-31 2024 @ 0.09.
Note: We are using the CME Group Options Calculator in order to generate fair value prices and Greeks for any options on futures contracts.
Transition to Long Iron Condor
1. Closing the Double Calendar:
Close the short-term call and put options just before they expire @ 0.01 (assuming they are OTM on Friday May-31, before the market closes for the weekend).
2. Setting Up the Iron Condor:
Sell a call option with a strike price of $82, expiring on Jun-7 2024 @ 0.13.
Sell a put option with a strike price of $73, expiring on Jun-7 2024 @ 0.18.
0.11 and 0.17 are estimated values assuming WTI Crude Oil Futures remains fairly centered around 77.50 and that IV has risen into the OPEC+ meeting weekend.
Transitioning from the Double Calendar to the Long Iron Condor would be done on Friday May-31.
3. Resulting Position:
You now hold a long call at $81, a long put at $74, a short call at $82, and a short put at $73, forming a long iron condor.
The risk of the trade has been reduced by half (assuming the real fills coincide with the estimated values above) from 0.56 to 0.27 = $270 with a potential for reward of up to 0.73 (1 – 0.27) = $730.
This practical example demonstrates how to effectively implement and transition between the double calendar spread and the long iron condor to navigate the volatility surrounding an OPEC+ meeting.
Importance of Risk Management
Effective risk management is crucial when implementing options strategies, particularly around significant market events like the OPEC+ meeting. The volatility and potential for sharp market moves require traders to have robust risk management practices to protect their capital and ensure long-term success.
Avoiding Undefined Risk Exposure
Undefined risk exposure occurs when traders have no clear limit on their potential losses. This can happen with certain options strategies that involve selling naked options. To avoid this, traders should always define their risk by using strategies that have built-in risk limits, such as spreads and condors.
Precise Entries and Exits
Making precise entries and exits is critical in options trading. This involves:
Entering trades at optimal times to maximize potential profits.
Exiting trades at predetermined levels to lock in gains or limit losses.
Adjusting trades based on market conditions and new information.
Additional Risk Management Practices
Diversification: Spread risk across different assets and strategies.
Position Sizing: Allocate only a small percentage of capital to each trade to avoid significant losses from a single position.
Continuous Monitoring: Regularly review and adjust positions as market conditions evolve.
By adhering to these risk management principles, traders can navigate the complexities of the options market and mitigate the risks associated with volatile events like OPEC+ meetings.
Conclusion
Navigating the volatility surrounding significant market events like the OPEC+ meeting requires strategic planning and effective risk management. By implementing the double calendar spread before the meeting, traders can capitalize on the anticipated rise in implied volatility (IV). Transitioning to a long iron condor after the meeting allows traders to benefit from potential post-meeting volatility adjustments or price stabilization.
These strategies, when executed correctly, offer a structured approach to managing market uncertainties and capturing profits from both pre- and post-event volatility. The key lies in precise timing, appropriate strike selection, and diligent risk management practices to protect against adverse market movements.
By understanding and applying these sophisticated options strategies, traders can enhance their ability to navigate the complexities of the crude oil market and leverage the opportunities presented by OPEC+ meetings.
When charting futures, the data provided could be delayed. Traders working with the ticker symbols discussed in this idea may prefer to use CME Group real-time data plan on TradingView: www.tradingview.com This consideration is particularly important for shorter-term traders, whereas it may be less critical for those focused on longer-term trading strategies.
General Disclaimer:
The trade ideas presented herein are solely for illustrative purposes forming a part of a case study intended to demonstrate key principles in risk management within the context of the specific market scenarios discussed. These ideas are not to be interpreted as investment recommendations or financial advice. They do not endorse or promote any specific trading strategies, financial products, or services. The information provided is based on data believed to be reliable; however, its accuracy or completeness cannot be guaranteed. Trading in financial markets involves risks, including the potential loss of principal. Each individual should conduct their own research and consult with professional financial advisors before making any investment decisions. The author or publisher of this content bears no responsibility for any actions taken based on the information provided or for any resultant financial or other losses.

Options Blueprint Series: Ratio Spreads for the Advanced TraderIntroduction to Ratio Spreads on E-mini Dow Jones Futures
In the dynamic world of options trading, Ratio Spreads stand out as a sophisticated strategy designed for traders looking to leverage market nuances to their advantage. Regular options on the E-mini Dow Jones Futures are a popular choice (YM).
Defining the E-mini Dow Jones (YM) Futures Contract
Before delving into the specifics of Ratio Spreads, understanding the underlying contract on which these options are based is crucial. The E-mini Dow Jones Futures, symbol YM, offers traders exposure to the 30 blue-chip companies of the Dow Jones Industrial Average in a smaller, more accessible format. Each YM contract represents $5 per index point.
Key Contract Specifications:
Point Value: $5 per point of the Dow Jones Industrial Average.
Trading Hours: Sunday - Friday, 6:00 PM - 5:00 PM (Next day) ET with a trading halt from 5:00 PM - 6:00 PM ET daily.
Margins: Varied based on broker but generally lower than the full-sized contracts, providing a cost-effective entry for various trading strategies. CME Group suggests $8,400 per contract at the time of this publication.
Ratio Spread Margins: Often require a careful calculation as they involve multiple positions. Traders must consult with their brokers to understand the specific margin requirements for entering into ratio spreads using YM futures. Margins for Ratio Spreads are often equal to the margin requirement when trading the outright futures contract.
Understanding Ratio Spreads
Ratio Spreads involve buying and selling different amounts of options at varying strike prices, but within the same expiration period. This strategy is typically employed to exploit expected directional moves or stability in the underlying asset, with an additional emphasis on benefiting from time decay.
Types of Ratio Spreads:
Call Ratio Spread: Involves buying calls at a lower strike price and selling a greater number of calls at a higher strike price. This setup is generally used in mildly bullish scenarios.
Put Ratio Spread: Consists of buying puts at a higher strike price and selling more puts at a lower strike price, suitable for mildly bearish market conditions.
Mechanics:
Execution: Traders initiate these spreads by first determining their view on the market direction. For a bullish outlook, a call ratio spread is suitable; for a bearish view, a put ratio spread would be applicable.
Objective: The primary goal is to benefit from the premium decay of the short positions outweighing the cost of the long positions. This is enhanced if the market moves slowly towards the strike price of the short options or remains at a standstill.
Risk Management: It's crucial to manage risks as these spreads can lead to limited losses if the market moves against the trader, or surprisingly to many, to unlimited losses if the market moves sharply in the desired direction. Proper stop-loss settings, adjustments and continual market analysis are imperative.
Focused Strategy: Bullish Call Ratio Spread
In the context of the E-mini Dow Jones, considering the current upward trend with potential slow advancement due to overhead UFO (UnFilled Orders) Resistances, a Bullish Call Ratio Spread can be particularly effective. This strategy allows traders to capitalize on the gradual upward movement while keeping a lid on risks associated with faster, unexpected spikes.
Strategy Setup:
Selecting Strikes: Choose a lower strike where the long calls are bought and a higher strike where more calls are sold. The selection depends on the resistance levels indicated by the UFOs.
Position Sizing: Typically, the number of calls sold is higher than those bought, maintaining a ratio that aligns with the trader's risk tolerance and market outlook.
Market Conditions: Best implemented when expecting a gradual increase in the market, allowing time decay to erode the value of the short call positions advantageously.
Real-time Market Example: Bullish Call Ratio Spread on E-mini Dow Jones Futures
Given the current market scenario where the Dow Jones Index is experiencing a bullish breakout, it’s crucial to align our options trading strategy to take advantage of potential slow upward movements signaled by overhead UFO Resistances. This setup suggests a favorable environment for a Bullish Call Ratio Spread, aiming to maximize the benefits of time decay while managing risk exposure effectively.
Setting Up the Bullish Call Ratio Spread:
1. Selection of Strike Prices:
Long Calls: Choose a strike price near the current market level (Strike = 39000).
Short Calls: Set the higher strike prices right at or above the identified UFO Resistances (Strike = 41000). The rationale here is that these levels are expected to cap the upward movement, thus enhancing the likelihood that these short calls expire worthless or decrease in value, maximizing the time decay benefit.
2. Ratio of Calls:
Opt for a ratio that reflects confidence in the bullish movement but also cushions against an unexpected rally. A common setup might be 1 long call for every 2 short calls.
Execution:
Trade Entry: Enter the trade when you observe a confirmed break above a minor resistance or a pullback that respects the upward trend structure.
Monitoring: Regularly monitor the price action as it approaches the UFO Resistances. Adjust the position if the market shows signs of either stalling or breaking through these levels more robustly than anticipated.
Trade Management:
Adjustments: If the market advances towards the higher strike more quickly than expected, consider buying back some short calls to reduce exposure.
Risk Control: Implement stop-loss orders to mitigate potential losses should the market move sharply against the position. This could be set at a level where the market structure changes from bullish to bearish.
This real-time scenario provides a practical example of how advanced traders can utilize Bullish Call Ratio Spreads to navigate complex market dynamics effectively, leveraging both market sentiment and technical resistance points to structure a potentially profitable trade setup.
Advantages of Ratio Spreads in Options Trading
Ratio Spreads offer a strategic advantage in options trading by balancing the potential for profit with a controlled risk management approach. Here are some key benefits of incorporating Ratio Spreads into your trading arsenal:
1. Maximizing Time Decay
Optimized Premium Decay: By selling more options than are bought, traders can capitalize on the accelerated decay of the premium of short positions. This is particularly advantageous in markets exhibiting slow to moderate price movements, as expected with the current Dow Jones trend influenced by UFO resistances.
2. Cost Efficiency
Reduced Net Cost: The cost of purchasing options is offset by the income received from selling options, reducing the net cost of entering the trade. This can provide a more affordable way to leverage significant market positions without a substantial upfront investment. The Net Debit paid is 403.4 (690 – 143.3 – 143.3) = $2,017 since each YM point is worth $5.
Note: We are using the CME Group Options Calculator in order to generate fair value prices and Greeks for any options on futures contracts.
3. Profit in Multiple Market Conditions
Versatile Profit Scenarios: Depending on the setup, Ratio Spreads can be profitable in a stagnant, slightly bullish, or slightly bearish market. The key is the strategic selection of strike prices relative to expected market behavior, enabling profits through slight directional moves while protected against losses from significant adverse moves.
4. Flexible Adjustments
Scalability and Reversibility: Given their structure, Ratio Spreads allow for easy scaling or reversing positions depending on market movements and trader outlook. This flexibility can be a critical factor in dynamic markets where adjustments need to be swift and cost-effective.
Risk Management in Ratio Spreads
While Ratio Spreads offer several benefits, they are not without risks, particularly from significant market moves that can lead to potentially unlimited losses. Here’s how to manage those risks:
Stop-Loss Orders: Setting stop-losses at predetermined levels can help traders exit positions that move against them, preventing larger losses.
Position Monitoring: Regular monitoring and analysis are crucial, especially as the market approaches or reaches the strike price of the short options.
Adjustments: Being proactive about adjusting the spread, either by buying back short options or by rolling the positions to different strikes or expiries, can help manage risk and lock in profits.
Conclusion
Ratio Spreads, particularly in the format of Bullish Call Ratio Spreads demonstrated with E-mini Dow Jones Futures, offer a sophisticated strategy that balances potential profit with manageable risks. This approach is suited for traders who have a nuanced understanding of market dynamics and can navigate the complexities of options with strategic finesse.
When charting futures, the data provided could be delayed. Traders working with the ticker symbols discussed in this idea may prefer to use CME Group real-time data plan on TradingView: www.tradingview.com This consideration is particularly important for shorter-term traders, whereas it may be less critical for those focused on longer-term trading strategies.
General Disclaimer:
The trade ideas presented herein are solely for illustrative purposes forming a part of a case study intended to demonstrate key principles in risk management within the context of the specific market scenarios discussed. These ideas are not to be interpreted as investment recommendations or financial advice. They do not endorse or promote any specific trading strategies, financial products, or services. The information provided is based on data believed to be reliable; however, its accuracy or completeness cannot be guaranteed. Trading in financial markets involves risks, including the potential loss of principal. Each individual should conduct their own research and consult with professional financial advisors before making any investment decisions. The author or publisher of this content bears no responsibility for any actions taken based on the information provided or for any resultant financial or other losses.
