Volume Do Not Predict Price! - It Explains It!Most traders look at volume the wrong way.✖️
They expect volume to tell them where price will go next.
But volume’s real job is much more important:
Volume explains why price moved the way it did.
If you learn to read volume correctly, price action becomes clearer, not noisier.
1️⃣ Price Up + Rising Volume = Commitment
When price moves higher and volume expands, it means buyers are committed, not just reacting.
This is not random buying.
This is participation.
📈Rising volume during an impulse confirms that the move is supported by real interest, not just thin liquidity.
Strong trends are built on expanding volume.
2️⃣ Price Up + Falling Volume = Warning
When price continues higher but volume dries up, something changes.
The move still exists... but conviction doesn’t.
This often signals:
- exhaustion
- a potential pause
- or an upcoming correction
That’s when professionals stop chasing and start managing risk.
3️⃣ Sideways Price + Rising Volume = Accumulation or Distribution
This is where most traders get confused:
Price isn’t moving much, but volume is increasing.
That’s not boredom.
That’s positioning.
Large players don’t chase price.
They build positions quietly while price looks “dead.”
Breakouts that follow these zones tend to be fast and decisive, because the work was already done.❗️
4️⃣ Breakouts Without Volume Are Suspect
A breakout candle looks exciting.
But without volume, it’s just a move, not a decision.
Low-volume breakouts often lead to:
- fakeouts
- traps
- fast reversals
🏹Volume doesn’t need to explode... but it needs to confirm participation.
💡The Big Picture
Volume is not a signal by itself. It’s context.
Price tells you what happened, while Volume tells you how serious that move really was.
✔️When price and volume agree, trades feel easy.
✖️When they disagree, something important is hiding underneath.
⚠️ Disclaimer: This is not financial advice. Always do your own research and manage risk properly.
📚 Stick to your trading plan regarding entries, risk, and management.
Good luck! 🍀
All Strategies Are Good; If Managed Properly!
~Richard Nasr
Community ideas

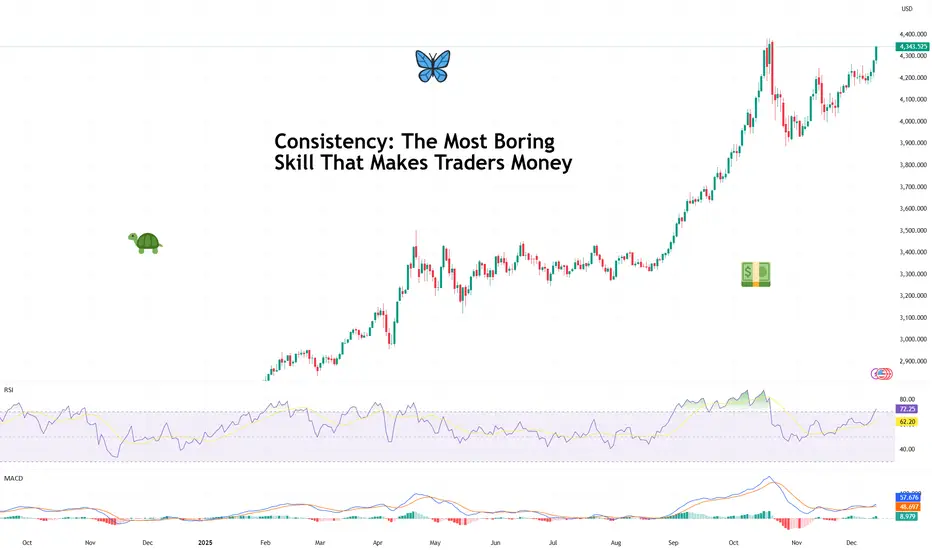
Consistency: The Most Boring Skill That Makes Traders MoneyAsk traders how they made their money and you’ll hear stories about perfect entries, heroic conviction, and that one legendary going-for-the-jugular trade they’ll mention at every dinner party.
What you almost never hear about is consistency — because it’s not glamorous, it doesn’t screenshot well, and it definitely doesn’t come with fireworks.
But consistency is the skill that turns trading from an emotional roller coaster into a durable business. It’s boring. It’s repetitive. And it’s responsible for more profitable careers than any secret indicator ever will.
🧠 Why the Market Rewards the Unexciting
Markets don’t pay you for being clever. They pay you for being repeatable.
Consistency works because markets are probabilistic systems. No single trade matters in the long run. What matters is what happens over time, across dozens or hundreds of decisions. (Good time to look back and see how you did this year.)
The trader who makes reasonable decisions again and again — even without brilliance — will eventually outperform the trader who occasionally nails a perfect call but can’t stop freelancing.
Think of it less like poker and more like compound interest. It doesn’t wow you at first. Then one day, you realize you’ve done pretty darn well.
📊 The Myth of the Big Trade
Every trader remembers their biggest win. And there’s nothing wrong with that. Some big trades can pay for a lot of small mistakes .
Big wins feel validating. They trigger confidence. But they also create dangerous expectations. Traders start chasing that feeling — trading bigger, faster, looser — and consistency quietly exits through the back door.
Professional traders know that a great trade doesn’t prove skill. A series of disciplined trades does.
The market doesn’t care how exciting your best trade was. It cares how well you behaved on the other ninety-nine.
🧮 Consistency Is Math, Not Motivation
Consistent traders don’t wake up feeling like it’s their lucky day.
They operate within a framework that reduces randomness in their decisions. They trade fewer setups, not more. They accept that being flat for the week is a position. They understand that not every day is designed to reward them.
This isn’t about grinding harder. It’s about removing unnecessary choices so execution becomes automatic.
Ironically, the less you try to be exceptional, the more real and reliable your results become.
📉 Losing Is Part of the Job
Consistency shows up most clearly during losing streaks. Anyone can look disciplined after a winning week. The test comes when trades stop working, narratives shift, and the urge to “make it back” creeps in.
Consistent traders don’t panic. They don’t revenge trade . They don’t rewrite their strategy after three red days.
Instead, they understand that drawdowns are not failures — they’re rent paid for staying in the game. The goal isn’t to avoid losses. It’s to keep losses from changing behavior.
🧠 Confidence Comes from Repetition
One of the quiet benefits of consistency is confidence — the real kind. Not the loud, chest-thumping confidence that comes from a hot streak. But the calm assurance that comes from knowing you’ve executed your plan a hundred times before.
That confidence allows traders to stay neutral when others get emotional. To reduce size when conditions change. To wait without feeling left out.
It’s the difference between reacting to the market and responding to it. Regardless if it’s fever-pitch earnings season or the Economic Calendar is jam-packed with events.
🕰️ The Long Game Always Wins
With that in mind, trading careers aren’t built in viral moments. They’re built in years upon years of working on your craft.
The traders who last aren’t necessarily the smartest or fastest. They’re the ones who made it boring enough to sustain it. And eventually, almost accidentally, the process builds itself into something that looks a lot like success.
Off to you : What’s your consistency strategy saying? Is boring beautiful or is risk-taking maxed out in your portfolio? Share your thoughts in the comments!
How Funds Actually Make Money From BitcoinIf you spend more than five minutes on Crypto TikTok (YouTube or X are not much different), you’d think the entire market depends on:
- who “bought the dip,”
- who “sold the top,”
- and which whale “decided” to pump or dump.
The screamers with flashy thumbnails and zero understanding yell:
- “BlackRock is buying—BULLISH!”
- “Whales are selling—CRASH INCOMING!”
- “Institutions are entering the market!!!”
- No nuance.
- No structure.
- No clue.
Because here’s the truth:
What BlackRock buys or sells is almost irrelevant to you.
Funds do not make money the way TikTok believes.
They don’t need Bitcoin to go up.
They don’t need Bitcoin to go down.
They need one thing:
Movement. Volatility. Math.
Let’s destroy the hype and show how funds actually make money.
1. Why “BlackRock is buying BTC” tells you absolutely nothing
Retail sees a headline:
“ETF inflows: +5,000 BTC today!”
And jumps to conclusions:
“They know something!”
“Price HAS to go up!”
“Institutions are bullish!”
No.
A fund can buy BTC and still be:
- 100% hedged
- delta-neutral
- directionally flat
- risk-neutral
- fully protected against price movement
The purchase is not a bet.
It’s a component of a structured position.
Buying BTC is just Step 1.
What matters is Step 2, 3, 4, 5…—all the parts TikTok doesn’t even know exist.
2. Why TikTok “analysts” have no idea what they’re talking about
If someone:
- screams in every video,
- says “bullish” or “bearish” 40 times a minute,
- thinks “institutions pump price,”
- doesn’t know what delta, gamma, basis, hedging, ATM straddles are…
…then they are not explaining institutional flow.
They are farming views and likes, not teaching markets.
Let’s be blunt:
If you can’t explain a delta-neutral hedge, your opinion about what BlackRock “plans to do” or "is doing" is worthless.
So let’s walk through how a real fund uses BTC to print money without caring if price goes up or down.
3. How a real fund makes money from volatility (step-by-step, using $100,000 BTC)
Assume:
- BTC price = $100,000
- A fund wants exposure to volatility, not direction
- They buy a BTC ATM straddle (call + put at 100k)
- Delta ≈ 0
- Gamma > 0 → the part that generates money
- They also own BTC spot for hedging.
- Let’s say the fund holds 1 BTC worth $100,000 as inventory for hedge adjustments.
At the start:
Delta-neutral. No directional risk.
Now let’s see how they profit.
Step 2 – BTC goes up 10% → $110,000
Straddle delta becomes +0.5 BTC.
The fund is unintentionally long 0.5 BTC.
To go back to neutral:
The fund sells 0.5 BTC at $110,000.
Cash received:
0.5 × 110,000 = $55,000
Theoretical cost basis (100k):
0.5 × 100,000 = $50,000
👉 Profit from hedge = $55,000 – $50,000 = $5,000
Plus, the straddle increased in value due to volatility.
Step 3 – BTC drops 10% → $90,000
Now straddle delta flips negative: –0.5 BTC
To get back to neutral:
The fund buys 0.5 BTC at $90,000.
Cash paid:
0.5 × 90,000 = $45,000
If they later sell that BTC at the baseline of 100k:
👉 Profit = $50,000 – $45,000 = $5,000
Again, without needing BTC to go up or down, “as predicted.”
This is called:
Gamma scalping — the quiet, relentless engine behind institutional P&L.
Up move → sell high.
Down move → buy low.
Repeat. Print. Sleep.
4. Where does the REAL profit come from?
A fund earns from:
- hedge adjustments (buy low, sell high, but mathematically—not emotionally)
- straddle appreciation as realized volatility exceeds implied volatility
- basis differences between spot and futures
- neutrality to direction, allowing consistent compounding
They make money even if Bitcoin swings between 95k–105k for weeks.
The only time they lose?
When BTC does NOT move.
Because then the straddle premium decays.
That's it.
Nothing to do with faith, predictions, narratives, influencers, or ETF flows.
5. So why should YOU ignore what BlackRock is doing?
Because:
- You are not BlackRock.
- You do not run a delta-neutral book.
- You do not make money from gamma exposure.
- You do not scalp intraday hedges on $100M positions.
- You do not capture basis spreads across spot and derivatives.
- You do not have a trading desk rebalancing risk every hour.
But the TikTok screamers will still tell you:
“Institutional buying = bullish!”
“Institutional selling = bearish!”
“Whales know something!”
They don’t know anything.
Especially not about institutional structure.
So here’s the punchline:
Watching what funds do—without understanding why they do it—is the fastest path to confusion in the best case and destruction in the worst.
You don’t have their:
- tools,
- capital,
- execution speed,
- risk models,
- mandate,
- or mathematical framework.
So trying to mimic them is not just pointless —it’s dangerous.
Final Lesson: Ignore the noise, ignore the hype, ignore the TikTok parade.
BlackRock doesn’t care about bull markets or bear markets.
BlackRock doesn’t need Bitcoin to moon.
BlackRock doesn’t panic when Bitcoin drops.
Because BlackRock doesn’t trade the story.
They trade the structure.
And unless you operate like a fund — stop pretending their moves matter to your trading.
You’re not them.
You don’t have their machinery.
You don’t have their volatility book.
So:
Stop watching what institutions do.
Start understanding what you should do.
That’s the difference between surviving and blowing up.
P.S: BlackRock and TikTok are used just as an example:)

High Probability Setups: Divergence in Price and VolumePrice defines direction, but volume defines participation. High probability setups emerge when both align. When they separate, conditions change. Divergence between price and volume is one of the clearest tools for assessing whether a move is supported by real commitment or driven by diminishing participation.
In strong market conditions, impulsive price movements are accompanied by stable or increasing volume. This shows that traders are actively committing capital in the direction of the move. Pullbacks during these phases typically show reduced volume, confirming that counter-moves are corrective rather than a shift in control. This alignment between price expansion and volume participation supports continuation.
Divergence forms when price continues to extend while volume contracts. The market is still moving, but fewer participants are involved. This shift indicates that momentum is weakening beneath the surface. The move becomes more fragile, and continuation requires increasingly less resistance to fail. These conditions often develop before structural changes become visible on price alone.
The relevance of divergence increases at key locations. When price reaches major highs or lows, premium or discount zones, or obvious liquidity pools, declining volume signals absorption. Orders are being filled without follow-through. Late participants provide liquidity rather than fuel. This explains why many apparent breakouts stall or reverse shortly after forming.
Volume behaviour also clarifies breakout quality. Breaks that occur with low or declining volume often lack acceptance. Price may move beyond a level, but without participation the market struggles to sustain the new range. When price quickly re-enters the prior structure, divergence explains the failure before structural confirmation appears.
During consolidation phases, volume provides insight into preparation. Falling volume reflects compression and balance. Rising volume within a range reflects active engagement and positioning. Divergence during these phases often precedes resolution, especially when combined with liquidity interaction at range boundaries.
High probability setups form when divergence aligns with location and structure. Volume refines what price presents. It helps identify whether a move is being supported, absorbed, or exhausted. Reading this relationship consistently improves timing, reduces false entries, and keeps execution aligned with real market participation rather than surface-level movement.

Why Bitcoin Hits Your Stop Loss Before the Real MoveWhy Bitcoin Hits Your Stop Loss Before the Real Move
Have you ever placed a Bitcoin trade and noticed this? 🤔
Your stop loss 😭💸 gets hit… just a few pips from your entry… then the price suddenly rockets 🚀💎 in the direction you were expecting!
This is not bad luck. It’s a Stop Loss Hunt 💥, used by smart money 🏦💰 to collect liquidity before the real trend begins.
1️⃣ Liquidity Pools Above Highs & Below Lows 📊💎
Retail traders place stop losses at obvious highs/lows 📈📉
These stops create liquidity zones 💧, which smart money targets 🔍
Price moves to these zones to collect liquidity → fuels the next trend 🚀
Example:
BTC trending upward 📈
Traders place buy stops above the previous high ⬆️
Smart money pushes price to trigger stops 💥 → collects liquidity 💎 → then moves the price in the real trend direction 🚀
2️⃣ Stop Loss Sweep 💥⚡
Price triggers retail stop losses 🛑
Retail traders get stopped out 😭💸
Institutions enter large positions with minimal resistance 💹
Key Insight:
Price needs liquidity 💧 to move strongly.
Without collecting stops, smart money cannot drive momentum efficiently ⚡
3️⃣ Fake Breakouts & Wicks 🌪️🔥
Watch for wick spikes or sudden breakouts 🕵️♂️
These are stop loss hunts
Many traders panic 😱 and exit positions
Smart money uses this to trap retail traders and continue the trend 🚀
4️⃣ The Real Move Begins 🚀🔥
After liquidity is collected 💎💧
The true trend resumes 📈
Traders who waited can enter safely 🧘♂️💹
Often, the move is stronger and faster ⚡ because institutions now control the market
5️⃣ Market Psychology Behind Stop Hunts 🧠💭
Retail traders panic when stops are triggered 😅💸
Fear is used to manipulate sentiment 🧲
Recognizing this psychological trap helps you stay calm 🧘♂️ and trade strategically 🏆
6️⃣ How to Trade Stop Loss Hunts 💡🧠
✅ Avoid stops at obvious highs/lows 🚫
✅ Wait for liquidity sweep ⏳💧
✅ Watch for wick spikes 🌟 — early signs of stop hunts
✅ Follow market structure 📊 (BOS/CHoCH)
✅ Trade after confirmation ⏱️
✅ Patience + discipline = profits 💎💹
7️⃣ Examples in Bitcoin Trading 🔍
Double top wicks above high → triggers stops 💥 → continues trend 🚀
Price dips below support → triggers stops 😭 → rebounds ⬆️
💡 Observation: Every wick tells a story 🌟 — learn to read it!
💬 Key Takeaways
Stop Loss Hunts = institutional footprints 👣
Price hunts liquidity 💧 — that’s why your SL is hit 💥
Understanding this helps you:
Trade smarter 💎
Avoid losses 😅💸
Spot trends before they happen 🚀

Why Central Banks Buy Gold — The Ultimate Asset of PowerWhen a central bank decides to buy gold, it is not simply adding another metal to its reserves. It is reinforcing the foundation of national financial power — a form of strength that does not rely on promises, carries no debt obligation, and cannot be manipulated by any superpower. In a modern financial system where nearly every asset represents someone else’s liability — from U.S. Treasuries to fiat currencies like USD or EUR — gold stands apart. It is not anyone’s debt, is immune to political influence, and cannot be printed. This absolute independence makes gold the ultimate anchor of national trust.
Gold carries a dual nature: it is both a durable financial asset and a geopolitical instrument. It protects national wealth in ways fiat currencies cannot. A country with substantial gold reserves possesses a shield for its currency, reducing vulnerability to exchange-rate shocks and enhancing stability during global cycles of volatility. History has repeatedly confirmed this pattern: during major inflationary periods — from 2008–2011, through the 2020 pandemic peak, to the inflation surge of 2022 — gold followed the same rule. When money lost value, gold rose. When central banks expanded money supply, gold became the final line of defense.
On the geopolitical level, gold’s role is even more pronounced. It does not depend on the U.S. dollar system, does not require SWIFT for settlement, and—most importantly—cannot be frozen like foreign exchange reserves. In an increasingly polarized world, gold has become the safest asset a nation can hold: silent power, yet profoundly real.
Central banks do not buy gold like retail investors. They accumulate it gradually and strategically over long periods, quietly, without disturbing prices or signaling intentions. Within reserve structures, gold sits alongside USD and U.S. Treasuries as a three-pillar framework: gold for systemic risk protection, USD for liquidity, and bonds for yield. In times of crisis, gold becomes an “activation asset” — sold to obtain USD, defend the exchange rate, stabilize confidence, and prevent currency collapse. This logic also explains the accelerating trend of de-dollarization across Asia, the Middle East, and especially the BRICS bloc.
Real-world examples reinforce gold’s role. China has consistently increased gold reserves from 2019 to 2025, according to PBoC disclosures, aiming to reduce USD dependence and strengthen the renminbi amid rising trade tensions. Russia provides the clearest case: after sanctions in 2022 froze most USD and EUR assets, gold remained untouched — serving as Russia’s financial immune system. In Turkey, when inflation surged to 60–80% between 2021 and 2023, the central bank expanded gold reserves to stabilize confidence in the lira — a strategy acknowledged in IMF surveillance reports.
The 2023–2025 period has revealed an undeniable truth: in a world marked by high inflation, a strong dollar, geopolitical conflict, and global recession risks, countries with large gold reserves — such as China, Russia, and India — maintained relative stability, while nations with weaker reserves struggled with currency crises, external debt, and inflation. When everything else depends on trust, gold depends on nature — and that is why it remains a pillar of national power even in the 21st century.

BITCOIN'S ALL TIME HISTORY CHART(KEY INSIGHTS)This is a breakdown of all major waves that have occurred in Bitcoin's History. This chart might explain why CRYPTOCAP:BTC has been the most successful coin while also answering if the growth will be sustained. This is a pretty standard 5 wave move- Waves 1 to 4 having been completed(shown in Red). We are on our last Major wave before it becomes a complete 5 wave impulse.
Wave 1(Red) was followed by a Zigzag correction for Wave 2, hence we expected a Flat correction For Wave 4. Keep in mind, this Flat correction had been predicted almost 2 and a half years before, when Wave 2 was completed! Wave 4 had 3 internal waves namely A,B and C- shown in Blue.
With Wave 4 complete, it was time to launch our 5th Wave of the Major impulse. This 5th Wave has 5 internal waves as is typical for impulses and are shown in Green. Once again, when Wave 1(Green) completes we see a Flat correction for Wave 2 meaning our Wave 4 would most likely be a Zigzag correction. Note that these two corrections are best seen on the Weekly and Daily Charts.
With Wave 4(Green) complete, what we are left with is Wave 5(Green) in its final developments. Once this Wave 5 is complete, this will be the Wave 5(Red) of Bitcoin. When this happens, it will be the end of the first impulse that started in 0ct. 2009 and the beginning of Wave 2, which will be a massive correction!

A Honest Annual Trading Review: Losses, Lessons, and 2026It’s December 11th, and there are maybe ten real trading days left in the year. At this point, there isn’t much more to do. The market won’t change my year, and I won’t change the market.
So it’s the right moment for an annual review.
I’m not the kind of trader who does weekly or even monthly “performance summaries” that don’t actually mean anything. For me, the only question that matters is this:
With how much did I start the year—and with how much am I ending it?
And after fourteen consecutive positive years, this is the year I end in the red.
So the question becomes: Why?
Why did I lose this year?
Before I dive into the lessons, the mistakes, and the changes I’ll implement starting in 2026, I need to give you some context—because no trading journey exists in isolation.
From 2002 to Today: A Long Road Filled With Luck, Lessons, and Reality
I began trading in 2002, investing in stocks right after the dot-com bubble. And things went incredibly well— not because I was smart, not because I understood markets, but because I had one of the greatest advantages a trader can have:
Perfect timing after a major market collapse.
In other words: pure luck.
In 2004 I discovered Forex, and by 2007 I had shifted entirely to Forex trading.
Until 2009, everything worked almost effortlessly. Every year was green. Even the 2008 crisis was profitable for me—I happened to hold some exceptional short positions.
And then came 2009.
The market didn’t humble me. My own arrogance did.
“ I can’t be wrong. I predicted the 2008 crash. I see the market clearly. I’ve got this.”
That mindset cost me 50% of everything I had accumulated.
That was my first real wake-up call.
It forced me to understand a truth that every long-term trader eventually learns, one way or another:
Humility in front of the market is not optional. It is survival.
That realization became the first major shift in how I approach trading.
What Changed After 2009: A Short Summary of a Long Transformation
As a brief summary of what shifted after 2009—beyond drastically reducing my appetite for risk—the biggest change was my transition toward pure price action and swing trading as the foundation of my approach.
Before that, the market felt almost binary, almost predictable.
- If NFP came in above expectations, the USD strengthened—and it stayed strong, not just for a few intraday spikes.
- When Hurricane Katrina hit, the narrative was straightforward: weak USD.
- Carry trade on JPY was the play all the way until 2008, so buy every substantial dip
- Breakouts were real breakouts—not whatever we have today, with fakeouts layered on fakeouts.
It was a different environment.
Cleaner. More directional. More narrative-driven.
And I traded it exactly as it was.
But markets evolve, and if you don’t evolve with them, you get left behind.
So I adapted.
I shifted from being a trader who reacted to news flows and macro momentum to a trader who reads structure, context, and price behavior first.
I shifted from chasing moves to waiting for high-probability rotations.
I shifted from assuming I understand the market to accepting that the market owes me nothing and can invalidate my ideas at any moment.
There’s much more to say about that transition—how painful it was, how long it took, and how it changed the way I think not just about trading, but about myself. But that’s a story for another time.
For now, it’s enough to say this:
2009 forced me to mature as a trader.
What followed shaped the next decade and a half.
It’s Not About Trump, and It’s Not About Excuses
This isn’t about Trump coming to the White House.
This isn’t about macro narratives or politics.
Yes, the markets did shift around that period — but this article is not about searching for excuses.
Because when it comes to Forex and XAUUSD, I managed the environment just fine.
I adjusted. I adapted. I traded often from instinct shaped by experience, and overall, that part of my trading year held up.
What dragged my year down — completely and undeniably — were my crypto investments.
I Was Never a “To-the-Moon” Guy — And Still Lost Substantially
I’ve never been a moonboy.
I’ve always been realistic with my targets: soft, achievable gains in the 30–50% range.
I never believed in the mythical “altcoin season.” I said repeatedly that it was wishful thinking and that the glory of past cycles would not repeat.
I didn’t gamble on new projects, I didn’t throw money at memes, and I didn’t YOLO into narratives.
And yet — I still lost.
So why?
Because I allocated too much capital, even within my fixed conservative approach.
Not because I believed in altcoin season, but because I believed we would see a meaningful recovery in the autumn.
I sized like someone expecting a bounce.
When the bounce didn’t come, instead, the flash crush from October, the weighting crushed the year( BTW, I wasn't leveraged)
Simple as that.
What I Will Change in 2026 (Crypto Edition)
The fix is straightforward:
- No more long-term investing in crypto, regardless of narrative.
- Maximum time exposure: a few days, maybe a few weeks.
- Stick strictly to major, established projects.
- Trade only what behaves cleanly from a technical perspective.
In other words, crypto will no longer be a long-term play in my portfolio.
It will be treated exactly as I should've be treated it from the beginning:
a short-term speculative instrument — nothing more, nothing less.
Forex and XAU/USD / XAG/USD: The Adjustments Going Into 2026
On the Forex and metals side, the changes are more nuanced — and in some ways, more strategic.
The core shift is this: shorter-term focus, smaller targets on Forex, larger targets on Gold, and a more active approach on Silver.
Here’s the breakdown:
1. Smaller Targets in Forex (EUR/USD as the Example)
In previous years, a 200–250 pip target on EUR/USD was perfectly reasonable.
The volatility allowed it, the market structure supported it, and the flow followed through.
But today, that kind of moves — consistently — is simply not realistic (look at it in the past 6 months).
So the adjustment is straightforward:
From 200–250 pip targets → to sub-100 pip targets.
It’s not about aiming lower.
It’s about aligning targets with actual market behavior, not nostalgia for a volatility regime that no longer exists.
2. Larger Targets on Gold (Because the Volatility Demands It)
Gold is the opposite story.
Volatility has exploded, rotations are massive, liquidity pockets run deep, and intraday swings are two or three times what they used to be.
So the shift here is:
From 300–400 → to 500+ being the new standard.
You can’t trade for 50-100 pips an instrument that behaves like a hurricane.
You adapt to its nature — or it eats you alive.
3. A More Active Approach on Silver (XAG/USD)
Silver has become a much more attractive instrument for me:
- Cleaner technical behavior
- Larger relative percentage moves
- Alignment with Gold, but with more exploitable inefficiencies
So 2026 will include more active trading on XAGUSD, treating it as a strategic middle ground between Forex and Gold volatility.
4. Integrating More ICT/SMC Into My Framework
Another important change is methodological:
I’ll incorporate more ICT/Smart Money Concepts into my analysis and execution.
Not as a religious shift — I’m not replacing classical TA and price action — but as an enhancement.
SMC concepts:
- map exceptionally well onto today’s liquidity-driven markets
- clarify sweeps, inducement, fakeouts
- explain displacement and rebalancing
- blend naturally with the price action approach I already use
In other words, this is not a stylistic change — it’s an upgrade of the internal framework.
Price action stays.
Classical TA stays.
But SMC becomes a bigger part of the decision-making process.
What This All Means for 2026: A Cleaner, Tighter, More Adapted System
When you put all these adjustments together — the crypto restructuring, the refined Forex targets, the larger Gold plays, the increased activity on Silver, and the deeper integration of SMC — the message becomes clear:
2026 won’t be about reinventing myself.
It will be about refining myself.
This year wasn’t a catastrophe ( around 15% loss overall)
It wasn’t an identity crisis.
It was a recalibration — a reminder that longevity in trading is not about perfection, but adaptation.
I didn’t lose because I became worse.
I lost because my allocation in one corner of my portfolio didn’t match the reality of the market.
And the only unforgivable mistake in trading is refusing to learn from the forgivable ones.
The markets haven’t betrayed me.
Crypto hasn’t betrayed me.
Forex and metals haven’t betrayed me.
The responsibility is mine — and so is the path forward.
In 2026, my system becomes:
- Simpler — fewer narratives, more structure.
- Tighter — smaller Forex targets.
- More opportunistic — bigger Gold moves, active Silver plays, short-term crypto speculation.
More aligned with how markets actually behave, not how past versions of me used to trade them.
And that’s the real conclusion of this year:
After almost 25 years in the markets, the only edge that never expires is the willingness to evolve.
Some years, you win because you’re right.
Some years, because you're lucky.
Some years you lose because you’re human.
But the trader who survives is the trader who adapts — again and again, without ego, without excuses.
And that’s exactly what 2026 will be about.
P.S:
And One More Thing… I Kind of Expected This After 14 Years
If I’m being completely honest, part of me always knew this moment would come.
You don’t go fourteen consecutive years without a losing one and expect the streak to last forever.
Statistically, psychologically, realistically — a red year was inevitable at some point.
So no, this wasn’t a shock.
It wasn’t a dramatic fall from grace.
It was simply… the year that was eventually going to arrive.
And that’s actually liberating!:)
Because once you accept that even long-term consistency includes the occasional step backward, you also see the bigger picture clearly:
This year doesn’t define me — the next one will.

How i Sell Spot btc & Close my Longs at TopThis isn’t a call on where Bitcoin goes next. It’s simply the chart that helped me exit my long positions right near the top.
I’ve kept this setup unchanged for years. No fancy indicators, no complicated overlays. Just the long-term trend lines that have guided every major expansion and slowdown since Bitcoin’s early cycles. When price tapped the upper boundary of this structure, the reaction was enough for me to start unwinding my longs. Nothing mystical here — just respecting a level that has mattered for nearly a decade.
The point of sharing this is to show how even the oldest, simplest charts can keep you grounded. Markets get noisy. Narratives change every week. But the big structure rarely lies. This chart helped me stay disciplined, and it still sits on my screen the same way it did years ago.

Mastering MACD: A Complete Guide to Momentum🔵 Mastering MACD: A Complete Guide to Momentum, Trend Phases, Reversals & Professional Signals
Difficulty: 🐳🐳🐳🐳🐋 (Advanced)
This article goes far beyond simple MACD crossovers. You will learn where MACD comes from, why it was created, and how professionals use it to read momentum, trend phases, acceleration, deceleration, and early reversals.
🔵 THE ORIGINS OF MACD (A SHORT HISTORY)
The MACD (Moving Average Convergence Divergence) indicator was developed in the late 1970s by Gerald Appel , a technical analyst and investor.
At that time, traders relied heavily on moving averages to identify trends. While useful, moving averages alone could not explain one critical question:
Is momentum strengthening or weakening inside the trend?
Gerald Appel solved this by measuring the distance between two moving averages and tracking how that distance expands and contracts.
This simple idea allowed traders to:
Detect trend acceleration and deceleration
Spot momentum exhaustion before reversals
Combine trend direction and momentum in one tool
Later, in the 1980s, Thomas Aspray introduced the MACD histogram , making momentum pressure visible instead of hidden inside lines.
This transformed MACD from a crossover tool into a true momentum phase indicator .
MACD still works today because institutions, funds, and algorithms continue to rely on moving averages.
🔵 WHY MOST TRADERS MISUSE MACD
Most traders reduce MACD to one idea:
Buy when MACD crosses above the signal line
Sell when MACD crosses below the signal line
While MACD crossovers are frequently used to signal potential trend reversals, their effectiveness improves when they occur at extreme MACD levels, far above or below the zero line, where momentum exhaustion is more likely.
MACD is not a buy or sell button.
MACD is a momentum and trend phase analyzer .
To master MACD, you must understand:
Zero-line regimes
Histogram pressure
Momentum expansion and contraction
Divergences
Continuation behavior
Structure confirmation
Multi-timeframe alignment
MACD shows how momentum changes around trend, not where price will go next.
🔵 MACD STRUCTURE (WHAT IT IS REALLY MEASURING)
MACD consists of three components:
MACD line = difference between fast EMA and slow EMA
Signal line = smoothed average of MACD
Histogram = distance between MACD and signal line
Because of this construction, MACD measures the rate of change between trends .
Expanding MACD means momentum is accelerating.
Contracting MACD means momentum is fading.
🔵 ZERO-LINE REGIMES (TREND PHASE IDENTIFICATION)
The zero line is the most important level in MACD.
Bullish MACD Regime
MACD stays above zero
Pullbacks stall near zero
Histogram remains mostly positive
Bearish MACD Regime
MACD stays below zero
Rallies fail near zero
Histogram remains mostly negative
Professional rule: Trade in the direction of the zero-line regime. Ignore signals against it.
🔵 HISTOGRAM PRESSURE (THE REAL EDGE)
The histogram reveals momentum pressure before crossovers appear.
Expanding histogram = momentum acceleration
Contracting histogram = momentum deceleration
Below the zero line, higher histogram lows indicate weakening bearish momentum and a potential bullish shift
Above the zero line, lower histogram highs indicate fading bullish momentum and a potential bearish shift
Histogram turning points often precede:
Trend pauses
Pullbacks
Reversals
The histogram is the heartbeat of MACD.
🔵 MOMENTUM DIVERGENCES (EARLY WARNING SYSTEM)
Bearish Divergence
Price makes higher high
MACD or histogram makes lower high
Momentum weakens before price
Bullish Divergence
Price makes lower low
MACD or histogram makes higher low
Selling pressure fades
Divergences work best:
After extended trends
Near major structure levels
When histogram contracts sharply
🔵 MACD AS A TREND CONTINUATION TOOL
MACD excels at trading pullbacks in strong trends.
Bullish Continuation
MACD above zero
Histogram pulls back toward zero
Histogram turns positive again
Bearish Continuation
MACD below zero
Histogram retraces upward
Histogram turns negative again
This is the professional way to use MACD inside trends.
🔵 MACD + PRICE STRUCTURE CONFLUENCE
MACD becomes powerful when aligned with structure.
Higher highs + rising MACD = healthy trend
Higher highs + flat MACD = weakening momentum
Break of structure + MACD zero-line flip = regime change
Structure retest + histogram expansion = high-probability entry
MACD filters false breakouts by revealing momentum behind price.
🔵 MULTI-TIMEFRAME MACD ALIGNMENT
Professional rule:
Lower timeframe setups must align with higher timeframe MACD regime.
HTF MACD above zero = long-only bias
HTF MACD below zero = short-only bias
HTF histogram expanding = trend acceleration
This alignment significantly improves consistency.
🔵 EXAMPLE TRADING FRAMEWORK
Bullish Setup Checklist
MACD above zero
Histogram contracts then expands
Price forms higher low
Bearish Setup Checklist
MACD below zero
Histogram retraces then expands negatively
Price forms lower high
🔵 COMMON MACD MISTAKES
Trading every crossover blindly
Ignoring zero-line regime
Using MACD without structure context
Overreacting to small histogram changes
Treating MACD as a prediction tool
🔵 CONCLUSION
MACD is not a simple crossover indicator. When mastered, it becomes a complete framework for:
Reading momentum strength
Identifying trend phases
Detecting exhaustion early
Trading continuation setups
Confirming structure shifts
Aligning multi-timeframe bias
MACD does not predict price.
It reveals how momentum evolves around trend.
How do you use MACD? Histogram pressure, zero-line regimes, or divergences? Share your approach below.

Mastering the Art of the Exit With a Simple Trick.Mastering the Art of the Exit With a Simple Trick.
Let me share a situation with you that has caused me more anxiety in the market than any other.
You buy a stock, a currency, or a cryptocurrency.
And this time... yes! It starts to climb. And climb. You are up 5%. Then 10%!! Suddenly, you are staring at a 15% gain!!!!
It feels brilliant. You have nailed the entry point, and your ego starts to whisper that you might just be a GENIUS.
But, my friend, this is the easy part of trading . Finding entry points is relatively simple.
The complexity of trading lies in the exit.
And this is exactly where our brain serves us a banquet of overwhelming anxiety.
Do we take that 15% and call it a win?
Do we get out?
But what if I sell and it shoots up to 30%? I entered so perfectly, I better stay.
I couldn’t bear missing the rally... But what if it suddenly turns around and we drop back to 0%?
If you have ever invested a single dollar, this internal dialogue must resonate deeply within you.
This anxiety is born from a lack of control.
Because we lack control over when to exit, our minds go wild, tossing scenarios into the air like someone plucking petals off a flower to decide their future.
REGAINING CONTROL
Today, I want to hand you a tool that will help you identify the precise moment it becomes interesting to reduce positions in a bull market, or even start considering a short position.
This strategy is incredibly simple to execute, and it works on any stock or listed market.
In the charts below, I have marked a few specific candles. These are magnificent candles for identifying when a bullish cycle is coming to an end, or at the very least, is about to take a significant pause.
What do you think they have in common?
Notice that these are charts from very different companies and sectors, in bullish, sideways, or bearish situations.
But all of them mark moments of change . They are highly interesting moments to sell.
What do you believe these candles share?
I am going to give you the answer in a moment, but whether you guessed right or not, I would love to know what went through your mind.
I’ll read you in the comments!
The answer, once you know it, is quite obvious, and it might even make you feel a little frustrated (my apologies!) .
But the truth is, the answer has always been right there in front of you.
It is like when you do not understand a language: you hear the sounds, but you do not comprehend the meaning. In this case, you have seen it, but perhaps you haven’t realized its significance.
Come on, let me give you one more clue.
Do you see it now?
Precisely.
The volume on those days is absolutely ridiculous.
When you compare it with the surrounding days, these days clearly fall below the average.
In fact, for those of you who love the data, we are talking about volumes in the 2nd or 3rd percentile maximum. That means out of every 100 trading days, we are looking for the 2 or 3 days with the least volume.
We are looking for the rare ones!
Important Note: You must NOT count public holidays or the days immediately preceding them. During Christmas, August, and other holidays or semi-holidays, volume is low per se. We are looking for low volume on normal trading days.
THE PSYCHOLOGY OF LOW VOLUME
The market moves based on the buying and selling of its participants.
When you buy, an immutable record remains of how many shares were bought and at what price. The sum of these shares and prices creates the trading volume.
When many people are interested in a stock, volume rises. Many shares change hands rapidly, causing the price to climb and climb, provoking even more transactions.
But sometimes, something incredible happens.
The price is making new highs, or is very close to them, yet the volume is ridiculous.
Why?
It means we have reached a point where we have run out of buyers. However, at the same time, the sellers do not want to "undersell" . They are waiting for that buying pressure to appear again.
When it doesn’t happen, and we see a day of low volume because buyers want it cheaper and sellers (for now) don’t want to lower their prices , we see a standoff.
No exchanges are achieved.
When the smartest sellers realize this, they begin to lower their prices in search of liquidity. As this drop in price initiates, the rest of the sellers begin to sell, entering into a progressively greater panic.
These candles indicate a lack of transactions due to a misalignment of supply and demand. The day following this misalignment, we typically see a forceful candle confirming that the price needs to be in a different zone, one where we are all willing to transact.
These days can signal both trend continuation and trend reversal, but that is a detail requiring a depth we won’t cover today.
Today, I will focus on the days of trend reversal.
Notice that in addition to working in bearish trends, this works equally well for bullish reversals. In fact, on the same chart, you can find opposite examples and make money in both directions, like this:
It even works well on higher timeframes like the Weekly, especially when combined with larger Chart Patterns, such as the Double Bottom.
HOW TO DETECT THEM
To spot these moments, TradingView offers a very interesting, and quite unknown free indicator.
It is called High/Low Volume.
It marks percentile lines, which helps you visualize the days with the lowest volume. Remember to be careful, many of these marks will be holidays, or days near Christmas or August. Discard those.
I hope that the next time you see a day of low volume, provided it isn’t a holiday, you will see the market through a different lens.
I invite you to start analyzing if this is happening at support or resistance levels , or if it fits with a larger chart pattern to guide your way.
🎁 Let’s make a simple deal.
I will handle the heavy lifting to create content like this for free, and you just HIT the 🚀 Rocket and Follow for more!
🤝 Deal?

MSFT Potential Upside Squeeze SetupMSFT is currently forming a constructive structure with clearly defined levels.
On the downside, the 475 put support has been defended three separate times, signaling strong positioning interest and consistent absorption of selling pressure. Price continues to hold above the HVL , with an extremely narrow transition zone and a broadening upward-tilted positive GEX profile — all reinforcing structural stability.
If price breaks upward from the first call wall at 480 , this typically favors continuation rather than any sustained move lower.
Upside levels :
The next major call resistance sits at 500 — which also aligns with the 8/8 level on the MM grid system . This creates a very strong confluence, making 500 a significant resistance zone.
If price cleanly accepts and pushes through 500, dealer hedging flows can accelerate, potentially triggering an upside squeeze — with an initial upside extension capped near 520 .
If momentum continues to build above 500, the next substantial call resistance sits at 520 , currently the second-largest call wall on the chain.
As long as price remains above HVL and the 475 support zone holds, the risk-reward skew favors continuation to the upside, with 480 as the trigger level and 500 as the speculative call-positioning target .
However — critical risk scenario:
If 475 breaks and we do not see a fast rebound from the 470/460 negative squeeze zone , this could initiate a sharp downward move and a trend shift. Currently, the largest protective put concentration sits at 475 — and the put side only begins to melt if price can reclaim 480 .
At least based on the aggregated options chain, MSFT is now under immense compression with clear trigger points .
MSFT tightening under GEX squeeze pressure

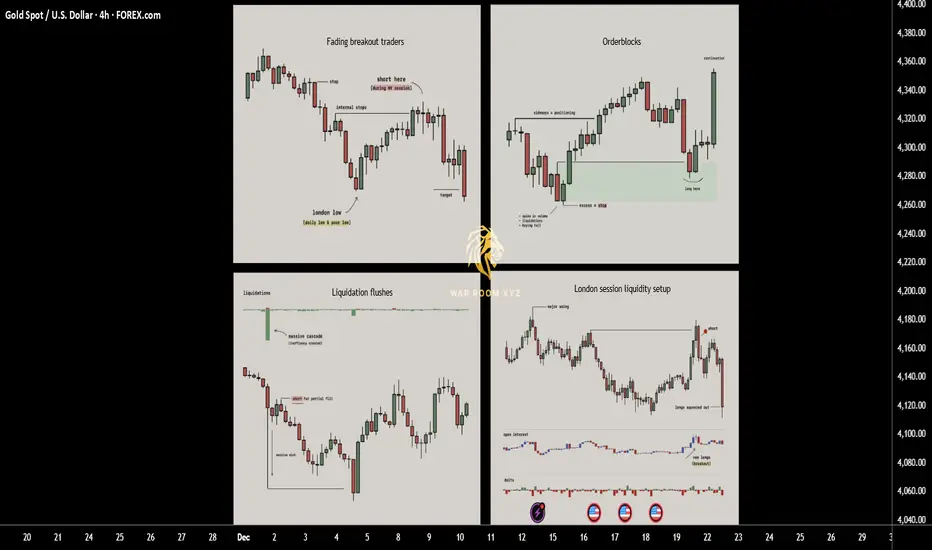
How Price Really Moves: 4 Entry Triggers Driven by LiquidityThis breakdown explains four recurring entry triggers that appear consistently across real market structure.
These are not indicators and not prediction tools. They are observable behaviors driven by liquidity, positioning, and trader psychology.
Each trigger is rooted in why price moves, not what price might do next.
1. Fading breakout traders (Failed Momentum / Trap Model)
When price breaks a key level and open interest jumps, breakout traders rush in expecting continuation. If price quickly snaps back, those new traders become trapped and their exits fuel a move in the opposite direction. This creates one of the cleanest reversal triggers since you are trading directly against failed momentum.
► What usually happens
Markets frequently approach obvious highs, lows, or range boundaries where:
•Retail breakout traders anticipate continuation
•Algorithms and short-term momentum systems enter aggressively
•Open interest or volume often expands rapidly
At this moment, new positions are created late , directly into resistance or support.
► The key failure
If price:
•Breaks a key level
•Fails to hold acceptance beyond it
•Quickly closes back inside the prior range
Then the breakout has failed structurally.
This means:
•Buyers who entered above resistance are now trapped
•Sellers who entered below support are trapped
•Their exits (stops + panic closes) become fuel for the opposite move
► Why this works
Markets move efficiently when traders are positioned correctly.
They move violently when traders are positioned incorrectly.
A failed breakout converts hope-based positions into forced exits.
► Educational takeaway
You are not trading the level,
you are trading the failure of belief at the level.
This is why failed breakouts often produce:
•Fast reversals
•Clean directional candles
•Strong continuation after rejection
2. Liquidation flushes (Forced Exit & Rebalance Model)
Sharp liquidation events create long wicks and temporary price inefficiencies. Markets tend to rebalance after these shocks as liquidity returns, which is why these wicks often get filled quickly. This setup works well in volatile phases and near exhaustion points where forced selling or buying pushes price too far.
► What a liquidation flush is
A liquidation flush occurs when:
•Price moves aggressively in one direction
•Overleveraged positions are forcibly closed
•Stops and liquidations cascade simultaneously
This often creates:
•Long wicks
•One-sided impulsive candles
•Temporary price inefficiencies
Importantly, this move is not driven by new conviction, but by forced exits.
► What happens after
Once forced liquidations are complete:
•Selling or buying pressure rapidly decreases
•Liquidity returns to the market
•Price frequently retraces part or all of the wick
This retracement is not random
it is the market rebalancing after stress.
► Where flushes matter most
Liquidation flushes are most meaningful when they occur:
•Near prior highs/lows
•At range extremes
•After extended directional moves
•During high-volatility sessions
► Educational takeaway
A liquidation wick does not mean “strong trend”.
It often means the move is temporarily exhausted.
You are not trading momentum,
you are trading the absence of remaining pressure.
3. Orderblocks
Orderblocks are zones where previous heavy participation occurred, usually during sideways movements before a strong move away. When price revisits these levels, the same participants often defend the area, creating reliable reaction points. Clean pivots with no messy wicks are the strongest since they signal clear institutional activity.
► What an orderblock represents
Orderblocks are areas where:
•Large participants accumulated or distributed positions
•Price moved sideways briefly
•A strong directional move followed immediately after
This sideways phase exists because large players cannot enter all at once without moving price against themselves.
► Why orderblocks matter
•When price returns to these zones:
•Previous participants may still be active
•Unfilled orders may remain
•Defensive reactions are more likely than random continuation
Clean orderblocks typically show:
•Tight consolidation
•Minimal wicks
•Strong departure afterward
Messy structures often indicate mixed participation and weaker reactions.
► How orderblocks are used
Orderblocks are reaction zones , not signals.
They provide:
•Logical areas to expect interest
•Defined risk zones
•Context for entry triggers like wicks or failed breaks
► Educational takeaway
Orderblocks work because institutions remember their prices , even if retail traders forget them.
You are trading where participation previously mattered, not arbitrary support or resistance.
4. London session liquidity setup
London frequently sets the daily low or high early in the session. Later in the day price often returns to sweep internal liquidity around that level before continuing the trend. This repeatable behavior offers structured entries based on predictable liquidity grabs tied to session mechanics.
► Why London matters
The London session is:
•One of the highest liquidity windows globally
•Often responsible for setting the initial daily structure
•Heavily watched by institutions and algorithms
In many markets, London establishes:
•The daily high
•The daily low
Or a key internal liquidity level early in the session
► The repeatable behavior
Later in the day (often London continuation or New York):
•Price returns to that London high or low
•Sweeps internal liquidity around it
•Rejects after stops are collected
•Continues in the higher-timeframe direction
This is not coincidence,
it is session-based liquidity engineering.
► Why it works
Institutions prefer:
•Liquidity-rich entries
•Known pools of resting stops
•Session transitions for execution
London levels provide exactly that.
► Educational takeaway
Sessions are not just time zones,
they are liquidity cycles.
Understanding when liquidity is created is just as important as where.
How These Triggers Fit Together
These models are not standalone strategies.
They are contextual tools.
Very often:
•A London sweep causes a liquidation wick
•A failed breakout forms at an orderblock
•A liquidation flush completes a failed momentum move
The strongest setups occur when multiple triggers overlap , but each can stand alone as a learning framework.
Why These Triggers Work Long-Term
They work because they are based on:
• Trader positioning
• Forced behavior (stops, liquidations)
• Institutional execution constraints
• Repeating session mechanics
They do not rely on:
•Indicator crossovers
•Lagging calculations
•Pattern prediction
Price moves because someone is forced to act.
These triggers show where and why that happens.
These 4 triggers work because they exploit trapped traders, forced liquidations and consistent liquidity patterns rather than relying on indicators. Keep them simple, wait for clean context and let the setups come to you.
Note
These concepts are:
•Descriptive, not predictive
•Contextual, not mechanical
•Dependent on execution skill and risk management
The goal is not to trade more,
it is to wait for situations where the market gives you an advantage.
I have made a script which might help identify all 4 triggers.
Disclaimer
The script is provided for educational and informational purposes only.
It does not constitute financial advice, investment advice, or a recommendation to buy or sell any instrument.
The script does not execute trades, manage risk, or replace the need for trader discretion. Market behavior can change quickly, and past behavior detected by the script does not ensure similar future outcomes.
Users should test the script on demo or simulation environments before applying it to live markets and must maintain full responsibility for their own risk management, position sizing, and trade execution.
Trading involves risk, and losses can exceed deposits. By using the script, you acknowledge that you understand and accept all associated risks.
Surviving this market for 10 years taught me thisI’ve been trading this market for over 10 years.
In the beginning, all I cared about was how much I could make.
That’s what most people focus on.
What I learned the hard way is this:
If the account doesn’t survive, nothing else matters.
No funds means no next trade.
No next trade means no edge, no learning, no comeback.
There were long periods where I wasn’t making money.
But I was protecting my ability to stay in the game.
That mattered more than being right.
This chart isn’t about profits.
It’s about still being here.

How to Use Divergence in a High-Probability Way — Tutorial #1In this tutorial, I explain how to use Wide and Tight Divergence in a structured and practical way.
WHAT IS DIVERGENCE?
Divergence occurs when price makes a new high/low while momentum indicators move in the opposite direction. This signals weakening momentum and a potential reversal or correction.
WHY DOES DIVERGENCE WORK?
Divergence exposes momentum weakness before price actually reverses. It helps traders identify exhaustion early, improving accuracy and timing.
TWO MAIN TYPES OF DIVERGENCE
1.) WIDE DIVERGENCE
Price forms a large, extended swing while the indicator creates a smaller swing in the opposite direction. This signals strong exhaustion and is often followed by a bigger reversal.
2.) TIGHT DIVERGENCE
Price forms a small higher high or lower low while momentum moves opposite. This reflects micro-exhaustion and often appears before sharp pullbacks.
STEPS FOR WIDE DIVERGENCE
1.) Identify wide swings
Look for a clear extended higher high or lower low compared to recent structure.
2.) Check RSI moving in the opposite direction
This is the initial (unconfirmed) divergence.
3.) Draw a trendline + mark nearest support/resistance zone
These structural levels help filter weak signals.
4.) Wait for a break of both the trendline AND the S/R level
This confirms the divergence.
5.) Drop to a lower timeframe for entry
Use clean price action and break–retest structure to refine entry.
STEPS FOR TIGHT DIVERGENCE
1.) Identify small, shallow swings
Look for minor higher highs or lower lows forming weak structure.
2.) Check RSI moving in the opposite direction
This signals early momentum failure.
3.) Draw a trendline + nearest S/R level
Tight Divergence requires smaller structural zones.
4.) Wait for a break of both levels
A confirmed divergence requires a clean break.
5.) Drop to a lower timeframe for precise entry
Tight Divergence usually leads to fast corrective moves.
If you want PART 2, leave a like and a comment.
Follow for high-quality trading education and clean technical logic.
DISCLAIMER :
This post is for educational purposes only and does not constitute financial advice. Trading involves risk, and you should always conduct your own analysis. I am not responsible for any decisions or losses based on this content.

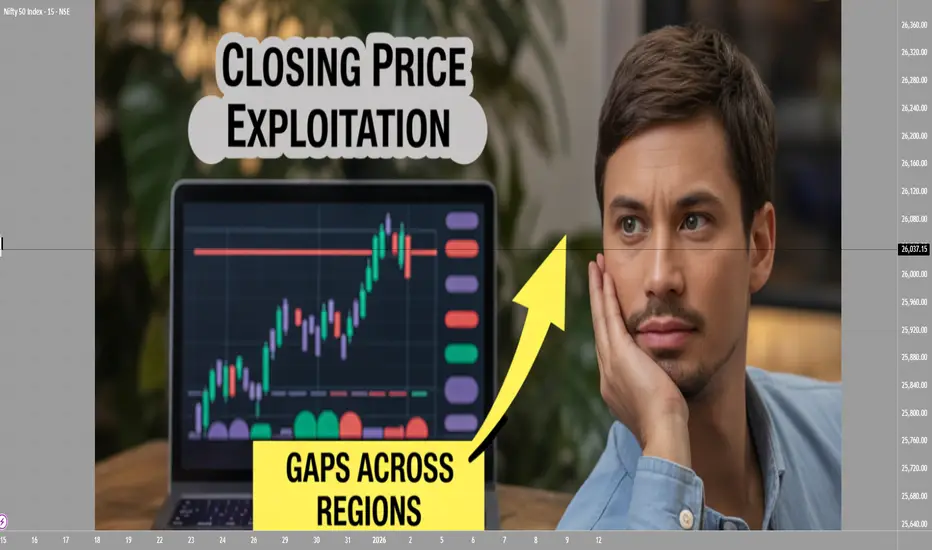
Closing Price Exploitation and Gaps Across Regions1. What Is Closing Price Exploitation?
Closing price exploitation refers to strategic actions taken by market participants—often large institutions, hedge funds, or algorithmic traders—to influence or take advantage of the closing price of a market. The closing price is a benchmark for:
Portfolio valuation
ETF/Index calculation
Mutual fund NAV
Margin requirements
Options settlement (for some markets)
Technical analysis (candles form based on closing price)
Because the closing price is so influential, it becomes a target for potential manipulation or strategic trading.
1.1 Why the Closing Price Matters
The closing price is considered the most important price of the trading day. It represents:
The final consensus of value
The point where liquidity peaks
A reference for next day’s sentiment
The price used by analysts and chartists
Any move near the close can change the market’s perception and technical structure.
1.2 How Exploitation Happens
Marking the Close
Large players place aggressive buy or sell orders in the last few minutes to push the closing price toward a desired level.
Example: A fund wants its quarterly report to show strong performance, so it pushes up prices of its holdings near the close (window dressing).
Exploiting Low Liquidity
In many markets, liquidity thins out near the close.
Even moderate orders can shift prices significantly.
High-frequency traders (HFTs) also exploit thinning order books to trigger stop-losses or manipulate closing auctions.
Taking Advantage of Index Rebalancing
Index funds must buy or sell assets at the close when weights change.
Smart money trades ahead of index funds, capturing profitable price moves.
Closing Auction Strategies
Some markets use auction mechanisms for the final trade.
Traders exploit mispricing during this auction by submitting large imbalance orders.
Influencing Options Expiry
In markets where options settle based on closing prices, aggressive buying/selling near expiry can shift settlement prices, generating profits on derivatives positions.
1.3 Who Performs Closing Price Exploitation
Hedge funds
HFT firms
Proprietary trading desks
Market makers
Large institutional investors
Retail traders rarely benefit from such strategies because they lack capital and execution speed.
2. Price Gaps Across Global Regions
Because different markets open and close at different times, prices across regions rarely move in a smooth, continuous way. Instead, they often show gaps caused by offshore developments.
2.1 What Is a Price Gap Across Regions?
A regional gap occurs when the price of an asset jumps or drops between the previous region’s close and the next region’s open due to:
Overnight news
Economic data releases
Commodity price moves
FX volatility
Geopolitical events
Market sentiment arising in other time zones
2.2 How Time Zones Create Gaps
Financial trading follows a global cycle:
Asia opens first (Japan, China, India)
Europe opens next (UK, Germany, France)
US opens last
When US markets close, Asia is still inactive. During the hours Asia is offline:
US equities move
Commodities like crude oil trade overnight
Bond yields react to news
Forex markets continue 24/5
When Asia opens again, prices adjust suddenly, creating a gap up or gap down.
2.3 Examples of Regional Gaps
US closes strong → Asia gaps up
If NASDAQ rallies 2% at night, markets like Nikkei, Hang Seng, or Nifty may open with a positive gap.
Europe experiences a crisis → US gaps down
Events like Brexit-related shocks caused large pre-market gaps in US indices.
Oil shocks → Middle East markets gap
Crude oil futures trade almost non-stop. Sudden spikes cause Gulf markets to open sharply higher.
US tech earnings → Global tech sector gaps
Apple, Google, or Tesla results released after US close impact Asia and Europe the next morning.
2.4 Categories of Gaps
Globally, gaps can be classified as:
Common gaps – small, frequent gaps due to routine overnight flow
Breakaway gaps – large gaps signaling trend reversals or breakouts
Runaway gaps – mid-trend, caused by strong momentum
Exhaustion gaps – appear at the end of strong moves, often reversing soon
Across regions, breakaway gaps and runaway gaps are more common because global news often triggers sharp repricing.
3. Why Gaps Occur More in Some Regions Than Others
Different exchanges have different characteristics:
3.1 Asia Has More Gaps
Because Asia reacts to both US and Europe overnight moves, Asian markets frequently open with big adjustments.
3.2 Europe Has Mid-Cycle Gaps
Europe reacts to Asia’s early moves and anticipates US market openings.
3.3 US Has Fewer Opening Gaps
Although US markets gap as well, they trade after-hours through futures, reducing the magnitude of opening shocks.
4. How Traders Exploit Price Gaps Globally
Professional traders use regional gaps as profitable opportunities.
4.1 Futures Arbitrage
Futures on indices (like Nifty, DAX, Nikkei, S&P 500) trade almost 24 hours.
When spot markets open with gaps, traders exploit:
Spot–futures discrepancy
Mispriced options
Imbalance in global cues
4.2 ADR vs. Local Stock Arbitrage
Many global companies have ADRs listed in the US.
Example: Tata Motors, Infosys, HDFC Bank.
ADR moves overnight in the US
Local shares in India gap up/down next morning
Arbitragers exploit the difference
4.3 Currency Influence
If INR/USD, EUR/USD, or JPY/USD moves sharply overnight:
Stocks sensitive to FX (IT, exporters) show gaps
Traders position for pre-market moves based on FX indicators
4.4 Commodities and Global ETFs
Gold, crude oil, natural gas, and global ETFs trade almost 24/7.
Their overnight fluctuations cause:
Gaps in commodity-dependent equities
Gap-up/gap-down opening in resource-heavy markets
5. Risks of Closing Price Exploitation and Global Gaps
Both phenomena introduce risks.
5.1 False Signals for Retail Traders
Closing price manipulation can make a stock appear bullish or bearish falsely.
5.2 Stop-Loss Hunting
Gaps can trigger stop-losses instantly at open, causing slippage.
5.3 Overreaction and Volatility
Markets may overreact to overnight news during open, leading to rapid reversals.
5.4 Liquidity Shock
Gaps often occur during low liquidity, amplifying price distortions.
6. How Traders Protect Themselves
Avoid placing tight stop-losses overnight
Track global futures (SGX GIFT Nifty, Dow Futures, DAX Futures)
Observe ADR movements
Watch commodity and FX trends
Monitor geopolitical calendars
Use options hedging (protective puts or strangles)
Conclusion
Closing price exploitation and regional gaps are inherent features of a globally interconnected financial system. The closing price is a key benchmark, making it vulnerable to strategic manipulation. Meanwhile, regional gaps arise naturally due to time zone differences and continuous global market flow.
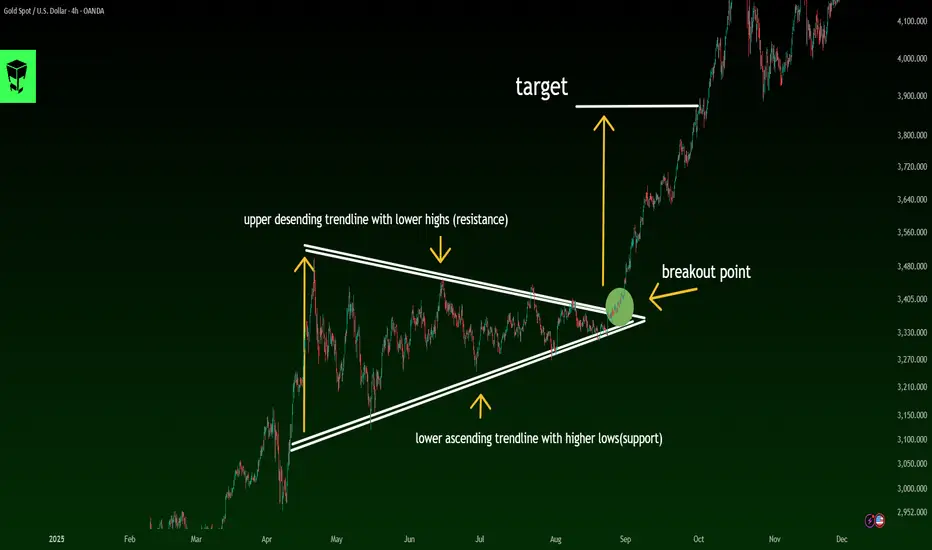
Learn This Pattern to Predict the Next Market Move🟩 What Is a Symmetrical Triangle?
A symmetrical triangle pattern is a continuation pattern that typically forms when the market enters a phase of consolidation and price compression.
In this pattern, price moves between two converging trendlines—one descending and one ascending.
Upper trendline: Lower Highs
Lower trendline: Higher Lows
These two lines converge toward each other, forming a balanced, center-aligned triangle.
🟨 Key Characteristics of a Symmetrical Triangle
✔️ Two converging trendlines (one sloping down, one sloping up)
✔️ Gradual decrease in trading volume
✔️ Price moves toward the apex of the triangle
✔️ Breakouts usually follow the prior trend
✔️ It is primarily a continuation pattern, though occasional reversals can happen
🟦 How to Identify a Symmetrical Triangle
To confirm a valid symmetrical triangle, check the following:
🔹 1. At least two touches on resistance and two on support
You must see lower highs and higher lows.
🔹 2. Both trendlines must slope inward
Unlike ascending or descending triangles, both lines are angled.
🔹 3. Price must contract toward the apex
Smaller swings = market compression.
🔹 4. Volume should gradually decline
Until the breakout occurs.
🟧 Professional Entry Strategies
📌 Method 1: Entering After the Breakout (Conservative Entry)
Wait for a candle to close outside the triangle
Volume should increase as confirmation
Stop-loss below the last swing or below the trendline
📌 Method 2: Entering After a Pullback (Low-Risk Entry)
Wait for a retest of the broken trendline
Use candlestick triggers (Pin Bar, Engulfing, Break & Retest)
Much smaller stop-loss + a better risk-to-reward ratio
📌 Method 3: Volume + Breakout + Positioning
For advanced traders, Volume Spread Analysis (VSA) is the strongest confirmation tool for breakouts.
🔶 Setting Take-Profit Targets
Standard Method:
📐 Target = Height of the triangle base
(measured from the widest part of the pattern)
Professional methods:
✔️ Target 1: Market Structure
Based on supply/demand zones
✔️ Target 2: Fibonacci Extensions
1.618 is often the most reliable target
✔️ Target 3: Multi-Timeframe Alignment
Check breakout levels in higher timeframes for added confidence
🔶 Fake Breakouts in Symmetrical Triangles
Fake breakouts are extremely common in this pattern.
Signs of a fake breakout:
❌ Low volume
❌ Long-wick candles
❌ Quick rejection back into the triangle
❌ Breakout occurs too close to the apex
❌ Lack of momentum
Fake breakouts often lead to a strong move in the opposite direction.
🔶 Pattern Behavior in Different Market Conditions
🟢 In an uptrend:
80% of the time it breaks upward → continuation
🔴 In a downtrend:
About 65% of the time it breaks downward → continuation
⚪️ In a ranging market:
Direction of breakout is uncertain → extra caution required
🔶 Common Mistakes Traders Make
🚫 Entering before the breakout
🚫 Confusing the pattern with ascending/descending triangles
🚫 Trusting breakouts without volume confirmation
🚫 Setting stops too close
🚫 Ignoring market psychology and momentum
🔷 Final Professional Summary
A symmetrical triangle indicates:
The market is in a compression phase
Lower Highs + Higher Lows
Price is preparing for a strong explosive move
Breakouts usually follow the prior trend
Valid breakouts require volume + candle close outside
Targets follow the triangle height or Fibonacci extensions
Fake breakouts are common → caution is essential
How to Start Trading with Technical Analysis (Beginner Guide)How to Start Trading with Technical Analysis (Beginner’s Guide)
--
Why you must understand support and resistance before you trade
Before we place a single trade in crypto or stocks, we need to understand support and resistance. At the core, this comes down to the basic law of supply and demand.
Price doesn’t pause or bounce at certain levels by accident. It happens because those levels are where people who want to buy (demand) and people who want to sell (supply) collide in size. Areas where buyers consistently win tend to form support, while zones where sellers keep overwhelming buyers turn into resistance.
In a 24/7, highly volatile market like crypto, these support and resistance zones become reference points we can rely on in the middle of chaotic price swings. You’re not just drawing a few lines on a chart you’re asking,
“ How have market participants reacted around this price in the past? ”
Reading support and resistance is essentially reading the footprints of supply, demand, and crowd psychology on the chart. That’s why understanding these levels is one of the very first skills you need to build if you want to trade crypto or stocks with any consistency.
--
Support and resistance are not just lines you draw wherever the price has “touched a lot,” like in the typical examples you see on charts.
Why not?
If you look closely at past price action, the zones where support or resistance keeps showing up are always places where someone’s interests are heavily involved.
Some participants have accumulated a large position around that price and need to defend their average entry.
Others want to quietly accumulate in that area over time.
→ So when price comes back down, buy orders step in around that zone and a support level forms.
On the flip side:
Some traders see a certain area as “a good place to unload” and wait there with sell orders,
And traders who are stuck from buying near the top are often eager to get out at breakeven or with a small loss when price revisits that zone.
→ As a result, resistance forms there, and it becomes harder for price to push higher.
That explains why certain zones have acted as support or resistance in the past.
But the next question we must ask is:
“ Are support and resistance levels from 1–2 years ago still valid today? ”
Why is that such an important question?
Because a chart doesn’t only have a price axis (Y) — it also has a time axis (X).
As time passes:
The players who were defending that level may have closed or reduced their positions,
The overall mix of market participants may have changed completely,
And price may have broken above, below, and through that level many times,
gradually diluting its significance compared to the past.
That’s why support and resistance shouldn’t be drawn just as
“places where price touched a lot before,”
but rather as
“places where supply and demand are still likely to concentrate now.”
In other words, you’re not only asking “Where did price react?”
You’re also asking “Is there still a good reason for the market to care about this level today?”
--
So we need to adjust the way we define support and resistance.
Instead of just re-using levels where “price touched a lot in the past,”
we focus on zones where, after a strong rally or a sharp drop,
price makes its first strong pullback or bounce.
Why are these areas so important?
Because they are the zones where recent supply and demand have collided the most aggressively.
After a big move up, the first strong dip that gets bought up shows a price area where
buyers are still saying: “If price comes back here, I’m happy to buy aggressively.”
After a big move down, the first strong bounce shows a price area where
sellers are still saying: “If price comes back up here, I’m happy to sell into it.”
As we mentioned earlier, a chart doesn’t only have a price axis (Y) —
it also has a time axis (X).
That means, when we look at support and resistance, it’s more logical to focus on
“ the most recent levels where the market reacted strongly ”
rather than just
“ the oldest levels that were touched many times. ”
Old support levels, over time, can lose their power:
The players who used to defend that level may have already closed or reduced their positions,
The composition of market participants may have changed completely,
And repeated breaks above and below that level may have gradually diluted its importance.
In contrast, the most recent support and resistance zones:
Reflect the latest state of supply and demand, and
Show you where today’s traders are actually willing to buy and sell right now.
In other words, they are levels that are “more alive,”
because they incorporate both price and time.
That’s why, in real trading,
instead of clinging to very old levels, it’s far more useful to first mark
the zones where price made its first strong pullback or bounce after a major move.
Those are the areas that help you read current, active supply and demand,
and they tend to give you much more meaningful support and resistance in today’s market.
--
Of course, there are countless ways to analyze the market.
And as we just discussed, even “freshly formed” support and resistance levels don’t last forever.
At some point those levels will break, price will move into a new area, and it’s completely natural to update your chart with new support and resistance zones.
Even so, just by doing what you see in the image above – splitting the recent range based on the latest support and resistance –
you can already get a very intuitive sense of whether price is temporarily expensive or cheap.
We do this by using a Parallel Channel:
The upper half becomes the Premium Zone
The lower half becomes the Discount Zone
1. Premium vs Discount – training your eye to look at “location” first
Once you divide the range like this,
the very first thing you check when you open a chart is:
“ Where is price sitting right now? ”
If price is in the Premium Zone
→ It means that, relative to the recent box/trend, price is in a more expensive area.
→ In this zone, instead of blindly chasing new longs,
You might think about taking profits or scaling out of existing long positions, or
Look for mean-reversion shorts / corrective moves rather than fresh break-out longs.
If price is in the Discount Zone
→ It means that, within the same range, price is sitting in a cheaper area.
→ Here,
If the higher-timeframe trend is up, this is where you look for dip-buying / long entries, and
If you’re already short, this is where you start thinking about locking in profits or reducing risk.
In other words, the Premium/Discount split acts as a location filter that quickly answers:
“At this price area, does it make more sense to be looking for longs or for shorts?”
2. Learning to trade only from “good locations”
A common mistake for beginners is entering trades without any regard for location,
just reacting to a few candles.
Price is already near the top of the Premium Zone,
→ but a couple of green candles appear and FOMO kicks in → chase a long.
Price is already near the bottom of the Discount Zone,
→ but a few red candles print and fear kicks in → chase a short.
When you trade like this, your risk–reward structure is broken from the start.
Your stop can’t be tight, and your upside is limited because you’re trading in the worst part of the range.
If you first split the range with a parallel channel, the order of thinking changes:
Check location first,
Then look for entry signals (patterns, candles, FVG, structure shifts, etc.).
That tiny change in sequence turns
“pressing buttons anywhere” → into → “only fighting from good locations,”
and it massively upgrades the overall quality of your trades.
3. Looking at it again from a supply–demand perspective
From a more theoretical point of view:
Near the bottom of the Discount Zone,
the market has recently decided, “If price falls this low, it’s cheap.”
→ This is where demand (buy orders) is likely to show up again.
Near the top of the Premium Zone,
the market has treated that area as “expensive enough to take profits.”
→ This is where supply (sell orders) is likely to reappear.
So by splitting the range into Premium and Discount with a parallel channel,
you’re effectively seeing how recent supply and demand are tilted
without using any complicated indicator — just clean price action and location.
4. One-line summary
Treat support and resistance as zones , not thin lines.
Divide that zone with a parallel channel into Premium and Discount .
Decide on the favorable side first, and only then look for concrete entry and exit signals inside it.
Once you do this,
“ Which area is cheap today, and which area is expensive? ” becomes much clearer in your mind,
and you’ll naturally avoid taking random trades in the messy middle where your psychology and PnL both suffer.
--
Let’s say price is currently sitting in the Premium Zone,
but your RSI just flashed an “oversold” signal.
(Much later we’ll go deeper into indicators, so for now you can simply think of RSI as a tool that sometimes marks potential highs and lows on the chart.)
A lot of beginners see this and immediately think:
“RSI is oversold → price must be cheap → time to go long.”
But with our framework, this is actually a situation where
location and indicator are telling you two different stories.
Location view (Premium Zone)
→ “Within the recent range, this is an expensive area.
→ I should be more focused on taking profits, fading rallies, or waiting for a deeper discount,
not blindly chasing fresh longs.”
RSI view (oversold)
→ “Price has dropped sharply in the short term and might be due for a bounce.”
So an RSI oversold signal inside the Premium Zone often means:
“Price is having a short-term pullback within an expensive area,”
not
“This is a structurally cheap level where I should load up.”
In other words, it may simply be a dip in a larger down move or distribution area,
rather than a high-probability bottom.
By contrast:
RSI oversold near the bottom of the Discount Zone
= “Cheap area + oversold signal”
→ Much stronger candidate for a meaningful short-term low.
That’s why, in practice, it’s safer to:
Check location first (Premium or Discount),
Then look at oscillator signals like RSI, MACD, Stoch, etc. as secondary confirmation.
For now, just keep this rule of thumb in mind:
Only take indicator signals seriously when they line up with a good location.
That simple filter alone will help you avoid a lot of impulsive trades where
You buy high just because an indicator said “oversold,” or
Sell low just because it flashed “overbought.”
(We’ll cover RSI and other indicators in detail later, including
how to combine them with location to build much higher-quality entries and exits.)
--
In the end, what really matters is a simple question:
“Is price expensive here, or cheap here?”
Put differently:
Is this an area where sell supply is likely to show up,
or an area where buy demand is likely to step back in?
That’s the first thing you want to figure out.
If we boil down everything we’ve talked about so far into a few key points:
Treat support and resistance not as thin lines, but as zones where supply and demand have actually clashed .
Use those zones to carve out Premium (expensive) / Discount (cheap) areas.
Inside those areas, decide first where it makes sense to fight from (which side is favored: long or short),
And only then start paying attention to indicators, patterns, or candle signals.
Most people start their journey by asking,
“Which indicator is the best?”
“Which pattern has the highest win rate?”
But with just a bit of experience, you eventually arrive at the same conclusion:
“Where you enter (location)
matters more than what you enter with (signal).”
When you enter from a good location:
You can keep your stop loss tighter.
The same profit feels much easier to hold through.
Even if the trade loses, you can at least say, “I took the trade from a logical area,” which helps your psychology.
When you enter from a bad location:
No matter how “nice” the indicator looks, your stop tends to be wide,
A small move against you immediately stresses your mindset,
And even when the trade is in profit, it feels like you could get slapped the other way at any moment, so it’s hard to hold with conviction.
So here’s a simple practical checklist you can take into your own trading:
Find the most recent support and resistance zones where price reacted clearly and meaningfully.
From that structure, draw a Parallel Channel or box,
and split it into a Premium zone (upper half) and a Discount zone (lower half).
Check first: is price currently in the Premium side or the Discount side?
Only after that:
Look at oscillators like RSI, MACD, Stochastics,
And patterns, structure shifts, FVGs, candles, etc.
as secondary tools for entries and exits, not primary drivers.
Simply not chasing longs near the top of the Premium zone,
and not chasing shorts near the bottom of the Discount zone,
is enough to noticeably improve the quality of your trades.
At the end of the day, the chart is asking you something very basic:
“ At this price level,
based on the recent structure, is this
cheap enough that people want to buy,
or expensive enough that people want to sell? ”
If you can answer that question first,
then all the other tools that come afterward — RSI, MACD, FVGs, patterns, order blocks, ICT concepts, you name it —
become tools you use at meaningful locations , not random signals on a random chart.
If you can’t answer that question,
and you just keep adding more tools on top,
your trading usually becomes more complicated on the screen,
while your account and your mindset quietly get worn down in the background.
In the next parts, we’ll go into:
How to layer oscillators like RSI and Stochastics on top of this location framework, and
How to design actual entry, stop-loss, and take-profit plans using these ideas.
But before that, if you only take one thing away from this section, let it be this:
“Always ask first: is this area expensive or cheap?”
That one question alone
can dramatically upgrade the quality of the trade you’re about to take when you hit that buy or sell button.
--
If this was useful for your trading, consider giving it a Boost (🚀) and leaving a quick comment (💬).
That kind of interaction helps me know what’s working and motivates me to keep posting.
You’re welcome to follow so you don’t miss the next idea.
Swap Trading Secrets1. What Is a Swap?
A swap is a contract between two parties to exchange cash flows or financial obligations for a specified period. These exchanges typically involve interest rates, currencies, commodities, or credit risks.
Think of a swap like this:
You have one type of cash flow.
I have another.
We exchange them because each of us prefers the other’s structure.
This exchange helps both parties balance risk, stabilize cash flows, or lock in profits.
Swaps are custom-designed, traded over the counter (OTC), and not listed on exchanges.
2. Major Types of Swaps
To understand swap trading secrets, you first need to know the main types used globally:
1. Interest Rate Swaps (IRS)
Most common type.
Party A pays a fixed rate.
Party B pays a floating rate.
Useful for:
Hedging interest costs.
Managing debt efficiently.
2. Currency Swaps
Exchange principal + interest in different currencies.
Useful for:
Reducing currency risk.
Accessing foreign loans at cheaper rates.
3. Commodity Swaps
Fixed vs floating commodity prices.
Useful for:
Hedging input costs (oil, metals, agri).
Locking profit margins.
4. Credit Default Swaps (CDS)
Insurance against bond default.
Useful for:
Hedging credit risk.
Speculating on company survival.
5. Equity Swaps
Exchange equity returns for interest or another equity index.
Useful for:
Gaining exposure without owning the asset directly.
3. Why Swaps Are Considered a “Secret Weapon”
Swaps provide powerful advantages that many traders do not see:
A. Hidden Leverage
Institutions gain exposure to markets:
WITHOUT owning assets,
WITHOUT large upfront capital.
This makes swaps an efficient way to amplify returns.
B. Off-Balance-Sheet Benefits
Swaps can shift risks without moving assets on books, making financial statements look cleaner.
C. Customization
Unlike futures, swaps are tailor-made:
Amount
Duration
Payment structure
Asset type
Currency
This gives institutions almost unlimited flexibility.
D. Access to Better Pricing
Banks and hedge funds use swaps to:
Access lower foreign interest rates
Reduce borrowing costs
Hedge exposures cheaply
This pricing advantage is one of the biggest swap trading secrets.
E. Tax Optimization
Some institutions use swaps to:
Receive returns without triggering capital gains
Change income types for tax benefits
4. How Institutions Actually Use Swap Trading
Now let’s explore the real-world secrets of how swaps are used.
Secret 1: Hedging Interest Rate Risk Like a Pro
When interest rates rise or fall, companies with loans face huge cost changes.
So they use Interest Rate Swaps:
If expecting rates to rise → pay fixed, receive floating.
If expecting rates to fall → receive fixed, pay floating.
This stabilizes their cash flows.
Example:
A company with a floating-rate loan fears rising rates.
They enter a swap to pay 5% fixed and receive floating.
If floating rates shoot to 8%, the swap saves them millions.
Secret 2: Currency Swaps for Cheaper Global Loans
Corporations often borrow in foreign currencies.
But banks offer different interest rates in different countries.
So companies use currency swaps to borrow where rates are cheaper, then swap back to their local currency.
Example:
An Indian company might borrow yen at 1% instead of rupees at 7%, then swap obligations with a Japanese firm.
This cuts financing cost dramatically.
Secret 3: Equity Exposure Without Buying Shares
Hedge funds love equity swaps because they:
Get full market returns
Avoid ownership reporting
Avoid voting rights
Avoid taxes on buying/selling stocks
Can build secret positions
This is how some funds take huge equity bets without showing them publicly.
Secret 4: Commodity Swaps to Lock Prices Years Ahead
Airlines, manufacturers, and refiners use commodity swaps to stabilize costs.
Example:
An airline may fix jet fuel prices for three years through swaps, eliminating volatility.
This ensures consistent profit margins regardless of market swings.
Secret 5: Credit Default Swaps for Hidden Speculation
CDS contracts let traders “bet” on whether a company will default.
Professionals use CDS to:
Hedge corporate bond exposure
Take leveraged positions on credit quality
Profit from market panic or recovery
Some hedge funds made billions during the 2008 crisis via CDS trades.
5. Secret Trading Strategies Using Swaps
Let’s break down advanced strategies used in swap trading.
A. Swap Spread Trading
Traders exploit differences between:
Swap rates
Government bond yields
If swap spreads widen or narrow unexpectedly, traders enter opposite positions to profit from mean reversion.
B. Curve Steepening / Flattening Strategies
Traders use interest rate swaps to bet on the shape of the yield curve.
Steepener: receive fixed (long end), pay fixed (short end)
Flattener: opposite
These are used when expecting macroeconomic shifts.
C. Currency Basis Arbitrage
Banks exploit differences between:
Currency forward rates
Interest rate differentials
Swap rates
This arbitrage generates low-risk profits.
D. Synthetic Asset Exposure
Traders use swaps to create:
Synthetic bonds
Synthetic equity positions
Synthetic commodities
This avoids capital requirements and tax implications.
E. Hedged Carry Trades
Funds borrow in low-rate currencies and swap into higher-rate currencies while hedging currency risk.
This generates predictable “carry” income.
6. Key Risks in Swap Trading
Swaps are powerful, but they carry risks:
1. Counterparty Risk
If your swap partner defaults, you lose.
(This is what happened with Lehman Brothers.)
2. Liquidity Risk
Swaps cannot be easily sold like stocks.
3. Interest Rate / Market Risk
If the market moves against your swap position, you face large losses.
4. Valuation Complexity
Swaps require mark-to-market calculations.
5. Legal & Operational Risk
Documentation errors can cause disputes.
7. Why Retail Traders Rarely Use Swaps
Swaps require:
Large contracts
Institutional relationships
Legal agreements
Creditworthiness
Sophisticated pricing models
However, retail traders indirectly benefit through:
Mutual funds
ETFs
Banks
Derivative products
These institutions use swaps behind the scenes to improve performance.
Conclusion
Swap trading is one of the financial world’s most powerful, secretive, and flexible tools. Institutions use swaps to hedge risk, create leverage, optimize taxes, reduce financing costs, and structure sophisticated trading strategies across interest rates, currencies, commodities, and credit.
Even though retail traders rarely trade swaps directly, understanding them gives you insights into how the world’s largest financial players operate. If you understand swap dynamics, you gain a deeper understanding of global money flows, risk management, and institutional market behavior.
AMP Futures - How to set alerts for Volume footprint chartsIn this idea we will demonstrate how to set alerts with Volume footprint charts.

Fed Cuts Rates: Why This Could Ignite a Risk On RallyFed move and backdrop 📉➡️📈
The Fed just cut rates by 25 bps. Markets now have slightly easier policy but still “careful” Fed messaging.
Yield curve and small caps 🏦📊
Short‑term rates are lower, but longer‑term yields can stay higher because of how the Fed manages its bond portfolio. That steeper curve helps banks lend more and is usually good for small‑cap and cyclical stocks.
QT, QE and liquidity 💧
QT is ending, so the Fed is no longer shrinking its balance sheet. For crypto traders, that feels like “QE‑lite” because liquidity is no longer being drained from the system. Easier policy plus steady liquidity tends to support risk assets like tech and crypto.
ISM, Bitcoin and the cycle 🪙📈
The ISM production index is back above 50, which signals economic expansion. Bitcoin has often made big upside moves when ISM turns up and policy is easing.
What’s next for traders ⚔️
- Stocks: Better setup for small caps as banks can lend more and the curve steepens.
- Crypto: Macro is shifting to “risk‑on,” so Bitcoin and Ethereum could challenge or make new highs earlier than a strict four‑year cycle would suggest.

5 Must-Know Tips for Trading Gold. XAUUSD Must Know Secrets
After more than 9 years of Gold trading, I decided to reveal 5 essential trading tips , that will save you a lot of money, time and effort.
Of course, these trading recommendations won't make you rich, but they will certainly help you to avoid a lot of losing trades.
Whether you are new to Gold trading or an experienced trader, these insights will dramatically improve your trading.
Don't trade gold with a small account
I always repeat to my students that in gold trading, the risk per trade should not exceed 1% of a trading account.
It means that if your trades close with stop loss, you should lose maximum 1% of your deposit.
For the majority of the day trading and swing strategies, you will require at least 2000$ deposit to risk 1% per trade. Trading with a smaller account size, it will be challenging to follow this risk management principle of not exceeding 1%
Here is a day trade on Gold.
With a stop loss of 619 pips and a trading account of 10000$,
a lot size for this trade will be 0.02.
If the trade closes on stop loss, total risk will be 100$ or 1% of a trading account.
With a 100$ account, trading with a minimal lot 0.01, your potential risk will be 50$ or half of your trading account.
Check spreads
Spread may dramatically fluctuate on Gold.
High spreads can make it difficult for day traders to catch small price movements, reducing the profit potential of their trades.
Wide spreads can lead to slippage , where day traders may end up buying at a higher price and selling at a lower price than expected, increasing the risk of losses.
Gold has the lowest spreads during London and New York sessions,
while trading the Asian session is not recommended.
Personally, I don't trade Gold if the spread exceeds 100 pips.
In the picture above, you can see a current spread on Gold.
It is 30 pips. It is a relatively low spread, so we can trade.
Don't trade on US holidays
When US banks are closed, liquidity drops substantially on Gold.
It leads to increased spreads and higher probabilities of manipulations,
reduced volatility and very slow market.
For that reason, it is better not to trade Gold during US holidays.
You can easily find the calendar of US banking holidays on Google.
Simply take a break during these trading days.
Don't trade ahead of important US news
US news may dramatically affect Gold prices.
Such events as FOMC or FED Interest rate decision may trigger a high volatility and very impulsive movements.
My recommendations to you is to stay away from trading Gold one hour ahead of the important news releases.
You can find important US news in the economic calendar .
Just sort out the calendar in a way that it would display only significant news and pay attention to them.
Above, you can see the important US news for the coming days in the economic calendar.
Do not open multiple orders
Here is what many Gold traders do wrong:
once they place an order, instead of patiently waiting for a stop loss or take profit being reached, they start opening more orders.
Please, open one single trade per your prediction.
Open a new trade if only you see a new trading setup or your initial trade is already risk-free with a stop loss move to entry level.
Here is the example, a newbie trader decides to buy Gold and opens a long positions.
The market moves in the projected direction, and a trader opens one more trade.
The one can open even dozens of positions like that.
However, the problem is that the market can always suddenly reverse and all these trades will be closed in a loss.
It can lead to a substantial account drawdown.
Open a one single trading position instead.
I truly believe that these trading tips will help you improve your gold trading. Carefully embed these rules in your trading plan and watch how your trading performance improves.
❤️Please, support my work with like, thank you!❤️
I am part of Trade Nation's Influencer program and receive a monthly fee for using their TradingView charts in my analysis.

The Break-Even Syndrome: Why Profitable Trades Die Early“Many traders are right about direction…
but wrong about patience.”
A trade moves in your favor.
Not much. Just enough to breathe.
Your mind reacts before price does.
“Let me move stop to break-even.”
“Now it’s safe.”
But what feels like safety is often fear wearing discipline’s mask.
What Is the Break-Even Syndrome?
The break-even syndrome is the habit of moving stop loss to entry
not because the market confirms it —
but because the trader cannot tolerate the possibility of being wrong again.
It’s not risk management.
It’s emotional relief.
Why Traders Do This
• Recent losses create fear of giving back profits
• Ego wants to avoid another red trade
• The brain seeks comfort, not expectancy
• A small win feels better than another loss
So traders protect their feelings
instead of protecting their edge.
How Break-Even Kills Good Trades
Markets breathe.
Pullbacks are normal.
Structure requires space.
By moving to break-even too early:
• You exit before the real move begins
• You train yourself to fear normal retracements
• You destroy positive expectancy
• You stay “safe” but never grow the account
Break-even doesn’t reduce risk.
It reduces potential.
When Break-Even Makes Sense
Break-even is valid only when:
• Structure has shifted clearly
• Liquidity is cleared in your favor
• Partial profits are secured
• The market has earned protection
Otherwise, break-even is premature.
The Deeper Issue
The real problem isn’t the stop.
It’s trust.
Trust in your analysis.
Trust in probability.
Trust that not every trade needs saving.
You don’t need to protect every trade.
You need to let your edge play out.
📘 Shared by @ChartIsMirror
Do you move to break-even because the market told you to…
or because fear did?
