Trading Rejection Strategy- A Visual Backtest💡 Overview
Here is everything you need to know about the strategy. But before you study it any further, all the visuals are at the end of this post- so don't miss that part.
This setup is built upon simple beliefs:
▶Price always remembers its key levels- Previous Day’s High (PDH), Previous Day’s Low (PDL)
▶Strong support/resistance zones often act as liquidity magnets.
▶When price revisits these areas and fails to break through, it gives us a clear rejection and that’s where the edge lies.
⚙️ Core Conditions
➡Price rejects PDH or PDL
➡Price retests a breakout / breakdown zone
➡Price rejects a tested support / resistance level
➡Timeframe: 15-Minute
➡Type of trade: Intraday only
➡Only one trade per day
🎯 Trade Plan
🔘Entry: One tick above/below the Pin Bar or reversal candle close
🔘Stop Loss: Just beyond the high/low of the rejection candle
🔘Target: Next liquidity zone (recent 15m swing or PDH/PDL)
🚫 Avoid Trading When:
➡No rejection at liquidity levels
➡Risk > 20 points
📊 October Backtest Results
(1 trade per day, tested manually)
Total trades taken= 14
Winners= 6
Losers= 8
Total points made out of winner= 263
Total points lost in losers= 75
Net points made= 188
🧠 Takeaway
Even though the backtest covers only October, the results are encouraging.
The logic is built on price behavior around institutional levels, and that tends to hold steady across time.
📈 Try extending the backtest further:
If results remain consistent, this could become a reliable rejection-based intraday setup worth adding to your toolkit.
Here is a visual to guide to all the Entries, Exits and about how it went.
Enjoy the charts and do let me know what you think about this strategy or if I missed an opportunity ;)
📣Disclaimer:
Everything shared here is meant for education and general awareness only. It’s not financial advice, nor a recommendation to buy, sell, or hold any asset. Do your own research, manage your risk, and make sure you understand what you’re getting into.
Supportandresistancezones
Support and Resistance VS Supply and Demand Explained
In the today's post, I will compare support and resistance levels with supply and demand zones.
I will explain to you the difference between them and share important tips and examples.
What are support and resistance levels?
We also call them key levels. These are particular levels on a price chart from where in the past we saw significant bullish or bearish movements.
Key support will be a one single level, that has a historical significance and from where a bullish reaction will be anticipated.
The all-time low on USDCHF will be a perfect example of a key support.
It is one single level that was respected one time in the past and from where a bullish reversal initiated.
Key resistance will be a one single level on a price chart that has a historical significance and from where a bearish movement will be expected.
The all-time high on Gold will represent a key horizontal resistance.
That level was respected one time in the past and from that level exactly the market dropped heavily.
What are supply and demand zones?
In comparison to support and resistance levels, supply and demand zones are the areas on a price chart. The zones that are based on multiple touches and consequent strong bullish or bearish reactions.
Demand zone will be the area that was tested at least 2 times in the past, and the price should strictly respect different price levels within that area.
A similar reaction will be anticipated from the demand zone in the future.
The yellow area above will a good example of a demand zone.
You can see that the price tested that area 3 times, and each time the market respected different levels lying within that.
These 3 tests compose the demand area.
Supply zone will be the area that was tested at least 2 times in the past and the price should strictly respect different price levels within that area.
A similar reaction will be anticipated from the demand zone in the future.
In this example, a supply area on EURUSD is based on 2 touches of key levels, lying very close to each other.
On the chart above, I underlined 2 horizontal support levels - the single levels that were respected by the market multiple times, and a supply zone - the area that is based on tests of multiple levels lying close to each other.
Support and resistance levels give you SINGLE levels from where you can look for trading opportunities. While supply and demand zones represent the areas . After a test of a supply and demand zone, the market may react to a RANDOM level within that.
For newbie traders, it is highly recommendable to trade single key levels, while experienced traders can broaden their strategies and trade supply and demand zones as well.
❤️Please, support my work with like, thank you!❤️
I am part of Trade Nation's Influencer program and receive a monthly fee for using their TradingView charts in my analysis.

Stacking logarithmic (log) channels - Secret tool in crypto Ep 3Stacking Logarithmic Channels - Bitcoin's Hidden Fractal Structure | Signal & Structure Episode 3
In this third episode of Signal and Structure, we explore a powerful but little-known technique: stacking logarithmic channels to identify critical support and resistance levels in exponentially growing assets like Bitcoin.
Core Technique Revealed:
The Logarithmic Channel Stacking Method
Start with a base channel on log scale (demonstrated from November 2011)
Copy and stack identical channels above/below the original
The midline of one channel becomes the boundary of adjacent channels
Creates a fractal structure that respects Bitcoin's exponential growth pattern
Key Principles:
Always use logarithmic scale for crypto channels
Midlines are as important as channel boundaries
Multiple touches validate channel placement
Channels maintain proportional relationships when stacked
Practical Demonstrations:
Historical Validation Points
November 2013: Top of first channel ($1,200)
December 2017: Top of second stacked channel ($19,000)
November 2021: Bottom of third stacked channel ($69,000)
March 2023: Bottom of fourth stacked channel ($15,500)
Current Market Analysis:
Bitcoin dancing around the midline of the current channel
Lower boundary support around $90-92K (aligning with CME gap)
Technical ceiling projections discussed with appropriate caveats
Channel Construction Details:
Monthly channels: Black, thickness 4, 30% opacity
Weekly channels: Maroon/brown, thickness 3
Always include midlines for additional confluence
Adjust opacity to prevent chart clutter
Advanced Insights:
Why log scale channels reveal patterns invisible on linear scale
How to validate channels using midline touches
The relationship between channel midlines and new channel boundaries
Dealing with ambiguous channel placement (multiple valid options)
Time-Saving Tips:
Use TradingView's copy/paste to maintain exact channel angles
Set consistent color coding for different timeframes
Keep channels semi-transparent for better visibility
This technique works because logarithmic scale represents percentage moves consistently - a 100% move always appears the same height regardless of price level. This creates natural harmonic levels that price tends to respect over long timeframes.
While specific price projections should be taken as possibilities rather than certainties, the method itself provides a robust framework for understanding Bitcoin's price structure across its entire history. The convergence of these channel levels with other technical factors (like CME gaps) adds additional weight to these zones.
Remember: Channels are guides, not guarantees. Use them for context and confluence, not as standalone trading signals.

Master Horizontal Lines on Trading Charts | Signal & Structure 2In this second episode of the Signal and Structure series, we dive deep into one of the most fundamental yet powerful tools in technical analysis - horizontal support and resistance lines. This practical tutorial demonstrates a systematic approach to identifying and marking key price levels across multiple timeframes.
What You'll Learn:
Color-Coded Line System for Multiple Timeframes:
Monthly (Black, thickness 4) - The strongest levels from monthly candle closes
Weekly (Maroon/Brown, thickness 3) - Key weekly support/resistance zones
2-Day (Red, thickness 2) - Intermediate term levels
12-Hour (Orange, thickness 1-2) - Short-term trading levels
3-Hour (Yellow, thickness 1) - Day trading reference points
Key Concepts Covered:
Why monthly candle closes often matter more than wicks (with live examples)
How previous resistance becomes new support - demonstrated on Bitcoin's chart
Identifying distribution and accumulation ranges using horizontal levels
The importance of avoiding chart clutter - when NOT to add more lines
Using transparent candles to see through to your levels and indicators
Practical Techniques:
Live demonstration on TradingView using Bitcoin/USD charts
How to identify the most significant levels from each timeframe
Creating "boxes" to visualize trading ranges and distribution zones
Brief introduction to Wyckoff theory concepts (spring patterns)
Tips for maintaining clarity when working with multiple overlapping levels
Chart Setup Tips:
Why exchange charts (KuCoin, Gate.io) provide better volume data than index charts
Continuing emphasis on logarithmic scale for crypto analysis
How to organize your workspace for multi-timeframe analysis
This 20-minute tutorial walks you through the exact process of building a professional-grade support and resistance framework on your charts. The presenter demonstrates each concept in real-time on TradingView, making it easy to follow along and implement these techniques immediately.
Perfect for traders who want to move beyond random line drawing and develop a systematic, color-coded approach to identifying key market levels. Whether you're scalping on the 3-hour or position trading on the monthly, this hierarchical system helps you see exactly where the important levels are at a glance.
Next episode preview: Diagonal trend lines, channels, and Fibonacci levels - including a unique approach to stacking channels that provides an edge in the markets.

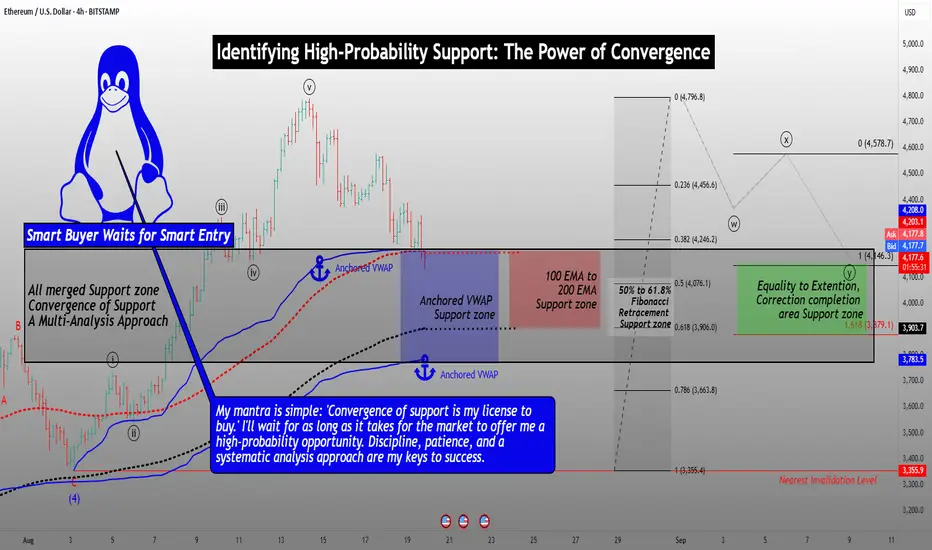
Identifying High-Probability Support: The Power of ConvergenceHello Friends,
Welcome to RK_Chaarts
Today we're going to learn Comprehensive Guide to Identifying Convergent Support Zones
Which are High Probability Support areas. This post is for Educational purpose only.
This detailed analysis will walk you through a step-by-step process of combining multiple technical analysis methods to identify a robust support zone. We'll explore how Elliott Wave theory, Anchored VWAP, EMA200, Fibonacci Retracements, and equality to extensions can coincidentally converge on the same support zone.
Step 1: Elliott Wave Analysis
Begin by identifying the Elliott Wave structure. Look for impulse waves, corrective waves, and the relationships between them. In this example:
- Wave Y is potentially completing near the equality zone (100% to 161.8% extension).
- This level marks a potential reversal point.
Support zone as per Elliott Wave theory Analysis
Step 2: Anchored VWAP Analysis
Apply Anchored VWAP to identify key support levels:
- Plot the VWAP from the last swing low and the second-last swing low.
- Note the convergence of these VWAP levels, which can indicate strong support.
Support zone as per Anchored VWAP Analysis
Step 3: EMA200 Analysis
Add the 200-period Exponential Moving Average (EMA) to your chart:
- The EMA200 has consistently provided support during previous corrections.
- Note the price approaching this level, increasing the likelihood of a bounce.
Support zone as per 200 Exponantial Moving Average
Step 4: Fibonacci Retracement Analysis
Apply Fibonacci retracements to the previous rally:
- Identify the 50%, 61.8%, and 78.6% retracement levels.
- Note the current fall has already exceeded the 38% retracement.
Support zone as per Fibonacci Retracement Analysis
Step 5: Convergence of Support Zones
Combine the analysis from each step:
- Note the striking convergence of support zones:
- Elliott Wave equality zone (100% to 161.8% extension)
- Anchored VWAP support zone
- EMA200 support level
- Fibonacci retracement zone (50%-61.8%)
Coincidentally all these are providing nearly same Support area (Price zone)
Trading Implications
With the convergence of these multiple analysis methods, you can:
- Identify a high-probability support zone.
- Look for buying opportunities near this zone.
- Monitor price action and market sentiment for confirmation of a reversal.
- Consider scaling into positions or setting limit orders within the support zone.
Important Note: Failure to Hold Support
If the price fails to hold support at this converged zone, it may indicate a stronger bearish trend. In this scenario:
- Be prepared for a potential significant downfall.
- Consider adjusting your trading plan to account for the increased bearish momentum.
- Keep a close eye on price action and market sentiment for further guidance.
By understanding the convergence of these multiple analysis methods and being aware of the potential risks, you'll be better equipped to make informed trading decisions and navigate the markets with confidence.
I am not Sebi registered analyst.
My studies are for educational purpose only.
Please Consult your financial advisor before trading or investing.
I am not responsible for any kinds of your profits and your losses.
Most investors treat trading as a hobby because they have a full-time job doing something else.
However, If you treat trading like a business, it will pay you like a business.
If you treat like a hobby, hobbies don't pay, they cost you...!
Hope this post is helpful to community
Thanks
RK💕
Disclaimer and Risk Warning.
The analysis and discussion provided on in.tradingview.com is intended for educational purposes only and should not be relied upon for trading decisions. RK_Chaarts is not an investment adviser and the information provided here should not be taken as professional investment advice. Before buying or selling any investments, securities, or precious metals, it is recommended that you conduct your own due diligence. RK_Chaarts does not share in your profits and will not take responsibility for any losses you may incur. So Please Consult your financial advisor before trading or investing.
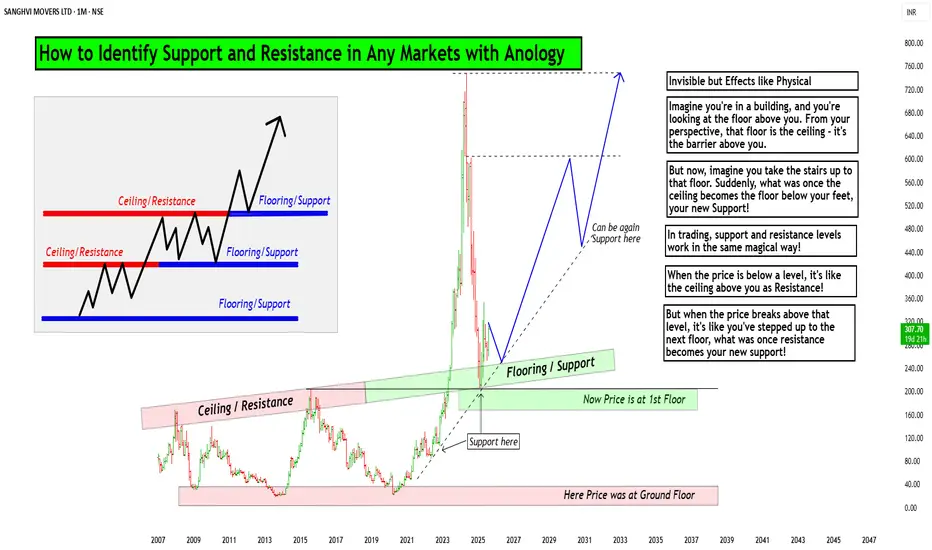
How to Identify Support and Resistance in Markets with AnologyHello Friends,
Welcome to RK_Chaarts,
Today we are going to learn & understand real work of Supports and Resistances in markets,
and Market structure with very good examples (Educational Post)
The Market's Architecture: Support and Resistance
This is an excellent analogy for understanding two of the most worthful concepts in technical analysis: support and resistance. By thinking of the market as a multi-story building, we can visualize how price moves and what happens when it hits certain levels.
- The Core Analogy: The Building and the Elevator
- Imagine the market as a large building with many floors. The price of an asset (like a stock or a cryptocurrency) is like an elevator moving up and down within this structure. The floors and ceilings of the building are not physical barriers but represent specific price points that the market has collectively agreed upon as important.
- The Floor (Support)
The floor of a building provides a solid base and prevents the elevator from falling further. In the market, this is called a support level. A support level is a price point where buying pressure is strong enough to stop the price from declining. When the "elevator" (price) reaches the floor, it finds enough buyers to give it a lift, preventing a deeper fall. A strong support level is like a thick concrete floor—it has been tested multiple times and holds firm, showing that there is significant demand for the asset at that price.
- The Ceiling (Resistance)
- The ceiling of a building sets the upper limit for the elevator's movement on a given floor. This is the market's resistance level. A resistance level is a price point where selling pressure is strong enough to prevent the price from rising further. When the "elevator" hits the ceiling, it encounters a large number of sellers who are ready to take profits, pushing the price back down. A strong resistance level is like a low ceiling—the price hits it and retreats, indicating that many investors believe the asset is overvalued at that point.
Breaking Through: New Levels
The most dynamic part of the analogy is what happens when the elevator breaks through a floor or ceiling.
Breakout (Breaking the Ceiling):
When the price has enough momentum to push through the resistance level (the ceiling), it has essentially moved to a new, higher floor. This is a significant event. The old ceiling, which was previously a barrier, now becomes the new floor. This is a key trading principle: old resistance often becomes new support. The market has established a new, higher trading range, and if the price falls back to that level, it will likely find buyers there, who now see it as a good value.
Breakdown (Breaking the Floor):
Once if price falls from that floor (Support level) which is called as Breakdown in technical language, then lower floor can be the next stop for elevator (Next Support for price), The old floor, which once provided support, now becomes a new ceiling. This is the reverse principle: old support often becomes new resistance. If the price tries to rally back up, it will likely get stuck at this old support level, as it's now seen as a good place to sell.
Structural Integrity (Volume)
Think of market Volume like a construction team. When a lot of people are involved (high volume), the structure is stronger.
Imagine a ceiling in the market. If lots of buyers (high volume) break through it, that's like a robust construction team building a new floor. It's unlikely to collapse.
On the other hand, if sellers break through a floor with high volume, that's a strong sign they're serious about the downward move.
But if the volume is low, it's like a weak construction team. Even if they break through, the move might not last. It's like a flimsy wall that could easily be reversed.
So, volume gives us a sense of whether the market's moves are strong and reliable, or weak and likely to change.
I am not Sebi registered analyst.
My studies are for educational purpose only.
Please Consult your financial advisor before trading or investing.
I am not responsible for any kinds of your profits and your losses.
Most investors treat trading as a hobby because they have a full-time job doing something else.
However, If you treat trading like a business, it will pay you like a business.
If you treat like a hobby, hobbies don't pay, they cost you...!
Hope this post is helpful to community
Thanks
RK💕
Disclaimer and Risk Warning.
The analysis and discussion provided on in.tradingview.com is intended for educational purposes only and should not be relied upon for trading decisions. RK_Chaarts is not an investment adviser and the information provided here should not be taken as professional investment advice. Before buying or selling any investments, securities, or precious metals, it is recommended that you conduct your own due diligence. RK_Chaarts does not share in your profits and will not take responsibility for any losses you may incur. So Please Consult your financial advisor before trading or investing.
Welcome Back! Gold Trading Strategy & Key Zones to WatchIn this week’s welcome back video, I’m breaking down my updated approach to XAU/USD and how I plan to tackle the Gold markets in the coming days. After taking a short break, I’m back with fresh eyes and refined focus.
We’ll review current market structure, identify key liquidity zones, and outline the scenarios I’m watching for potential entries. Whether you’re day trading or swing trading gold, this breakdown will help you frame your week with clarity and confidence.
📌 Covered in this video:
My refreshed trading mindset after a break
Key support/resistance and liquidity zones
Market structure insights and setup conditions
What I’ll personally avoid this week
The “trap zones” that might catch retail traders off guard
🧠 Let’s focus on process over profits — welcome back, and let’s get to work.

Buy Fear, Not Euphoria: The Trader's EdgeWhen you look back at the greatest trading opportunities in history, they all seem to share a common element: fear. Yet, when you're in the moment, it feels almost impossible to pull the trigger. Why? Because fear paralyzes, while euphoria seduces. If you want to truly evolve as a trader, you need to master this fundamental shift: buy fear, not euphoria.
Let's break it down together.
________________________________________
What Fear and Euphoria Really Mean in Markets
In simple terms, fear shows up when prices are falling sharply, when bad news dominates the headlines, and when people around you are saying "it's all over."
Euphoria, on the other hand, is everywhere when prices are skyrocketing, when everyone on social media is celebrating, and when it feels like "this can only go higher."
In those moments:
• Fear tells you to run away.
• Euphoria tells you to throw caution to the wind.
Both emotions are signals. But they are inverted signals. When fear is extreme, value appears. When euphoria is extreme, danger hides.
________________________________________
Why Buying Fear Works
Markets are pricing machines. They constantly adjust prices based on emotions, news, and expectations. When fear hits, selling pressure often goes beyond what is rational. People dump assets for emotional reasons, not fundamental ones.
Here’s why buying fear works:
• Overreaction: Bad news usually causes exaggerated moves.
• Liquidity Vacuums: Everyone sells, no one buys, creating sharp discounts.
• Reversion to Mean: Extreme moves tend to revert once emotions stabilize.
Buying into fear is not about being reckless. It’s about recognizing that the best deals are available when others are too scared to see them.
________________________________________
Why Chasing Euphoria Fails
At the peak of euphoria, risks are often invisible to the crowd. Valuations are stretched. Expectations are unrealistic. Everyone "knows" it's going higher — which ironically means there's no one left to buy.
Chasing euphoria often leads to:
• Buying high, selling low.
• Getting trapped at tops.
• Emotional regret and revenge trading.
You’re not just buying an asset — you're buying into a mass illusion.
________________________________________
How to Train Yourself to Buy Fear
It's not enough to "know" this. In the heat of the moment, you will still feel the fear. Here's how you build the right habit:
1. Pre-plan your entries: Before panic strikes, have a plan. Know where you want to buy.
2. Focus on strong assets: Not everything that falls is worth buying. Choose assets with strong fundamentals or clear technical setups.
3. Scale in: Don’t try to catch the bottom perfectly. Build positions gradually as fear peaks.
4. Use alerts, not emotions: Set price alerts. When they trigger, act mechanically.
5. Remember past patterns: Study previous fear-driven crashes. See how they recovered over time.
Trading is a game of memory. The more you internalize past patterns, the easier it is to act when everyone else panics.
________________________________________
A Recent Example: April 2025 Tariff Panic
Very recently, at the start of April, Trump’s new tariff announcements sent shockwaves through the market. Panic took over. Headlines screamed. Social media was flooded with fear.
But if you looked beyond the noise, charts like SP500 and US30 told a different story: the drops took price right into strong support zones.
At the time, I even posted this : support zones were being tested under emotional pressure.
If you had price alerts set and reacted mechanically, not emotionally , you could have bought into that fear — and potentially benefited from the rebound that followed just days later.
This is the essence of buying fear.
________________________________________
Final Thoughts
In trading, you are paid for doing the hard things. Buying when it feels terrible. Selling when it feels amazing.
Remember:
Fear offers you discounts. Euphoria offers you traps.
The next time the market feels like it's crashing, ask yourself:
• Is this fear real, or exaggerated?
• Is this an opportunity hiding under an emotional fog?
If you can answer that with clarity, you're already ahead of 90% of traders.
Stay rational. Stay prepared. And above all: buy fear, not euphoria.
Disclosure: I am part of Trade Nation's Influencer program and receive a monthly fee for using their TradingView charts in my analyses and educational articles.
Why Should You Care About ER?🚀 Hey Traders! Have You Ever Felt Lost in the Chaos of Market Fluctuations?
What if I told you there’s a powerful tool that can help you cut through the noise and give you a statistical edge to predict SUPPORT and RESISTANCE movements with confidence?
Let me take 5 minutes of your time to introduce you to something that could transform your trading game: Expected Range Volatility (ER) .
What is Expected Range Volatility (ER)?
The Expected Range (ER) is a framework that helps traders understand how much an asset is likely to move within a specific timeframe. Based on CME market data and Nobel Prize-winning calculations, price movements within the expected volatility corridor have a 68% probability of staying within those boundaries.
💡 Key Insight: When the price approaching certain levels, there’s a 68% chance the price won’t break through those boundaries. This means you can use ER as a powerful filter to identify more precise entry and exit points for your trades.
Why Should You Care About ER?
When I first discovered the ER tool, it felt like stumbling upon a gold mine in the trading world. Here’s why:
It’s free and available on the CME exchange’s website.
It’s underutilized —95% of traders don’t even know it exists.
It provides statistical clarity in a world full of uncertainty.
I remember the first time I used ER in my analysis—it completely changed the way I approached intraday trading. Now, I never make a trade without checking the ER data. It’s become an essential part of my strategy.
How to Use ER in Your Trading
1️⃣ Input the Data: Head over to the CME website, plug in the necessary parameters, and get your ER values.
2️⃣ Set Boundaries: Use the ER range as a guide to set potential support and resistance levels.
3️⃣ Filter Trades: Only take trades that align with the ER framework to improve your precision.
A recent example is the Japanese yen futures market.
Don't be confused by the fact that we take futures levels, it can easily be plotted on a spot chart for forex market (the dollar/yen).
Limitations to Keep in Mind
While ER is a powerful tool, it’s not a crystal ball. Here are some limitations:
Market Dynamics: Short-term price movements can be unpredictable due to sentiment, news, or economic events. ER provides a statistical estimate, but it doesn’t guarantee outcomes.
Assumptions: The formula assumes price movements follow a log-normal distribution , which may not hold true in all market conditions.
Your Turn: Are You Using ER in Your Strategy?
💭 Here’s the million-dollar question: Are you leveraging the power of Expected Range Volatility in your trading? If not, why not start today?
💬 Share your thoughts in the comments below:
Do you currently use ER or similar statistical tools?
Want to Dive Deeper?
If you’re ready to take your trading to the next level, don’t miss out on our all-in-one resource designed to help you master tools like ER and other valuable sources to gain market edge!
🔥 Remember:
No Valuable Data = No Edge!

Trading Smarter, Not Harder: Decoding Institutional MovesThere’s an old saying in trading: “Follow the smart money.” But how do you know where the smart money is going? The answer lies not in guesswork but in data—specifically, the kind of institutional-grade data that most retail traders overlook. If you’re serious about understanding market dynamics, it’s time to dive into the world of **COT (Commitment of Traders) reports** and **options flow data** from the **CME (Chicago Mercantile Exchange)**. These tools are like your personal radar, cutting through the noise to reveal what the big players are doing.
Step 1: Understanding the Big Picture – Why Market Sentiment Matters
Before we zoom into the specifics, let’s start with the basics. Markets are driven by sentiment—the collective mood of participants. When fear dominates, prices fall; when greed takes over, they rise. But here’s the catch: Retail traders often react to sentiment after it’s already priced in. By the time you see a headline screaming “Market Crashes!” or “Record Highs!”, the opportunity has likely passed.
This is where systematic analysis comes in. Instead of relying on emotions or lagging indicators, smart traders use raw data to anticipate shifts in sentiment. And two of the most powerful sources of this data are **COT reports** and **CME options flow**.
Step 2: The Commitment of Traders (COT) Report – Peering Into the Mind of Institutions
The **COT report**, published weekly by the Commodity Futures Trading Commission (CFTC), provides a breakdown of positions held by different types of traders: commercial hedgers, non-commercial speculators (like hedge funds), and small retail traders. Here’s why it’s invaluable:
- **Commercial Hedgers**: These are the “smart money” players—producers and consumers who use futures markets to hedge their risk. For example, a sugar producer might sell futures contracts to lock in prices. Their actions often signal future supply and demand trends.
- **Non-Commercial Speculators**: These are the momentum-driven players who bet on price movements. Tracking their positioning helps identify potential reversals.
- **Small Traders**: Often considered the “dumb money,” their positions frequently coincide with market tops or bottoms.
By systematically analyzing the COT report, you will discover your ability to identify patterns and positioning levels of participants that signal trend reversals or the onset of corrections. Seriously, this will blow your mind! The insights you gain will be so groundbreaking that they will change your trading game forever.
Step 3: Options Flow – Real-Time Insights Into Institutional Activity
While the COT report offers a macro view, **options flow** gives you real-time insights into institutional activity. Directly through CME data feeds, you can track large block trades in options markets. Here’s why this matters:
It will take some time, observation, and comparison with price charts to learn how to uncover insights that lead to trades with a risk-reward ratio of 1:10 or even higher. This isn’t about needing to make options trades; that’s not a requirement. It’s about being able to trade the Forex market much more effectively by using entry points highlighted by options and futures market reports.
For example, over the past few weeks, the USD/JPY pair has been in a downtrend. Long before this happened, major players were accumulating positions in call options on the futures for the yen (which is equivalent to a decline in the yen). We discussed this before the drop occurred (you can easily find those analyses on our page ).
What’s remarkable is that there are many such insights available. For certain instruments (like precious metals and currency pairs), these insights appear with a certain regularity and provide excellent sentiment for opening positions or reversing positions in the opposite direction.
Step 4: Connecting the Dots – From General Trends to Specific Trades
Now that we’ve covered the tools, let’s talk about how to apply them systematically. Imagine you’re analyzing the sugar futures market (a favorite among commodity traders):
1. **Check the COT Report**: In the precious metals market, commercials are often positioned short, hedging against the risk of a decline in the underlying asset's value. When their net position hovers around zero , it typically signals a bullish trend for gold prices in the vast majority of cases.
2. **Analyze Options Flow**: when filtering options by sentiment, there are several key factors to consider:
- Size and value of the option portfolio
- Distance from the central strike (Delta)
- Time to expiration
- Appearance on the rise/fall of the underlying asset
Option portfolios with names such as vertical spread, butterfly, and condor (iVERTICAL SPREAD, IRON FLY/FLY, CONDOR/IRON CONDOR) have predictive sentiment regarding the direction of the asset's price movement. While "naked" options (PUT or CALL options) with above-average volume can signal that the price is encountering a significant obstacle at that level, leading to a potential bounce off that level (support or resistance).
3 **Combine with Retail Positions Analysis**: Look for opportunities to trade against the crowd. If retail sentiment is overwhelmingly bullish, consider a bearish position, and vice versa.
This layered approach ensures you’re not just reacting to headlines but making informed decisions based on valuable data.
Step 5: Why Systematic Analysis Sets You Apart
Here’s the truth: Most traders fail because they rely on intuition rather than evidence. They chase tips, follow social media hype, or get swayed by emotional biases. But markets reward discipline and preparation. By mastering tools like COT reports and options flow, you gain a competitive edge—a deeper understanding market breath! The path of least resistance!
Remember, even seasoned professionals don’t predict every move correctly.However, having a reliable structure allows you to maximize profits from transactions, eliminate noise and unnecessary (questionable) transactions.
Final Thoughts: Your Path to Mastery
If there’s one takeaway from this article, let it be this: The best traders aren’t fortune-tellers; they’re detectives. They piece together clues from multiple sources to form a coherent picture of the market. Start with the big picture (COT reports), zoom into real-time activity (options flow), and then refine your strategy with technical analysis.
So next time you open chart, don’t just look at price. Dive into the reports/data before. Ask questions. Connect the dots. Because in the world of trading, knowledge truly is power.
What’s your experience with COT reports or options flow? Share your thoughts in the comments below—I’d love to hear how you incorporate these tools into your trading routine!
**P.S.** If you found this article helpful, consider bookmarking it for future reference.

8-Minute Guide to Trading Support & Resistance Feeling like you're guessing instead of trading? I've got you covered with this 8-minute crash course on finding support and resistance on TradingView. We'll look at where prices love to bounce back or break through, how to use that for your trades, and a quick trick to spot a real breakout.
Kris/Mindbloome Exchange
Trade What You See

Where & How to Draw Strong Support and Resistance Lines & Zones
In this article, I will teach you how to draw support and resistance.
We will discuss support and resistance lines, levels, zones.
You will learn where and how to find it properly with simply technical analysis technique that works on forex, gold or any other financial market.
First, let me note that the most reliable time frame for support and resistance analysis is the daily . The structures that you will find there will be appropriate for day trading, scalping and swing trading.
Once you open a daily time frame, you should choose a correct perspective . Because this t.f lets you see the price action even for the past couple of years.
You need to see the market movement for the last 2 months . It is more than enough to identify the recent key levels.
Above is AUDUSD on a daily. We see the price history for 2 months.
In order to identify significant supports and resistances, simply find the levels - the highs and lows that the market respected in the past and from where important movements started.
These are all such highs and lows that meet the criteria.
When I do the support/resistance analysis, I prefer to perceive it as clusters - the zones , taking into consideration the candle closes as well.
A support zone will be based on the level of the critical low and the lowest closest candle close.
A resistance zone will be based on the level of the high and
the highest closest candle close.
Following such a rule, here are the zones that I identified.
All the clusters that are identified will be applied as trading zones.
Within the supports, we look for buying opportunities.
While the resistances will be used for selling .
Depending on your trading style, and you choose a proper signal before you execute the trade.
Execute support and resistance analysis with care and attention, because it is the absolute basis of any technical analysis strategy.
With incorrect key levels identification, even the best trading strategy will fail .
I hope that the method that I showed you will help you in your trading journey.
❤️Please, support my work with like, thank you!❤️

10 Brutal Truths About Why Retail Support & Resistance Fail !CAPITALCOM:GOLD
10 Reasons Why Retail Support and Resistance Levels Fail: Unlocking Gann’s Secrets to Market Mastery
Here’s a deeply researched, professional explanation for each point, infused with Gann’s quotes, examples, and concepts, to open the eyes of traders to why retail methods often fail and how Gann's wisdom provides clarity.
1. Static Levels in a Dynamic Market -
Explanation: Retail traders often draw support and resistance (S/R) lines as static horizontal levels, expecting the market to repeatedly respect them. However, Gann emphasized the dynamic nature of markets, stating:
"Markets are never still; they are always moving, reflecting time and price interplay."
Markets are influenced by cycles, trends, and time frames, making S/R levels fluid rather than fixed. For instance, Gann’s Square of Nine shows how support and resistance rotate based on angles and time increments, offering precise levels that adapt dynamically. Retail traders fail to adjust their levels as time progresses, missing key changes in price behavior.
2. Failure to Incorporate Time -
Explanation: Retail S/R methods typically ignore the role of time, which is a critical element in Gann's work. Gann wrote:
"Time is the most important factor in determining market movements."
Support may fail not because the level was invalid but because the "time factor" for that level has expired. For example, in Gann’s Time Cycles, support at a certain price might hold only for a specific duration. When that time passes, the level loses its relevance. Retail traders, unaware of such timing principles, are often blindsided when the market breaks their "strong" levels.
3. Lack of Confluence with Angles -
Explanation: Gann’s methodologies prioritize the confluence of price and angle relationships. He believed that price moves in harmony with geometric angles, stating:
"When price meets time at an angle, a change is imminent."
Retail traders fail to consider these angular relationships, focusing only on flat horizontal lines. For example, a 45° angle from a significant low often acts as a true support, but retail traders, relying solely on previous price zones, miss these powerful turning points.
4. Overcrowding and Psychological Herding -
Explanation: S/R levels widely used by retail traders often attract a large number of orders at the same price zone, making them predictable and vulnerable to institutional manipulation. Gann noted:
"The crowd is often wrong, and the minority drives the market."
Institutions exploit this herding by triggering stop-losses just below support or above resistance, creating false breakouts. For instance, Gann’s "Law of Vibration" explains how markets seek equilibrium by disrupting imbalances created by crowd psychology.
5. Ignoring Volume Analysis
Explanation: Retail traders rarely integrate volume into their S/R analysis. Gann emphasized the importance of volume, stating:
"Price movements must be confirmed by volume to validate strength."
Support may appear to hold, but without accompanying volume, the level lacks significance. A practical Gann-based example would involve observing increased volume near a critical angle or price zone, signaling genuine strength or weakness at that level.
6. Using Recent Highs/Lows Without Context -
Explanation: Many retail traders base S/R levels on recent highs and lows, assuming these are universally strong zones. Gann criticized such oversimplified approaches, writing:
"The past governs the future, but only through proper analysis of cycles and patterns."
Without analyzing historical patterns and cycles, these levels are often superficial. For example, Gann's Master Charts reveal that true resistance may lie at a harmonic distance from an earlier historical pivot, not necessarily at the recent high.
7. Misunderstanding False Breakouts -
Explanation: Retail traders often misinterpret false breakouts as failures of support or resistance. Gann explained this phenomenon through his price and time squares, stating:
"A breakout without harmony is often a trap, designed to mislead the majority."
For instance, a false breakout above resistance might align with a Gann angle signaling a reversal, confusing those relying solely on retail S/R levels.
8. Ignoring Market Structure and Trend -
Explanation: Retail traders often focus on S/R levels without understanding the broader market structure or trend. Gann believed:
"The trend is your friend until time signals the end."
Support is more likely to hold in an uptrend, while resistance is stronger in a downtrend. A classic Gann principle involves combining market structure with angular analysis to determine whether S/R levels will hold or break.
9. Failure to Account for Gann's Price Harmonies -
Explanation: Gann’s studies reveal that price moves in harmonic relationships, often tied to Fibonacci ratios and geometric principles. Retail traders using arbitrary S/R levels fail to respect these harmonies. For example, Gann's observation of price doubling or halving (e.g., $50 to $100) often defines true support or resistance.
10. Reliance on One-Timeframe Analysis -
Explanation:
Retail traders frequently analyze S/R on a single timeframe, missing the interplay between multiple timeframes. Gann emphasized multi-timeframe alignment, writing:
"The major trend governs the minor trend, and the minor trend refines the major."
Support on an hourly chart may fail if it conflicts with resistance on a daily chart. Gann’s multi-timeframe methods ensure alignment, reducing the likelihood of failure.
Updated Closing Thought-
By understanding the reasons why retail support and resistance often fail and incorporating Gann’s time-tested principles, traders can elevate their skills to a professional level. Gann's focus on time, price, and geometry provides a roadmap to understanding the market with unparalleled precision.
This content is invaluable for anyone seeking trading mastery, so don't keep it to yourself! Save this and share it with your friends so they can benefit too. Follow for more absolutely valuable and free trading insights!

A Risk Tolerance Test for All TradersRisk Tolerance trips up more traders than any other emotional aspect of trading stocks, or any other asset class. How is your risk tolerance? Would you say that you have a good stable risk tolerance? Or is it the main reason you take small gains or losses?
If you need help evaluating your risk tolerance, take this Risk Tolerance Test . If any of these apply, then there is a problem you need to address:
Do you get stopped out of trades and then watch as the stock moves up? This is caused by setting stops too tightly for the kind of trading style being used.
Do you panic as the stock retraces and lower the stop loss to avoid getting stopped out? This actually increases risk rather than lowering it.
Do you raise your stop loss before the stock forms a new consolidation for support? This also increases risk rather than lessening it. There is higher risk that you will get stopped out prematurely.
Do you check profit or loss everyday on your held stocks? Position traders should only be checking their balance once a month. Swing traders could wait for the end of the month but can do it weekly.
Are you a swing trader who checks your positions intraday to see what is happening? This runs the risk of reacting prematurely to intraday volatility that eventually evens out.
Have you given up on using stop losses because "they don't work"? You probably just need to learn a better method for placing stop losses.
Do you hold and hold with no stop loss, watching a stock tumble, unable to exit and ultimately exiting too late or "holding long term" instead? This is a chronic problem among retail traders that indicates the lack of a complete trading plan, one that provides a plan for when your holdings go against your intent.
To keep your risk tolerance in check try adding these simple steps to your trade analysis:
Carefully check the Risk to Reward ratio of your picks, and only trade stocks with a good probability for profit vs. loss.
Consider the amount of money at risk in each trade. Think about how you would feel if you lost that money should the trade go against you. Add this parameter to your trading rules.
Lower overall market risk by trading more than one or two stocks at a time. Spread your capital outlay over a few picks rather than putting it all on one trade.
Use stop losses on every trade. Place stops under the appropriate support levels for the chart patterns and your intent.
If you are a Swing Trader, it is important to enter trades only on strong market days. Not every flat day is a good day to swing trade. You'll keep more of your profits over time if you wait for ideal days and picks.
The simplest way to improve risk tolerance is to continually paper trade on a Simulator even after you've started trading live. Most beginners do not practice executing their trading plan sufficiently before jumping into the market. They allow emotion to cloud better judgment and let greed overwhelm decisions. Trading is the only business where normally calm, intelligent, and wise people do really greedy things that end up being foolish and risky. And it all comes down to the emotions that come with money, especially fear, greed and pride.
Traders have one thing to compete against and that is their own emotions, which can cause poor decisions. My best advice for all traders is this: compete against your own prior trading history to improve results, and ignore what is going on with everyone else.
Summary:
Emotional control comes from having a sound plan, sticking with it, and not changing it because the market has moved on a whim or some guy on social just made a lot of money. Create your trading style, which is a plan of attack for the market. Set out your strategies and use the correct ones for the current Market Condition. Only trade stocks that have a risk factor you can live with. Use stop losses appropriately, and you will be successful. Problems occur somewhere in all of this, when traders miss a step and deviate from the plan.
When you feel emotions getting out of hand, controlling your trading decisions, consider the above checklists for help evaluating and adjusting your mindset. Greed is a tough emotion to control, because it is insidious and hard to identify in ourselves. Fear is easy to identify and much easier to control or harness. A certain amount of fear is necessary and good in the market, because it keeps individuals from taking too much risk. However, fear that dominates daily emotional energy only creates constant losses. Think about this and study prior trades. If they performed well after being stopped out, then there is a risk problem to address in your trading plan.

Mastering Support and Resistance: An Essential Tools for SuccessSupport and resistance are cornerstone principles in trading, offering crucial insights into price dynamics and market behavior. These levels act as key indicators, signaling points where an asset's price is likely to either pause or reverse direction. Support refers to the price level where strong demand prevents further declines, while resistance marks the point where selling pressure halts a price rise. Understanding and effectively utilizing these concepts can make a significant difference in trading success.
In the realm of technical analysis, which focuses on using historical market data to predict future price movements, understanding support and resistance is essential. Traders rely on these levels to pinpoint optimal trade entry and exit points while also managing risk effectively. By recognizing where the market may reverse or maintain its trajectory, traders can craft more robust strategies.
Decoding Support and Resistance Levels
Support and resistance levels are vital price points on a chart that traders use to forecast future market behavior. Support represents a level where a downtrend is likely to pause, driven by a concentration of buying interest. In other words, it's the price point where demand is strong enough to stop further declines. For instance, if a stock repeatedly drops to $100 and then bounces back, $100 becomes a recognized support level.
On the flip side, resistance is the price level where an uptrend often halts due to a high volume of sellers. Unlike support, resistance is where selling pressure overpowers buying interest, preventing prices from climbing further. If a stock consistently hits $150 and then retreats, $150 serves as a resistance level.
Example Support and Resistance on Silver
These levels are significant because they represent psychological thresholds for market participants. When prices approach support, buyers may step in, seeing it as a good entry point. Conversely, when prices near resistance, sellers might take action, expecting the price to struggle moving higher. Understanding how these levels work helps traders refine their timing and make more informed decisions.
The Impact of Support and Resistance in Technical Analysis
Support and resistance are pivotal in technical analysis, guiding traders in interpreting market movements and predicting future price trends. These levels act as psychological barriers that help determine whether a price trend will persist or reverse.
For example, if a stock repeatedly approaches a resistance level but fails to break through, traders may interpret this as strong selling pressure and consider selling or shorting the asset. Conversely, if a price consistently rebounds off a support level, traders might see it as a buying opportunity.
Example Resistance and Support on Apple Stock
Visual tools like charts and diagrams are indispensable for identifying support and resistance levels. By drawing horizontal lines at points where the price has historically reversed, traders can easily spot critical levels and predict potential market movements. These visual aids enhance decision-making by providing a clear picture of where key price barriers lie.
The Crucial Role of Support and Resistance Levels in Trading Strategies
Support and resistance levels are the foundation of successful trading strategies, offering traders the tools to optimize entry and exit points, maximize profits, and manage risks effectively.
For example, when a price hovers near a support level, a trader might take a long position, anticipating a rise in value. Simultaneously, they could place a Stop Loss just below the support level to limit potential losses if the price unexpectedly drops. Similarly, resistance levels provide invaluable insights for deciding when to exit trades or set profit targets. If a price approaches resistance, it might be wise to close a position to secure gains or prepare for a possible reversal.
Understanding and identifying support and resistance levels also play a vital role in risk management. Setting Stop Loss orders near these levels helps traders protect their capital from significant losses if the market turns against them. This disciplined approach not only enhances profitability but also promotes long-term success in trading.
Different Forms of Support and Resistance
Support and resistance levels come in various forms, each providing unique perspectives on market behavior. The most common types include horizontal levels, trendlines, and moving averages.
--Horizontal Support and Resistance: These levels are drawn at points where the price has consistently reversed in the past, making them straightforward and widely recognized.
Horizontal Resistance on Tesla Stock
--Trendline Support and Resistance: Trendlines connect a series of higher lows in an uptrend or lower highs in a downtrend, acting as dynamic support and resistance. In an uptrend, the trendline can signal buying opportunities, while in a downtrend, it might serve as resistance.
Trendline Support on EUR/USD
--Moving Averages: Moving averages, such as the 50-day or 200-day average, often act as support or resistance. For instance, during an uptrend, a pullback to the 50-day moving average can indicate a buying opportunity.
Moving Averages Used as Support and Resistance on USD/CAD
How to Identify Key Support and Resistance Levels
To identify strong support and resistance levels, traders use several strategies:
--Spot Price Clusters: Look for areas where the price consistently reverses direction, signaling strong support or resistance zones.
--Use Technical Indicators: Tools like Fibonacci retracements help identify potential reversal levels during pullbacks by dividing a price move into key percentages (38.2%, 50%, and 61.8%).
Fibonacci Tool used as Support and Resistance areas on DXY
Common Pitfalls When Using Support and Resistance in Trading
While support and resistance are essential, there are common mistakes traders should avoid:
--Over-Reliance on Exact Numbers: Support and resistance are better viewed as zones rather than exact values. Prices may fluctuate slightly above or below these levels before reversing.
--Ignoring Confirmation Signals: Jumping into trades without confirmation can lead to losses. Always look for signs like candlestick patterns or increased volume to confirm that the level will hold.
--Chasing Breakouts Too Hastily: Not all breakouts result in sustained trends. Waiting for confirmation, such as increased volume, helps avoid being caught in a false breakout.
--Impatience: Many traders act prematurely at support or resistance levels. Patience is key—stick to your trading plan and wait for the right setup.
Advanced Strategies for Support and Resistance Trading
For more experienced traders, support and resistance levels can serve as the basis for advanced strategies:
--Breakouts: A breakout occurs when the price moves above resistance or below support, often signaling the start of a new trend. Confirming breakouts with increased volume helps reduce the risk of false signals.
Breakout Confirmation on BTC
--Fakeouts: Prices may temporarily breach support or resistance before reversing direction. Advanced traders capitalize on these by waiting for the price to return within the range and then taking positions in the opposite direction.
Fakeouts on BTC
--Reversals: Traders use reversal strategies when the price changes direction after hitting support or resistance, often signaling the start of a new trend.
Area $72000 resistance used as reversal on BTC
Conclusion
Mastering support and resistance levels is vital for any trader aiming for long-term success. These concepts are the backbone of technical analysis, guiding traders in making informed decisions about when to enter, exit, and manage risks. By understanding and identifying key support and resistance zones, traders can predict price movements, spot opportunities, and refine their strategies.
Incorporating technical analysis into your trading routine will boost your confidence in navigating the market. Whether you’re a beginner or a seasoned trader, honing your skills with support and resistance can lead to more disciplined and profitable trading.

A+ Trade Set ups All From Respecting Simple Levels! We identify high-quality trade opportunities by focusing on key support and resistance levels. By respecting these fundamental price points, traders can enhance their decision-making process. Support levels act as a floor where buying interest tends to emerge, while resistance levels serve as a ceiling where selling pressure usually mounts. Recognizing and adhering to these simple levels helps traders pinpoint entry and exit points more effectively, increasing the probability of successful trades and improving overall trading performance.
AMEX:SPY

75: Comprehensive Guide to Volume Profiles and Volume in TradingWhat is a Volume Profile?
A Volume Profile is an advanced charting tool that plots the amount of trading activity (volume) across different price levels over a specific period. Unlike traditional volume indicators that only show volume over time, Volume Profiles provide insights into where the majority of trading took place, highlighting key areas of support and resistance, as well as zones of high and low interest among traders.
Key Components of Volume Profiles:
1. Point of Control (POC) : This is the price level where the highest volume of trades occurred. The POC is a crucial level because it represents the price at which traders found the most value, making it a strong indicator of support or resistance.
2. Value Area (VA) : The Value Area represents the range of prices where approximately 70% of the volume was traded. This area is divided into the Value Area High (VAH) and Value Area Low (VAL). The VA is significant because it identifies the zone where most market participants were active, providing a clear picture of market consensus on value.
3. High Volume Nodes (HVN) and Low Volume Nodes (LVN) : HVNs are price levels where there was a large amount of trading activity, indicating significant interest and often serving as strong support or resistance levels. LVNs, on the other hand, represent areas with minimal trading activity, where prices tend to move quickly due to the lack of interest.
The Importance of Volume in Trading
Volume is a fundamental aspect of market analysis, offering insights into the strength and sustainability of price movements. It reflects the level of participation in a market, indicating the intensity of buying or selling at different price levels.
- Confirmation of Price Movements : High volume confirms the legitimacy of a price move. For example, a price breakout from a resistance level on high volume is more likely to be sustained than one on low volume.
- Reversals and Continuations : Spikes in volume can signal potential reversals, especially when occurring at significant price levels such as the POC or near the VA boundaries. Conversely, a sustained high volume along a trend can indicate its continuation.
- Validation of Support and Resistance : Volume at key levels like the POC, VAH, and VAL helps validate these areas as strong support or resistance. When price interacts with these levels on high volume, it suggests that many market participants are active, reinforcing the importance of these price levels.
How to Interpret and Use Volume Profiles:
1. Identifying Key Price Levels :
- The POC acts as a magnet for price, often drawing the price back to it when it moves away. This level is crucial for identifying potential areas of reversal or consolidation.
- The Value Area is where the majority of the trading activity occurs. Prices above the VAH might indicate an overbought condition, while prices below the VAL could suggest an oversold market.
2. Volume and Market Sentiment :
- High Volume Nodes indicate areas of significant interest, where prices tend to stabilize due to heavy trading. These areas often become zones of accumulation or distribution, depending on market conditions.
- Low Volume Nodes indicate price levels with minimal trading interest, where prices may move quickly and encounter less resistance, often leading to rapid price changes or breakouts.
3. Order Flow and Large Volume Blocks :
- Large blocks of volume, particularly at HVNs, suggest the presence of institutional traders or significant market participants placing large orders. These zones are critical because they reflect where big players are accumulating or distributing their positions. As a result, these areas tend to create strong support or resistance levels that can define future market behavior.
4. Dynamic vs. Static Profiles :
- Volume Profile Visible Range (VPVR): This type of profile updates as you scroll through your chart, dynamically showing the volume distribution for the visible price range. It’s useful for analyzing the current market context and finding immediate trading opportunities.
- Fixed Range Volume Profile (FRVP): This profile is static, showing volume data for a specified price range or time period. It’s valuable for comparing current price action to historical data, helping identify long-term support and resistance levels.
Practical Tips for Using Volume Profiles :
1. Customization and Settings :
- Adjust the number of rows or ticks per row in your Volume Profile settings to get a more detailed or broader view of volume distribution. More rows will give you finer detail, while fewer rows will smooth out the data, highlighting major trends.
2. Combining with Other Indicators :
- Use Volume Profiles in conjunction with other technical indicators like moving averages, RSI, or MACD to confirm trading signals and enhance the reliability of your analysis.
3. Adapting to Different Timeframes :
- Tailor your Volume Profile analysis to your trading style. For day traders, shorter timeframes (e.g., 5, 15, 30 minutes) might be more relevant, while swing traders or investors might focus on daily, weekly, or even monthly profiles to identify long-term trends and key levels.
4. Observing Market Reactions at Key Levels :
- Pay close attention to how the market reacts when it approaches HVNs, LVNs, the POC, or the boundaries of the Value Area. These reactions can provide clues about future price movements and potential trading opportunities.
Volume Profiles offer a deep and nuanced view of market behavior by highlighting where significant trading activity has occurred at different price levels. By understanding the interaction between volume and price, traders can make more informed decisions, identify key levels for entry and exit, and gain insights into market sentiment. Integrating Volume Profile analysis into your trading strategy can provide a significant edge, enhancing your ability to navigate the complexities of financial markets.

What is Support and Resistance in Trading. Key Levels Basics
In the today's article, we will discuss the absolute basics of technical analysis: support and resistance levels.
I will explain to you why support and resistance are important , how to identify them properly, and we will discuss what is the difference between support and resistance level and support or resistance zone.
Let's start with a definition of a support .
A support is a historically significant price level that lies below the current prices of an asset.
While a resistance is a historically significant price level that is above the current prices.
From a key resistance, a bearish movement will be anticipated in futures, while from a key support, a bullish reaction will be expected.
Take a look at EURAUD pair, we can see a perfect example of a key resistance level.
2 times in a row, the market dropped from that in the past, confirming its significance.
By a historical significance , I mean that the price reacted strongly to such price level in the past and a strong bullish, bearish movement initiated from that.
Above is the example of a key horizontal support on EURCHF. The underlined key level was respected by the market multiple times in the past.
From time to time, the market breaks key levels.
After a breakout , a support turns into resistance
and a resistance turns into support.
Above is the example of a breakout of a key support on GBPNZD, after its violation it turned into resistance from where a bearish movement followed.
Always remember, that in order to confirm a breakout of a key support, we strictly need a candle close below that.
By the way, the structure here is also the zone, but we will discuss it later on.
Above is the example of a breakout of a key resistance, that turned into support after a violation.
Very often, newbie traders ask me, how many times the price should react to a key level to make it valid.
I do believe that 1 time is more than enough, however, make sure that the reaction to that is strong .
Above are key support and resistance on GBPCAD. Even though both structures were respected just one time in the past, the reaction to them was strong enough to confirm that the underlined levels are the key levels.
However, historical significance of a key support or resistance is not enough to make it valid.
What matters is the most recent reaction of the price to that.
Key supports and resistance lose their significance with time, and your job as a technical analyst, is to stay flexible and adapt to changing market conditions, regularly updating your analysis.
Above is a key resistance level on AUDJPY from where the market dropped heavily 2 times in a row.
However, with time, the underlined resistance lost its significance.
Such a structure is not a key level anymore.
Remember a simple rule: if a key structure is not respected by the sellers, and by the buyers after its breakout.
Or vice versa: if a key structure is not respected by the buyers, and then by the sellers after its breakout.
Such a structure is not a key level , and you should not rely on that in the future.
In our example, the resistance was broken - it was neglected by the sellers. After the breakout, it should have turned into support, but the buyers also neglected that and the structure lost its strength.
Now, a couple of words about time frames,
you can identify key support and resistances on any time frame, but
the rule is that higher is the time frame, more significant are the supports and resistances there.
In my analysis, I primarily rely on support and resistance on a daily time frame.
Always remember that the financial markets are not perfect and the prices will quite rarely respect the exact support or resistance levels.
Quite often, the markets may fluctuate around key levels so it is highly recommendable to rely not on single key levels but on zones.
I recommend taking into consideration not only the exact level from where a strong reaction followed, but also a candle close level of such a candle.
The support zone above is based on a wick and a candle close of a candle.
Also, quite often there will be the situations when multiple key levels will lie close to each other.
In such a case, it is better to unite all this structures in one single zone.
Above we see multiple key resistances.
We will unite all these resistances into one single zone. The upper boundary of a resistance zone will be the highest wick and its lower boundary will be the highest candle close.
Above we have 2 key supports lying close to each other.
We will unite these supports into one single zone.
The lower boundary of a support zone will be the lowest wick and the upper boundary will be the lowest candle close.
Here is how a complete structure analysis should look.
Following the rules that we discussed, you should identify at least 2 closest key resistances and 2 closest key supports.
These structures will be applied as the entries for various trading strategies.
❤️Please, support my work with like, thank you!❤️

KOG - Identify your zones!Identifying the correct zones and regions for your trading:
Many of our followers will know that not only do we have Excalibur targets, we give the exact levels and price points that we want the price to achieve. What we also do, is show you the boxes (zones) on the chart for the wider community, to help steer you in the right direction. Price action plays a huge part in this and it’s something all traders should learn, however, zones are effective, not only in trading the right way, but knowing when you’re in the wrong way!
Price is a series of test on levels. It creates trends or ranges but will always do the same thing. Once we understand this, we know it's not the market that is the problem, it’s us, the trader. If we learn it's behaviour all we then need to do is make sure our money and risk management is up to scratch. It's never 100%, but if we test a level, it breaks, structure suggests it's going against us, don't hold on to hope, or add more in the direction you intended. Cut the damn thing like it's a poison to your account.
You need to treat this as a business, no matter what your account size. Every day there are large institutions who want to take your money away from you, you’re in this market to take from them and give them as little as possible. You should have a risk model in place, am I going to risk a certain percentage of my account? Am I going to stick to a stop loss of a certain number of pips? Am I going to have a risk reward that makes sense? Your stop loss and risk management plan are your best friend in this market, it allows you to limit the losses and live to trade another day.
The market will give you clues as to what it’s going to do, breaks, tests, and retests. We can plan the move before it happens this way, we know if it breaks a level, that level turns into support or resistance then it’s going to go and test the next level.
Remember:
The market will always give you a chance to get out of a trade if it’s going against you, as traders our ego's take over and we hold on to hope. If you're in a whipsaw and choppy market and in the wrong direction, your safest option, even if it ends up going your way in the end is to get out of it and limit your losses. You can always find another entry point for a better risk reward.
Ego is one of the biggest killers of accounts and works both ways. Hold on to a failing plan it will humble you. Show the market you’re too confident, it will humble you! Know when to trade, know when not to trade, know when you’re in the wrong way and accept defeat!
The example on the chart is showing you a simple 4H timeframe, with the zones in place. We know price will play zones and levels, it has to test these almost to see if it likes that price point or not. It will either break or reject the level.
If it breaks, you will usually see a forceful break, then the retest of the level which turns previous support/resistance into new support/resistance, or it will reject, in which case you will usually find the reversal. When trading with a bias or a target in mind, the market will use these zones (levels) to work within and as traders, we should know that if a level is hit, that’s our target reached, or, if it’s broken, that’s sign that we should either start thinking about managing the trade or getting out of it. In order to plot the levels, you will need to zoom out of the chart. Similar to the ‘Simple trading strategy’ we have shared in the past, you will use the peaks and troughs dragged across to present day, to identify your zones. Why? You may ask! Because the market is historical, the levels are the levels, and “levels don’t lie”.
Concern:
What many traders do, and it’s not their fault, it’s just a lack of education and trading experience, is hold on to trades with huge drawdown. They will place a trade in one direction, price goes against them, instead of implementing a stop loss, they will convince themselves the market will come back to this price, so instead “I’ll turn that into a swing trade”. This is the wrong way to think about the market, especially if you’re an intra-day trader, which most of us are. Shown on the chart, you can see, the level breaks, the level is retested, the retest in confirmed and the price moves away from the level. Once, the retest if confirmed, that’s the market telling you the trader, listen, you’re potentially in the wrong way, and we’re going to test another level higher/lower, so prepare yourself.
This is a really simple way, together with a risk model in place, to limit losses and maintain a healthy account.
Please try it and let us know!
As always, trade safe.
KOG

The combination of gcov5 and TCD osc = high precision & win5m chart, overall condition analysis. The combination of gcov5 and TCD osc will give more strength to a decision whether to buy or sell. In turn, it can increase accuracy and win.
how to get a win in all positions?
1. refers to bull/bear trend ( TCD osc)
2. find a gcov5 signals based on SnD zone and early TCD trend
3. buy price 3 ticks below the close of the signal candle,
and sell price 3 ticks above the close of signal candle,
so that we can get a tick advantage. If a high candle formed, so enter half candle price.
What to do if we miss the signals?
sometimes, we miss a buy signal after several candles.
We can still enter the market by referring to the nearest support as a buy area
and resistance as a sell area. For attention, do not proceed into market if
1. the price breakdown a support or
2. if we have missed the signal too far
DISCLAIMER;
This post is not meant to be a buy/sell call, just ideas and research analysis based on measurement tools.

How to Trade Support and Resistancesupport and resistance levels are crucial concepts that every trader needs to grasp. These levels represent key points on a chart where the price tends to reverse its direction. By analyzing historical price action, traders can identify these areas and strategize their trades based on how the price reacts upon reaching these levels.
The Simplicity and Complexity of S&R
While the idea of support and resistance is straightforward to understand, effectively trading these levels can be challenging due to psychological barriers and emotional involvement. Mastering support and resistance trading isn’t just about recognizing patterns; it’s also about understanding the human emotions driving those patterns.
What is Support and Resistance
Support is a price level where a currency’s downward trend is expected to pause due to a concentration of demand. It’s where buyers step in, viewing the currency as undervalued, thus preventing further price decline.
The OANDA:XAUUSD chart above depicts a notable support level of 2031. Historically, when the price of Gold reaches this level, it tends to initiate an upward trajectory. Traders can identify potential trading opportunities at this juncture and consider establishing long positions after the confirmation signal, such as a break of structure, signs of a liquidity sweep, or the order block.
Traders can also use the bullish candlestick pattern as an additional signal when considering support zones for buying opportunities.
In the FX:EURUSD pair, there is a noteworthy support zone extending from 1.0648 to 1.0666. Over several instances, the price has consistently demonstrated a pattern of bouncing upward from within this range, as illustrated in the chart.
Let’s see another example of support zones with stop-loss hinting.
The price level at 1.08924 serves as a significant support zone; however, it’s important to note that smart money often orchestrates moves that trigger stop-loss orders before driving the price upwards. Later in this S&R trading guide, we’ll delve into a detailed discussion of the concept of stop-loss hunting, complete with illustrative examples.
What is Resistance
Resistance levels are price levels at which the price tends to move in a downward direction.
Let’s analyze the chart provided above. The circled areas on the chart represent strong resistance zones where the price tends to move in a downward direction in the EURUSD pair. It’s worth noting that quite often, the price moves downward after triggering stop-loss orders in these areas. This phenomenon can be observed frequently in any currency pair.
The Psychology Behind These Levels
Fear and Greed: These are the two main emotions at play. At support levels, fear (of prices falling more) meets greed (for buying at a low price). At resistance levels, it’s the opposite; greed (for higher selling prices) meets fear (of prices dropping).
Group Thinking: Many traders are watching the same levels. When a lot of people act the same way (buying at support or selling at resistance), it reinforces these levels.
Self-Fulfilling Prophecy: Because so many traders are watching these levels, their reactions to them can make the support and resistance predictions come true.
Formula of Support and Resistance
Pivot Point Calculation
The Pivot Point (PP) is calculated as the average of the high, low, and close prices of the previous trading period:
Pivot Point (PP) = (High + Low + Close) / 3
First-Level Support and Resistance
First Resistance (R1) This is calculated by doubling the pivot point, then subtracting the low of the previous period.
First Resistance (R1) = (2 x PP) – Low
First Support (S1) This is found by doubling the pivot point and subtracting the previous period’s high.
First Support (S1) = (2 x PP) – High
Second-Level Support and Resistance
Second Resistance (R2) This level is calculated by adding the difference between the high and low of the previous period to the pivot point.
Second Resistance (R2) = PP + (High – Low)
Second Support (S2) This is determined by subtracting the difference between the high and low of the previous period from the pivot point.
Second Support (S2) = PP – (High – Low)
Third Level Support and Resistance
Third Resistance (R3) Calculated by adding twice the difference between the pivot point and the low to the high.
Third Resistance (R3) = High + 2(PP – Low)
Third Support (S3) Found by subtracting twice the difference between the high and the pivot point from the low.
Third Support (S3) = Low – 2(High – PP)
These pivot point-based support and resistance levels are crucial tools for traders, providing potential points of market reversal or continuation. The pivot point is often seen as a marker of equilibrium between bullish and bearish market forces.
The Phenomenon of Stop-Loss Triggers at These Points
A stop-loss order is a tool used in trading to sell a security when it reaches a predetermined price, to limit potential losses. To understand how it relates to support and resistance, consider the following analogy:
Think of trading as a game where you establish a rule: if your score drops below a certain point, you decide to exit the game to prevent further losses. This rule resembles the concept of a “stop-loss” in trading.
Now, picture a scenario involving seasoned players, often represented by large funds, who aim to maximize their gains in the game. They observe that many players have set their exit points at a specific level, such as 100 points.
These experienced players intentionally create the impression that the game’s score is approaching that critical 100-point level. As the score gets closer to 100 points, other players become anxious and decide to exit the game (activating their stop-loss orders) to avoid more significant losses. This sudden mass exit results in a sharp decline in the game’s score.
Smart money takes advantage of this situation by purchasing more points at the lower price they anticipated. After acquiring these points at a discounted rate, they allow the game’s score to rebound, ultimately profiting when it reaches higher levels.
In essence, this illustrates how Informed Money, often represented by large funds, may manipulate the market by creating the illusion that prices are nearing significant support or resistance levels. This can trigger the activation of stop-loss orders by other traders, enabling the seasoned players to capitalize on lower prices before the market resumes its upward trajectory.
Trading Strategy for Support and Resistance
When trading support and resistance make decisions on their base consider the following points.
Identify Support and Resistance in Larger Time Frames: Locate these levels in extended time frames like H1, H4, and D1 to gain a clear understanding of the market’s pivotal points. This approach not only clarifies your perspective when trading in smaller time frames but also reduces confusion. Confusion often arises from too many levels, making it challenging to determine which levels present viable trading opportunities.
Patience: Wait for the price to reach these levels and look for additional signals.
Utilize Bearish and Bullish Candlestick Patterns: Employing candlestick patterns at these levels aids in decision-making and enables traders to strategically set take-profit and stop-loss orders.
Develop a Trading Bias: Establish a daily bias at the beginning of each week to assist in deciding whether to take long or short trades. Focus only on those levels that align with your trading bias.
In conclusion, discipline is paramount in trading. It’s essential to avoid overtrading and adhere strictly to your established trading plans. Using stop-loss orders is crucial in managing risk and protecting your capital. Additionally, limiting your focus to a fixed set of currency pairs allows for a more in-depth understanding of their market dynamics, leading to more informed trading decisions. Remember, consistency and discipline in following these practices can significantly enhance your trading effectiveness and help in achieving long-term success.
how to identify strong support and resistance
Historical Price Levels: The most basic method is to look at historical price charts. Strong support and resistance levels are often at prices where the market has repeatedly reversed or consolidated. These levels are more significant if they have been tested multiple times.
Round Numbers: Psychological levels often play a crucial role in trading. Prices such as 1.3000 in EUR/USD or 100 in USD/JPY are examples where traders might expect support or resistance.

Mastering Trading with Support and Resistance LevelsTrading with support and resistance levels is a fundamental strategy that offers insights into market psychology and potential trade entry and exit points. This guide will explore how to effectively trade using these levels, highlighting the importance of confirmation, rejection patterns, candlestick patterns, and confluence with other indicators.
Understanding Support and Resistance
- Support : A price level where a downtrend may pause due to a concentration of demand.
- Resistance : A price level where an uptrend can pause or reverse because of a concentration of selling interest.
The Significance of Confirmation
Confirmation is crucial when trading with support and resistance, as it ensures that the price respects these levels before making a trade. Waiting for confirmation reduces the risk of false signals.
Candlestick Patterns: The Language of the Markets
Understanding candlestick patterns is essential for interpreting market sentiment at support and resistance levels. Patterns like bullish engulfing or bearish engulfing suggest strong reversals.
Finding Confluence with Other Indicators
Confluence enhances the reliability of trading signals. Combining support and resistance analysis with other indicators like moving averages or the stochastic RSI can provide stronger entry or exit signals.
Integrating Support and Resistance into Your Trading
Identify key levels : Mark clear support and resistance levels on your chart.
Wait for confirmation : Confirm the level is holding through candlestick patterns or price action before trading.
Look for rejection patterns : Observe candlestick formations for reversal signals.
Seek confluence : Use other indicators to validate your trading signals.
Manage your risk : Always set a clear stop-loss order to manage potential losses.
By employing these strategies, traders can enhance their market navigation skills, focusing on managing risk and seizing the right opportunities. With patience and practice, trading with support and resistance levels can be a vital part of a successful trading approach.

Mastering Support & Resistance This video dives into the fundamentals of support and resistance, the cornerstones of technical analysis.
We'll cover:
** Identifying trends:** Learn how to spot bullish and bearish trends using higher highs/higher lows (HH/HL) and lower highs/lower lows (LH/LL).
️** Support & Resistance Levels: Discover how to pinpoint key price levels where the market may bounce or reverse, creating potential trading opportunities.
** Fibonacci: Unlock the power of the Fibonacci retracement to identify high-probability trade entry points at the 61.8% level.
