The key is whether the USDT and USDC gap downtrend will stop
Hello, fellow traders!
Follow us to get the latest information quickly.
Have a great day.
-------------------------------------
(USDT 1D chart)
USDT is showing a gap downtrend, leading to a decline in the coin market.
A gap downtrend in USDT or USDC can be interpreted as a sign of capital outflow from the coin market.
The key question is whether this gap-up will lead to another upward trend.
(USDC 1D chart)
USDC is also showing a gap-up trend.
It's worth paying attention to the movements of USDT, which has a significant impact on the coin market.
-
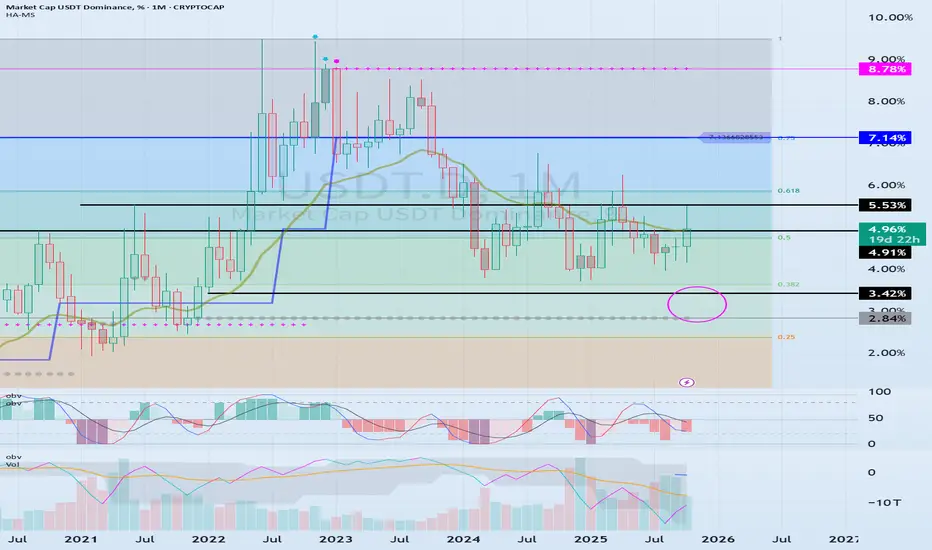
(USDT.D 1M chart)
USDT is showing a gap-down trend, leading to an increase in USDT dominance.
A rising USDT dominance is likely to lead to a downward trend in the coin market.
Therefore, it's beneficial to see a declining USDT dominance.
This means that funds are flowing into the coin market through USDT, and the inflow of USDT is used to purchase coins, causing USDT dominance to decline.
-
(BTC.D 1M chart)
As BTC dominance rises, I believe funds will flock to BTC, creating a BTC-led market.
Therefore, we expect an altcoin bull market to emerge when BTC dominance and USDT dominance coincide.
For this to occur, BTC dominance must fall below 55.01 and either remain stable or exhibit a downward trend.
-
Currently, USDT dominance is rising, while BTC dominance is falling.
I believe this movement is best interpreted as altcoins focusing on price defense.
The decline in BTC dominance indicates that funds are flocking to altcoins, while the rise in USDT dominance indicates a downward trend in the coin market.
-
Therefore,
we need to determine whether the upward trend of USDT and USDC can be sustained,
starting with the recent gap-up,
see whether the upward trend of USDT dominance has stalled,
and whether BTC dominance can support the price of BTC.
While the USDT, USDC, BTC.D, and USDT.D charts only provide a rough idea of the fund flow in the coin market, I believe this information alone is a valuable resource for individual investors who trade with limited information.
Therefore, I believe this is one of the reasons why the coin market is more transparent than any other investment market.
-
Thank you for reading to the end.
I wish you successful trading.
--------------------------------------------------
USDC

Understanding the Money Flow in the Coin Market
Hello, fellow traders!
Follow me to get the latest information quickly.
Have a great day!
-------------------------------------
(USDT 1D Chart)
(USDC 1D Chart)
I believe that USDT and USDC show a gap up trend when funds flow into the coin market, and a gap down trend when funds flow out.
Therefore, unless the gap turns into a downtrend, the coin market is expected to maintain its upward trend.
-
(USDT.D 1D Chart)
(1M Chart)
As funds flow into and out of the coin market through USDT and USDC, USDT dominance is likely to ultimately rise.
However, I believe that the funds (USDT, USDC) flowing into the coin market will change dominance through trading.
In other words, if USDT dominance declines, the coin market is likely to trend upward.
This is because coins (tokens) are being purchased with USDT.
If USDT dominance remains below 4.91 or declines, the coin market is likely to trend upward.
Therefore, if USDT dominance rises without any evidence of fund outflows through USDT or USDC, it can be interpreted as a temporary increase in selling pressure.
If USDT or USDC gaps downward in this situation, the price will fail to defend, leading to a downward trend in the coin market.
Therefore, it's best to look at the USDT and USDT.D charts to understand the general flow of funds.
-
(BTC.D 1D chart)
(1M chart)
I believe BTC dominance reflects the relationship with altcoins, rather than the rise or fall of the coin market or the rise and fall of BTC itself.
In other words, rising BTC dominance indicates a concentration of funds toward BTC, increasing the likelihood that altcoins will gradually move sideways or experience a downward trend.
Therefore, for an altcoin bull market to begin, it must remain below 55.01-62.47 or show a downward trend.
Therefore, it is recommended to check BTC dominance before trading altcoins and develop a trading strategy.
--------------------------------------------------
Summary of the above:
For the coin market to continue its bull market,
1. USDT and USDC must maintain a gaping upward trend.
2. USDT dominance should decline below 4.91.
3. BTC dominance should decline below 55.01.
-
Thank you for reading.
I wish you successful trading.
--------------------------------------------------
Example of Interpretation of USDT, USDC, BTC.D, USDT.D
Hello, traders.
If you "Follow", you can always get new information quickly.
Please also click "Boost".
Have a nice day today.
Trading Strategy
-------------------------------------
(USDT 1D chart)
USDT is a stable coin that has a great influence on the coin market.
Therefore, the gap decline of USDT is likely to have a negative impact on the coin market.
Since the gap decline means that funds have flowed out of the coin market, it can be interpreted that funds have currently flowed out through USDT.
(USDC 1D chart)
USDC cannot help but have a lower influence on the coin market than USDT.
The reason is that USDC markets are not operated in all exchanges around the world.
In other words, USDC can be seen as having limitations compared to USDT as an American investment capital.
Therefore, the gap increase of USDT is likely to have a short-term impact on the coin market.
----------------------------------
(BTC.D 1D chart)
You can refer to BTC dominance to choose which side (BTC, Alts) to trade in the coin market.
Since the rise in BTC dominance means that funds are concentrated on BTC, it can be interpreted that Alts are likely to gradually move sideways or show a downward trend.
For this interpretation to be meaningful, USDT dominance must show a downward trend.
(USDT.D 1D chart)
Because the decline in USDT dominance is likely to result in a rise in the coin market.
Therefore, if USDT dominance rises, it may be a good idea to pause all trading and take a look at the situation.
-
You can roughly figure out whether funds are flowing into or out of the coin market with USDT and USDC.
You can roughly figure out which direction the funds in the actual coin market are moving with BTC dominance and USDT dominance.
As I am writing this, BTC dominance is rising and USDT dominance is falling, so it is better to trade BTC rather than Alts.
-
Thank you for reading to the end.
I hope you have a successful trade.
--------------------------------------------------

The Coin Market is Different from the Stock Market
Hello, traders.
If you "Follow", you can always get new information quickly.
Please also click "Boost".
Have a nice day today.
-------------------------------------
The coin market discloses a lot of information compared to the stock market.
Among them, it discloses the flow of funds.
Most of the funds in the coin market are flowing in through USDT, and it can be said that it currently manages the largest amount of funds.
Therefore, unlike the stock market, individual investors can also roughly know the flow of funds.
Therefore, you can see that it is more transparent than other investment markets.
-
USDT continues to update its ATH.
You can see that funds are continuously flowing into the coin market through USDT.
USDC has been falling since July 22 and has not yet recovered.
The important support and resistance level of USDC is 26.525B.
Therefore, if it is maintained above 26.525B, I think there is a high possibility that funds will flow in.
If you look at the fund size of USDT and USDC, you can see that USDT is more than twice as high.
Therefore, it can be said that USDT is the fund that has a big influence on the coin market.
USDC is likely to be composed of US funds.
Therefore, if more funds flow in through USDC, I think the coin market is likely to develop into a clearer investment market.
But it is not all good.
This is because the more the coin market develops into a clearer investment market, the more likely it is to be affected by the existing investment market, that is, the watch market.
This is because large investment companies are working to link the coin market with the coin market in order to make the coin market an investment product that they can operate.
In order for the coin market to be swayed by the coin-related investment product launched in the stock market, more funds must flow into the coin market through USDC.
Otherwise, it is highly likely that it will eventually be swayed by the flow of USDT funds.
Therefore, USDC is likely to have a short-term influence on the coin market at present.
-
As mentioned above, the most important thing in the investment market is the flow of funds.
The flow of funds in the coin market can be seen as maintaining an upward trend.
Therefore, there are more and more people who say that there are signs of a major bear market these days, but their position seems to be judging the situation from a global perspective and political perspective.
As mentioned above, the funds that still dominate the coin market are USDT funds, which are an unspecified number of funds.
Therefore, I think that the coin market should not be predicted based on global perspectives and political situations.
The start of the major bear market in the coin market is when USDT starts to show a gap downtrend.
Until then, I dare say that the coin market is likely to maintain its current uptrend.
------------------------------------
(BTCUSDT 1D chart)
The StochRSI indicator is approaching its highest point (100), and the uptrend is reaching its peak.
Accordingly, the pressure to decline will increase over time.
-
(1W chart)
The StochRSI indicator is also in the overbought zone on the 1W chart.
-
(1M chart)
On the 1M chart, the StochRSI indicator is showing signs of entering the overbought zone, but it is not expected to enter the oversold zone due to the current rise.
The movement of the 1M chart should be checked again when a new candle is created.
-
You can see that the StochRSI indicator on the 1M chart is the most unusual among the three charts above.
In the finger area on the 1M chart, the StochRSI indicator was in the overbought zone, but it is currently showing signs of entering the oversold zone.
Therefore, you can see that the current movement is different from the past movement.
Therefore, I think it is not right to predict the current flow by substituting past dates.
------------------------------------------
I wrote down my thoughts on the recent comments from famous people who say that the coin market will enter a major bear market along with the stock market.
-
Have a good time. Thank you.
--------------------------------------------------
- Big picture
It is expected that the real uptrend will start after rising above 29K.
The section expected to be touched in the next bull market is 81K-95K.
#BTCUSD 12M
1st: 44234.54
2nd: 61383.23
3rd: 89126.41
101875.70-106275.10 (overshooting)
4th: 134018.28
151166.97-157451.83 (overshooting)
5th: 178910.15
These are points where resistance is likely to be encountered in the future. We need to see if we can break through these points.
We need to see the movement when we touch this section because I think we can create a new trend in the overshooting section.
#BTCUSD 1M
If the major uptrend continues until 2025, it is expected to start by creating a pull back pattern after rising to around 57014.33.
1st: 43833.05
2nd: 32992.55
-----------------

Domination of USDT + USDC and lows/maxims of BTC. CorrelationIn the graph, combined into one graph of the dominance of such stablecoins as USDT and USDC.
Orange color—chart of the bitcoin price against the dollar.
The time interval is 1 week. The graph is logarithmic.
The same chart and the same parameters on the candlestick chart .
All BTC price lows and highs are specially shown. Compare what the capitalization of stablecoins was at the time.
At an earlier time, the dominant stablecoin was one USDT, later USDC was added. They occupy a significant capitalization. BUSD and DAI are less capitalized. They too can be added to this “indicator” of the Pumps/Dumps market.
I think the dominance history and the bitcoin overlay chart illustrate well which market phase and in which areas to buy and sell bitcoins and other speculative crypto coins.
Centralized Stablecoin capitalization of a decentralized market .
Sounds crazy, doesn't it? The dominance of centralized in a decentralized market. The 3rd,4th,6th places are naturally occupied by centralized stablecoins such as: #USDT #USDC #BUSD.
This kind of decentralized cryptocurrency financial world (freedom from the dictatorship of banks, power states, and so on) did you imagine, for example, in 2015-2017? Is it good or bad? What will happen after a while? What trend will develop further after the community bait has been swallowed?
3rd place . USDT ( .... "Reds" .... )
$67,562,687,657
4th place . USDC (Circle, Coinbase, JPMorgan, Blackrock .... )
$51,726,419,583
6th place . BUSD (Binance)
$20,003,320,692
13th place DAI ETH (!)
BTC and ETH dominance.
Continuing on this “democracy” theme of crypto sandbox capitalization. Today 14 09 2022.
Market Cap: $989,560,104,72
Dominance:
#BTC: 38.9%
#ETH: 19.9%
Total 2 assets: 58,7%
Also add 3,4,6,13 top stablecoins to this.
Stablecoins over 20%.
Almost 60% of the market is 2 assets.
Over 80% of the market is 6 assets.
So much for the true mythology of decentralization ))).
How to look for a “live chart” for yourself and combine the dominance of USDT and USDC:
1) Look for the MARKET CAP USDT DOMINANCE, %
2) On the right side of the chart in the search field, press the + button
3) Write MARKET CAP USDC DOMINANCE, %.
For the analysis, it will also be useful to track at the same time:
1) BTC dominance
2) US dollar index (DXY, USDX)
BTC dominance
BTC to altcoin dominance. Stablecoin dominance and market pamp.
US Dollar Index (Fed)with prices of BTC lows/maxims. Correlation of assets.
DXY and PampDump BTCMarkets Cycles.
This is what it looks like on a line chart to illustrate simple correlation things.
Preparedness for force majeure.
I would also like to say that all stabelcoins are focused on the "stability" of the U.S. dollar. Think about what would happen if, for some reason, that stability were to be undermined in the blink of an eye. Then you are faced with a very difficult choice.
What to do? Sell/buy cryptocurrency/shares? Just think ahead "What do you do" if, purely hypothetically, for some fantastic, hard-to-imagine reasons this happens. Think ahead in today's calm time (are you sure it's not calm now?), so you won't be caught off guard in a turbulent time.

Winning or losing a trade depends on your state of mind (2)Hello?
Traders, welcome.
If you "Follow", you can always get new information quickly.
Please also click "Boost".
Have a good day.
-------------------------------------
(USDT chart)
Looking at the 1D chart, you can see that after a short but long uptrend, it recorded a pullback, creating the first gap.
In the meantime, the HA-High indicator on the 1D chart rose and was created.
Accordingly, it is necessary to ensure that funds are maintained at 81.839B or higher.
Falling while creating a gap means that funds were outflowed through USDT, so we need to check the future situation.
----------------------------------------
(USDC chart)
USDC is currently in a downtrend.
Therefore, it is necessary to check whether the trend turns upside down.
If not, and if it continues to show a downward trend, the coin market will not be able to maintain its upward trend and will likely fall sharply.
Currently, it is judged that the funds that have flowed into the coin market through USDT are defending the price, but if USDT shows a decline, it is necessary to be careful because the withdrawal of funds from the coin market can occur quickly.
The first thing to check is to see if USDC holds above the HA-Low indicator on the 1D chart.
------------------------------------------------
(BTC.D chart)
BTC dominance is good to look at to see if funds are concentrated towards BTC or towards altcoins.
This is because any other method of interpretation will rather complicate your thinking.
-------------------------------------------------
(USDT.D chart)
An increase in USDT dominance can be interpreted as a high possibility of a downward trend in the coin market.
Therefore, it is highly likely that BTC, the number one coin market by market cap, will show a downward trend.
The reason is that when trading on coin exchanges, the USDT market is as large as the BTC market.
Because various coins (tokens) can be directly traded with USDT, changes in USDT dominance can be interpreted as reflecting the overall trend of the coin market.
Therefore, support and resistance points formed on the USDT dominance chart cannot be used to directly trade coins (tokens).
However, since you can know the flow of money in the coin market, you will eventually be able to see the chart of the coin (token) you want to trade and use it as a reference for creating a trading strategy.
This is because you can figure out whether the flow of funds is moving toward buying or selling, so you can find the timing of your trade accordingly.
--------------------------------------------------
Following the DXY chart description, the same explanation is given to the USDT Dominance chart.
If you think these two explanations are different, we recommend that you read them several times in more detail.
The fact that your psychological state is starting to fluctuate due to price fluctuations means that the flow of funds is changing.
That's why, without knowing it, your own psychology starts to fluctuate.
In order to stabilize this psychological state, it can be stabilized through appropriate transactions.
Therefore, if you hold a coin (token), you can get some psychological stability by checking the movement at the support and resistance point and confirming the profit or loss by selling a certain amount.
If you do not own any coins (tokens), you can take your own psychological stability by purchasing a certain amount.
In order to trade, you must make your psychological state stable.
If you proceed with a transaction without achieving this, there is a very high possibility that the transaction will eventually fail.
-------------------------------------------------- -------------------------------------------
** All descriptions are for reference only and do not guarantee profit or loss in investment.
** Even if you know other people's know-how, it takes a considerable period of time to make it your own.
** This is a chart created with my know-how.
---------------------------------

Market Cap Chart: Money MovementHello?
Traders, welcome.
If you "Follow", you can always get new information quickly.
Please also click "Boost".
Have a good day.
-------------------------------------
(USDT chart)
(USDC chart)
Looking at the USDT chart, it can be seen that a lot of money is flowing into the coin market, rising above the previous high of 82.467B.
However, if you look at the USDC chart, you can see that there is a constant outflow of funds.
I think this movement can be interpreted as individual investors' funds are constantly flowing into the coin market, but institutional investors are leaving their funds out of the coin market.
The reason why USDT is interpreted as an individual investor is that it is used as a channel through which individual investors can easily move funds because USDT supports trading pairs on exchanges around the world.
In particular, the main power of this USDT is expected to be Chinese funds.
USDC is still a stablecoin that has limited support for trading pairs on exchanges around the world.
Therefore, I think it is highly likely that the forces that move funds through this USDC are American funds.
I think the leadership of the coin market has shifted from Chinese capital to American capital.
This move is expected to make the coin market a transparent investment market.
However, as the possibility of being affected by movements in the capital market increases, the volatility is expected to gradually decrease.
-------------------------------------------------- ------
(BTC.D chart)
Looking at the BTC dominance chart, a volume profile is formed in the 47.64-48.80 section and the 56.78-61.73 section.
So, if it rises above 48.80, I would expect it to rise around 56.78-61.73.
I think that the reason why it starts to be affected by the movements of the world economy is because, as explained in USDT and USDC, American capital is leading the coin market.
The variable for this movement is that funds from individual investors are continuously flowing into the coin market.
This influx of funds is expected to drive the upward trend of the explosive coin market at some point.
This explosive rise will drive the rise in BTC price, which is expected to increase BTC dominance.
Therefore, I think we should observe the flow under the premise that BTC dominance will rise around 56.78-61.73.
It is actually unknown whether the price of BTC will rise or fall due to the rise in BTC dominance.
This is because BTC dominance can tell whether funds are concentrated in BTC or altcoins.
This is because the concentration of funds is relative, so if a lot of funds are withdrawn from the altcoin, BTC dominance may rise.
Therefore, I do not think it is correct to interpret that BTC price will rise as BTC dominance rises.
-------------------------------------------------- --------------
(USDT chart)
I think the first chart you should come across to understand the Coin Market Cap chart is the USDT chart.
This is because USDT has the highest market cap among stablecoins and has become an important stablecoin that supports trading pairs on exchanges around the world.
Therefore, I think that the change in USDT dominance can be used to understand the overall trend of the coin market.
When USDT dominance declines, the coin market is likely to show an uptrend.
Thus, USDT dominance allows you to know how to proceed with a trade depending on whether it is a rising or falling candle.
Since these movements are likely to move against the BTC price chart, they can help interpret BTC price fluctuations.
If USDT dominance rises above the 7.86-8.25 range, the coin market is likely to plunge.
This is because the current section is an important section.
-------------------------------------------------- -------------------------------------------
** All descriptions are for reference only and do not guarantee profit or loss in investment.
** Even if you know other people's know-how, it takes a considerable period of time to make it your own.
** This is a chart created with my know-how.
---------------------------------

USDT vs USDC Reserve BreakdownUSDT (Tether) vs USDC (Circle) reserves☝️
USDT seems to be more diversified then USDC, as they’ve split their reserves into 7 different asset classes. Compared to USDC who are only diversified into 3.
USDT has a healthy 4% of their reserves in Gold, which is up 8% year to date SO FAR. They’re more likely to survive a liquidation process, compared to USDT when the next Crypto crash happens💥

Identify the size or flow of funds in the coin marketHello?
Traders, welcome.
If you "Follow", you can always get new information quickly.
Please also click "Boost".
Have a good day.
-------------------------------------
In order to find out the size or flow of funds in the coin market, I think you should pay attention to the movement of the four charts below.
Check the size of your funds: USDT, USDC
Check the flow of funds: BTC.D, USDT.D
It is best to view all four charts together if possible because you can find out the size or flow of funds from limited information.
If it is difficult to see all four charts, it is recommended to view at least the USDT.D chart, which shows the flow of funds best.
------------------------------------------
(USDT chart)
(USDC chart)
It is important to check the USDT and USDC charts to find out the flow of funds in the current coin market.
USDT is a stablecoin backed by exchanges around the world.
Therefore, it is indispensable for most coin (token) transactions.
Therefore, the fact that USDT maintains an upward trend can be interpreted as meaning that funds are continuously flowing into the coin market.
However, the size of the candlestick is not very important because it is thought that new funds will flow in only when a gap occurs and rises on the USDT and USDC charts.
Although USDC maintains a high market cap, it is one of the stablecoins with little support for trading pairs on exchanges around the world.
However, since the market capitalization is maintained at a high level, it is less than USDT, but I think it exerts some influence on the coin market.
In particular, since USDC is likely to be composed of US investment capital, it is understood that it is being used as a fund warehouse by institutional investors.
Therefore, it is highly likely that USDC funds will be moved according to stock market fluctuations.
In that sense, if you look at the flow of the current USDC chart, you can see that a lot of money is flowing out of the coin market.
I think it is a disprove that funds are moving from the coin market to the stock market.
So, if the stock market shows a clear uptrend, the USDC chart is predicting a trend reversal.
Therefore, USDC's downtrend has the potential to limit or plunge the coin market's uptrend caused by USDT's uptrend.
We expect this move to act as an opportunity to increase new buying.
-------------------------------------------------- --------
(BTC.D chart)
(USDT.D chart)
It is recommended to look at the BTC.D chart and the USDT.D chart together, but if it is difficult, it is better to look at the USDT.D chart alone.
However, since the BTC.D and USDT.D charts show the overall flow of funds in the coin market, it is not possible to know the flow of funds for individual coins (tokens).
To see the individual money flow of a coin (token), it is recommended to look at the BTC market chart of the coin (token).
Since BTC is used as the key currency of the coin market, I think the BTC market chart best reflects the price fluctuations of coins (tokens) according to BTC price fluctuations.
However, coins (tokens) with too low market capitalization are the same regardless of whether they are on the same BTC market chart or USDT market chart.
Coming back to the BTC.D and USDT.D charts,
Since BTC is the number one market capitalization in the coin market, I think most of the fund size or flow in the coin market is related to BTC price fluctuations.
in that sense
The BTC.D chart and the BTC dominance chart are charts that allow you to see whether funds are concentrated toward BTC or altcoins.
Therefore, rising BTC dominance can be interpreted as meaning that funds are concentrated towards BTC.
Just because funds are concentrated towards BTC does not mean that the BTC price will rise.
If you don't understand this point, you should be careful because you can interpret it in the wrong direction.
When funds are concentrated towards BTC, if USDT dominance rises, the coin market is likely to show a downward trend.
The reason is that USDT is a stablecoin that supports trading on exchanges around the world.
This is because the increase in USDT dominance means that USDT is increasing through trading, which means that selling in the coin market is increasing.
Therefore, as a condition for trading altcoins, you must show a drop in BTC dominance and a drop in USDT dominance.
If not, it is because most altcoins are unlikely to make significant gains.
BTC dominance is expected to continue to rise.
The reason is that there is a BTC halving next year.
This is because as the BTC halving approaches, a lot of people will flock to the coin market.
And, if the BTC price starts to rise in earnest, funds will inevitably be concentrated towards BTC for the time being.
If you don't buy it now, it's because you will buy BTC with the thought that you can't.
This will cause altcoins to gradually lose their strength and move sideways or decline, despite the upward trend in BTC price.
I think this trend is likely to continue until the BTC price nears 43K.
As USDT dominance falls below the uptrend line (1), it becomes important whether it can touch around 6.21.
The important divergence of USDT dominance is in the 4.97-5.53 range, and if it falls below this range, the coin market is expected to start such an uptrend in which any coin (token) can be bought and profit will be made.
Before that, the question is whether it can fall below the 5.89-6.21 range.
I think the coin market must fall below the 5.89-6.21 range to go to a big bull market.
So, the next period of volatility on the USDT.D chart is around April 22nd.
After this period of volatility, we need to see if it stays below the downtrend line (2).
-------------------------------------------------- -
I think that the coin market is open to many things that are different from the stock market.
In particular, I think it is attractive to be able to know the size and flow of funds.
Therefore, it is important to first check the four charts mentioned above rather than relying on all kinds of information to predict the prospects and trends of the investment market, that is, the coin market.
After that, I think checking the information going around reduces the possibility of making a wrong decision.
When CDBC becomes active, there is a possibility that the influence of existing stablecoins will be weakened.
The reason for this is that it is highly likely that direct transactions will be possible with CDBC, i.e. fiat currency.
In that case, the size or flow of funds in the coin market may not be known with the above four.
Then, an investment environment like the existing stock market will be created, and more individual investors than now will suffer losses.
-------------------------------------------------- -------------------------------------------
** All descriptions are for reference only and do not guarantee profit or loss in investment.
** Even if you know other people's know-how, it takes a considerable period of time to make it your own.
** This is a chart created with my know-how.
---------------------------------

❗Black Swan by stablecoins. Threat or opportunity for traders?Hi friends! If it heppen to one UST is it heppen to another stablecoins? Next trigger for BTC dump can be caused by stablecoins instability. In this idea i`ll show you some facts about it!
🦢Black Swan. The last Black Swan in all financial markets happened in 2020 because of Covid-19. The crypto market fell by 64%. After the bull market, the Fed Reserve started raising the interest rate, BTC fell by 56%.
What if all the stabelcoins are not secured by anything? If previously the fall of cryptocurrencies was caused by global cataclysms, now we can expect the first black swan only for the cryptocurrency market.
With a EXTREME fear in the market and panic sales of retail traders, BTC could fall to $22k or lower.
📊Stablecoins by Market Capitalization:
1. Tether (USDT) - $83B
2. USD Coin (USDC) - $48.5B
3. Binance USD (BUSD) - $17.1B
4. Dai (DAI) - $6.9B
5. TerraUSD (UST) - $6.9B
Total: $169.4B
❗It`s almost 10% of TOTAL Crypto market Capitalization (169.4/1400).
💱We all know what happened to Luna and UST stabelcoin. US Treasury Secretary Janet Yellen pushes for stablecoin regulation by end of year. Even if the LUNA and UST recover to their previous price, a lot of attention will be focused on other stablecoins as well. On the other hand, this is positive for the crypto market and market players, as crypto security will increase.
✅Friends, if you don`t know what to do when BTC fall by 60-75%, check this idea! I made an educational idea for you when BTC was $39k. It describes 3 ways how you can identify the bottom of the market for BTC and Altcoins!
Friends, where will Bitcoin bottom price? $20-22k or lower? Or BTC already find the dip and go to renew ATH? Share your ideas in comments!
Friends, press the "like"👍 button, write comments and share with your friends - it will be the best THANK YOU.
P.S. Personally, I open an entry if the price shows it according to my strategy.
Always do your analysis before making a trade.

The dominance of stablecoins as a divergence tool in BTCOn the top chart we have the BTC/USD index, and on the bottom chart we have the sum of the dominance of the main stablescoins: USDT, USDC, DAI and UST.
As a rule, when the dominance of stablecoins rises, the price of BTC falls.
Just look at the respective numbered arrows. The only exception was arrow number 3, which had a more lateral movement in the dollar's dominance.
Now looking at this exact moment, we have a rise in stablecoin dominance.
The next resistance is at 7.75% (if dominance continues to rise).
