Trading the VIX – Part 2Trading the VIX – Part 2: VIX ETPs and Strategic Applications
In Part 1 of this series, we explored the structure of VIX Futures, focusing on the roll-down effect in a contango VIX futures curve—common in calm market conditions.
In Part 2, we turn our attention to VIX-related Exchange-Traded Products (ETPs)—specifically, the popular and liquid:
• VXX – unleveraged long VIX ETP
• UVXY – leveraged long VIX ETP
• SVXY – inverse VIX ETP
Each of these products is based on a specific VIX futures strategy, the “S&P500 VIX Short Term Futures Index” , which is maintained by S&P, Dow Jones (the “SPDJ-Index”). The Fact Sheet and Methodology can be obtained from the S&P Global website.
What is the SPDJ Index that these ETPs track?
The SPDJ-Index is a strategy index that maintains a rolling long position in the first- and second-month VIX futures to maintain a constant 30-day weighted average maturity.
Key Features of the SPDJ Index:
• Starts with 100% exposure to VX1 (the front-month future) when it’s 30 days from expiration.
• Gradually it rolls from VX1 to VX2 (next-month future) each day to maintain a 30-day average expiration.
• At all times, the index is long either one or both VX1 and VX2, with exposure shifting daily from VX1 to VX2.
• This roll mechanism causes value erosion in contango (normal markets) and gains in backwardation (during volatility spikes).
• Since contango is the dominant market state, the index loses value over time—with occasional short-lived gains during sharp volatility increases.
Importantly, the SPDJ Index does not represent the VIX or any other volatility level, it simply reflects the value of this futures-based rolling strategy.
________________________________________
Breakdown of the ETPs: VXX, UVXY, and SVXY
VXX – Long SPDJ Index (1x)
• Tracks the SPDJ Index directly
• Suffers from the roll-down drag in contango environments.
• Useful only for short-term exposure during expected volatility spikes.
• Timing for long positions is critical
UVXY – Leveraged Long (Currently +1.5x)
• Replicates a strategy that maintains a constant leverage of 1.5 to the SPDJ Index.
• Formerly +2x leverage; reduced in April 2024.
• Highly sensitive to VIX moves; underperforms long term due to both roll-down drag and leverage decay (see below). Timing for long positions is even more important than for the VXX.
SVXY – Inverse (-0.5x)
• Replicates a strategy that maintains a constant exposure of -0.5 to the SPDJ Index.
• Benefits from falling VIX levels as well as from contango in the front part of the VIX futures curve.
• Formerly -1x before the Feb 2018 volatility spike triggered massive losses (XIV, a competing ETP, collapsed at that time).
• Performs well in calm conditions but is vulnerable to sharp volatility spikes.
Leveraged & Inverse ETPs – Important Notes affecting the UVXY and SVXY (without going into details):
• Daily resetting for the replicating strategies to maintain constant exposure factors (different from 1x) are pro-cyclical and can cause compounding errors, specifically in turbulent markets (e.g. Feb 2018).
• The real volatility of the VIX futures itself acts as a drag on returns, independent of the index’s direction.
• Risk management is essential—especially with inverse products like SVXY.
All three of these ETPs track a VIX futures strategy, they are not levered or unlevered versions of the original VIX index. Each of these ETPs benefits from liquid option markets, enhancing the toolkit for volatility trading.
Trading Strategies Using VIX ETPs
Here are several practical approaches to trading these products:
VXX and UVXY
• Best used for short-term trades aiming to capture volatility spikes.
• Options strategies such as zero-cost collars, vertical and calendar spreads can help mitigate the challenge of precise timing.
• Avoid long-term holds due to erosion from roll-down and leverage decay (see historical performance!).
SVXY – The Carry Trade Proxy
• Ideal for profiting from prolonged calm periods and the contango structure.
• Acts like a carry trade, offering a positive drift—but must be paired with robust stop-loss rules or exit strategy to guard against sharp spikes in volatility.
Switching Strategies
• Tactically rotate in/out of SVXY based on short-term volatility indicators.
• One common signal: VIX9D crossing above or below VIX, i.e. long SVXY if VIX9D crosses under VIX, staying long while VIX9D < VIX, closing long SVXY position when VIX9D crosses over VIX. Some traders also use crossovers with VIX3M or the individual expirations of the VIX futures curve to manage entries.
• Switching between SVXY and VXX based on crossover triggers through the VIX futures curve is often advertised, but very hard to get working in practice due to the importance of timing the VXX entry and exit – signals from the VIX curve may not signal VXX entries and exits timely enough.
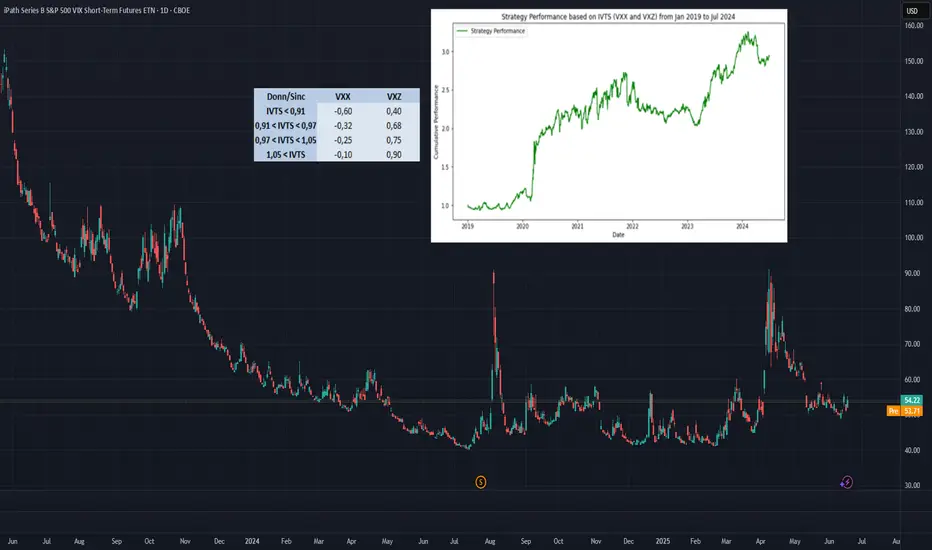
Term Structure-Based Combinations
• Combine short VXX with long VXZ (an ETP tracking longer-dated VIX futures, balancing the 4th to 7th VIX contracts to achieve a constant expiration of 60days).
• Weighting is determined by the Implied Volatility Term Structure (IVTS), calculated as VIX / VIX3M. This approach adjusts positions based on the shape of the VIX futures curve, indicated by the IVTS. For instance, when the VIX futures curve shifts from contango (where near-term futures are cheaper than longer-term ones) to backwardation (where near-term futures are more expensive), it involves reducing short positions in VXX and increasing long positions in VXZ.
• This approach mimics the spirit of a calendar spread strategy in VIX futures and reflects the “S&P 500 Dynamic VIX Futures Index” , with weightings backed by research from Donninger (2011) and Sinclair (2013) - see performance chart and weighting-matrix enclosed in the introductory chart).
________________________________________
VIX Curves as Market Indicators
Beyond trading, VIX instruments and their term structure are widely used as market sentiment gauges. For instance:
Signs of Market Calm:
• VIX9D < VIX
• VIX < VIX3M
• VIX < VX1
• VX1 < VX2
These relationships imply that short-term volatility is lower than longer-term expectations, indicating near-term calmness in markets, occasionally leading to market complacency.
Traders and institutions use these signals to:
• Adjust positioning in broad market indices
• Determine hedging requirements
• Evaluate suitability of selling naked options
________________________________________
Final Thoughts
VIX ETPs offer a powerful toolkit for traders seeking to profit from or hedge against volatility. But they come with structural decay, leverage dynamics, and curve risk. Timing, strategy, and risk control are key.
Volatilityindex
The VIX: A Measure of Market FearThe VIX, or Volatility Index, is a measure of the expected volatility of the S&P 500 index over the next 30 days. It is calculated using the prices of options on the S&P 500 index. A higher VIX indicates that market participants are expecting more volatility in the future, while a lower VIX indicates that they are expecting less volatility.
The VIX is an important tool for investors because it can help them understand how risky the stock market is. A high VIX indicates that the market is expected to be volatile, which means that there is a greater chance of large price swings. This can make investing more risky, but it can also create opportunities for profit.
The VIX is also correlated with the S&P 500 index. This means that the VIX tends to move in the opposite direction of the S&P 500. When the S&P 500 falls, the VIX tends to rise, and when the S&P 500 rises, the VIX tends to fall. This correlation is not perfect, but it is strong enough to be useful for investors.
The VIX can be used in a variety of ways by investors. Some investors use the VIX to assess the risk of their portfolios. Others use the VIX to trade volatility, either by buying or selling VIX futures contracts. Still others use the VIX to hedge against risk in other assets.
The VIX is a complex and volatile asset, but it can be a valuable tool for investors who understand how to use it.
Here are some additional things to keep in mind about the VIX:
The VIX is not a direct measure of the volatility of the stock market. It is a measure of the expected volatility, which means that it is based on the opinions of market participants.
The VIX can be affected by a variety of factors, including economic news, political events, and natural disasters.
The VIX is not always accurate. It can sometimes overshoot or undershoot the actual volatility of the stock market.
Despite its limitations, the VIX is a valuable tool for investors. It can help investors understand the risk of the stock market and make informed investment decisions.
I hope this post is helpful.
This analysis represents my thoughts at the date it is posted.
This analysis does not represent professional and/or financial advice.
You alone assume the sole responsibility of evaluating the merits and risks associated with the use of any information or other content found on this profile before making any decisions based on such information.

What is a Spread in Forex?Hello hello! In this post, we'll take a look at the basic principles behind the spread in forex market and why it is important.
In the foreign exchange market, the spread is the difference between the bid price and the ask price for a particular currency pair. The bid price is the highest price that a market maker is willing to pay for a currency, while the ask price is the lowest price at which a market maker is willing to sell the same currency. The spread, therefore, represents the cost of trading a particular currency pair.
When trading in the forex market, traders usually buy a currency at the ask price and then sell it at a higher bid price, hoping to make a profit. The spread is the difference between the two prices and it represents the trader's cost of trading that currency pair.
The spread is usually expressed in pips, which is the smallest unit of price change in the forex market. For example, if the bid price for EUR/USD is 1.0735 and the ask price is 1.0740, the spread would be 5 pips.
The size of the spread can vary depending on the currency pair being traded and the market conditions. Some currency pairs, such as the major pairs like EUR/USD, USD/JPY, and GBP/USD, tend to have relatively tight spreads, while others, such as the exotic pairs, can have wider spreads. Also, the spread can vary depending on the trading conditions, for instance, during high volatility period, such as economic news release, the spread tend to widen.
In forex trading, traders should always be aware of the spread as it represents a cost of trading and it affects the trader's potential profits and losses. Spreads are usually factored into a trader's profit and loss calculations and it is important to consider the spread before opening a trade. Some brokers also offer variable spreads and fixed spreads, it is important to be aware of the difference between the two.
Many online forex brokers now offer variable spreads, which means that the spread will change depending on the market conditions, but some brokers also offer fixed spreads, which means that the spread will remain the same regardless of market conditions.

INDIAVIX EDUCATIONAL(1)What is India VIX or India Volatile Index?
-India VIX or India Volatility Index is a volatile index that is calculated by the NSE to measure the market’s anticipation for volatility and fluctuations in the near term.
-A lower VIX signifies low volatility and a stable range for the asset price.
-A higher VIX implies high volatility and a lack of confidence among investors to trade in the current market range. Usually, it is an indication of a significant directional movement in the market marked with the broadening of the current range.
-So, if the value of the India VIX index shows a rise, then the expectation of traders should be a high level of volatility. This translates to a considerable shift in the NIFTY index. If the value is low, this indicates a lower expectation of volatility, and that means hardly any change in the NIFTY index itself.
(2) What is Volatility?
-Volatility refers to periods of unpredictability when security prices go through rapid fluctuations. Often people associate volatility with price falls. But it can also happen in an uptrend.
(3) What is the reason behind this surge in INDIAVIX?
- The volatility is caused by Covid-related concerns as coronavirus cases have risen in foreign nations like China and the US and its consequent impact on India.
If we see on the basis of technical it's reacting from the zone which was held perfectly multiple times in past.

BTCUSD May See A Slow Down Based On Bitcoin Volatility IndexHello traders!
Today we will talk about Bitcoin Volatility Index and we will show you how to understand and read it compared to the BTCUSD chart using Elliott Wave theory.
Well, BTCUSD is in an impulsive rise from March lows and currently we are observing the final wave 5, mainly because of a rise out of wave 4 triangle, which in EW theory suggests the final move before we may see a deeper A-B-C corrective decline.
If we take a look at the BTC Volatility Index chart, we can see it approaching the lows again. And always, when BTC Volatility comes to the lows, we can expect some big action and huge volatility, especially if this is a wave 5 of a bigger ending diagonal.
So, considering that BTCUSD can be finishing wave 5 and BTC Volatility Index coming to the lows, we should be aware of a bigger corrective decline soon, ideally somewhere here at the end of August and beginning of September.
If you like what we do, then please like and share our idea.
Be humble and trade smart!
Disclosure: Please be informed that information we provide is NOT a trading recommendation or investment advice. All of our work is for educational purposes only.

VIX: at 12 in Pivot ZoneSimple idea. In May & Aug VIX tapped 12 briefly before volatility returned. Here we are again.
There is a bullish trend ongoing with successively weaker spats of volatility. Next jump might tap 18-20.
The interval of rotation appears to be three months; May +3mo > Aug +3mo > November. Prices at ATH; rotation soon seems likely.
This is rank speculation and in no way constitutes investment advice; trade at your own risk; GLTA!
