BTCUSD – Outlook for the Coming MonthMonthly View
The monthly timeframe remains bullish overall, but Bitcoin has pulled back to gather strength. This kind of move is typical when the market is gearing up to break a higher high. The broader structure hasn’t shifted—this is simply a deeper retracement inside a bullish narrative.
Weekly View
The weekly chart is showing a similar story. Price has been dropping consistently without giving even a single proper reversal. If BTC truly wanted to fall aggressively, it would normally make a move up first, trigger traders’ stop-losses near previous highs, and then dump. But this time, it didn’t do that.
This unusual behavior hints that the market may be preparing something different from what most traders expect.
Daily View
The daily timeframe is where things get really interesting. Bitcoin spent more than half the recent sessions moving sideways, collecting liquidity on both sides. After that, it dipped and formed a lower high—but that lower high hasn’t been broken yet.
According to my analysis, BTC is currently sitting in the Discount Zone, an area where buyers often start becoming active.
4-Hour View
On the 4H chart, I already had a clean short setup earlier, but now I’m watching for signs of a potential reversal. That reversal idea is not guaranteed, though—it becomes invalid if BTC fails to break the series of lower highs.
There’s also another scenario: BTC might refuse to break the lower highs and begin forming higher lows at the same time. If that happens, we’ll see a period of sideways consolidation. When the breakout finally comes—whichever direction it chooses—the move is likely to be powerful.
Final Thoughts
Based on my analysis, BTC is showing mixed but promising signals across the higher and lower timeframes. The monthly structure is still bullish, and this pullback looks more like preparation for a stronger push rather than a trend reversal. Weekly price action hasn’t shown any meaningful bounce yet, which is unusual—and that alone hints that the market might be setting up something unexpected.
On the daily chart, BTC has swept liquidity after moving sideways for quite a while, and now it’s resting in the Discount Zone, where smart money usually becomes active. The 4H timeframe already gave clean short opportunities earlier, but now the market is approaching a point where a reversal could begin—unless lower highs remain untouched.
If BTC starts forming higher lows without breaking lower highs, the market will likely slip into a compression phase. When price finally breaks out of that squeeze, the move—up or down—can be very strong.
Again, this is just my personal viewpoint. Please do your own analysis before investing. Your profits and losses are entirely your responsibility—I’m only sharing what the charts are suggesting to me right now. Stay alert to the reaction levels ahead; that’s where the next major direction will reveal itself.
----------------------------------------------------------------------------------------------
Thanks for checking out this analysis! If you enjoyed it, hit that follow button so you don’t miss future updates. And if this breakdown helped you out, drop a like 👍 and share your thoughts in the comments 💬—I always appreciate the feedback!
1-BTCUSD

BTC/USDT - Make-or-Break Demand Zone: Reversal or Breakdown?Bitcoin is now entering one of the most critical zones of its mid-term market structure. After a sharp decline from the 126k peak, price is sliding into the major demand block at 83,000–78,000, a region that previously acted as a springboard for the rally earlier this year.
This 3D chart clearly highlights a structural decision point:
➡️ Hold this zone → strong bullish continuation potential
➡️ Lose this zone → the market opens room for a deeper macro correction
The next few candles in this zone will shape the direction of the entire Q4–Q1 trend.
---
Why This Yellow Block Matters
The 83k–78k zone is not random. It represents:
The origin of a previous rally, where institutional buying stepped in aggressively
A macro demand cluster, confirmed by multiple touches and consolidations
A liquidity “rebalance zone”, often retested before trend continuation
A structural higher-low area in the broader bullish cycle
If BTC wants to maintain a macro uptrend, this is where buyers must show up.
---
Market Structure & Pattern Description
The chart shows a macro uptrend, followed by a deep correction from the top.
Price is now approaching the key retracement zone of the previous expansion.
This area previously formed a base pattern before the 50k → 126k breakout.
Candles entering the demand zone show seller exhaustion signals, but no confirmation yet.
A reversal pattern here (engulfing, long-wick rejection, inside bar break) would be the first bullish signal.
A clean 3D close below 78k would convert this demand zone into supply — a strongly bearish structural shift.
This is the type of zone where trends are born or destroyed.
---
Bullish Scenario (Reversal from 83k–78k)
For the bullish thesis to remain valid:
🔥 Conditions Needed
Rejection wick or bullish engulfing on the 3D timeframe
Higher low confirmation on daily
Return above key short-term resistance around 92,400
🎯 Bullish Targets
TP1: 92,000 (short-term reclaim)
TP2: 110,000 (macro mid-range)
TP3: 126,000 (previous high → breakout zone)
If buyers defend this zone, BTC maintains its macro bullish structure.
❌ Bullish Invalidation
A 3D full-body close below 78,000
Followed by failed attempts to reclaim the zone
---
Bearish Scenario (Breakdown of 78k)
If price fails to hold the demand block:
🔥 Breakdown Confirmation
Strong 3D candle close under 78k
Retest of 78k–83k as resistance
Increasing selling volume
🎯 Bearish Targets
Target 1: 72,000 (major liquidity zone)
Target 2: 62,000 range
Target 3: 49,000 (macro support from prior cycle)
A breakdown here would confirm a macro correction, not just a pullback.
❌ Bearish Invalidation
Price quickly reclaims 80k–83k with momentum
Failed retest turns into a deviation
---
Trading Notes
This is a macro (3D) zone — be patient.
Let confirmation develop, avoid knife-catching.
Use wide stops; 3D signals require larger breathing room.
Watch volume:
Increasing volume near the bottom = accumulation
Increasing volume on breakdown = distribution
#Bitcoin #BTCUSD #BTC #CryptoMarket
#PriceAction #DemandZone #CryptoTA #BullishScenario #BearishScenario #MarketStructure #CryptoOutlook #MacroAnalysis

GBPCHF outcome.GBPCHF making higher highs and higher lows consistently. Now in the consolidation zone. Let's see if it will continue to climb going into London session.

Bitcoin Holds 90k (For Now), 70k A Real PossibilityMy bearish bitcoin target outlined in the middle of October came to fruition this week. I update my levels and technical reasoning as to how it could still head for 70k after a potential bounce.
Matt Simpson, Market Analyst at City Index

What A Shocker That Would Be Huh?Blackrock, Saylor and gang are in for some big gains. As for most of you who sold you're in for a rude awakening!
What A Shocker That Would Be Huh?Blackrock, Saylor and gang are in for some big gains. As for most of you who sold you're in for a rude awakening!
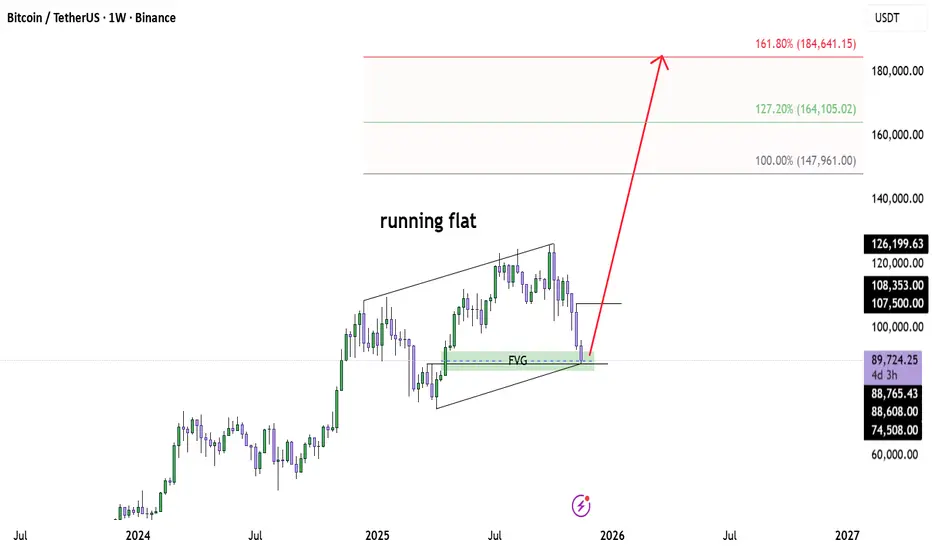
Bitcoin Macro Support Hit — Bull Cycle Ready to ExtendBINANCE:BTCUSD BINANCE:BTCUSDT
Bitcoin just tapped the weekly FVG + channel support, completing what looks like a running flat correction.
This zone has acted as a major demand area, and price reacted exactly where a higher-timeframe Wave 2 should finalise.
As long as BTC holds above this green support block, the bullish macro structure stays intact.
Upside targets for the next impulsive leg are:
147,961 (1.0 extension)
164,105 (1.27 extension)
184,641 (1.618 extension)
If this running flat is confirmed, Bitcoin may be entering a large Wave 3 — historically the most explosive phase.
Still watching weekly close for validation, but momentum is shifting.
⚠️ Disclaimer
This analysis reflects my personal view based on market structure and Elliott Wave principles.
It is not financial advice.
Always do your own research and manage your risk — the market doesn’t forgive careless entries.
BTC hitting the Monthly 20EMA supportBTC has touched the Monthly 20EMA (overlayed on this 4H chart) on a huge sell off, should make a strong bounce here or it's off to the pits of hell going into December.

BTC/USDTPERP BinanceBTC/USDTPERP Binance
1D hollows
As we saw in a previous chart, since the price broke the support point of approximately $108,000, a price drop of 12.58% followed in a period of three days.
An uptrend diagonal line has formed on the chart.
The price should have stayed above this uptrend line.
So since it broke downwards, the price should then touch the support level as seen from $87,470 - $91,781.
The support area results as an extension of the Fibonacci retracement, to the exact point of the golden ratio, which is 0.618 and 0.666.
The price is expected to reach the support area and we will see a price rebound.
Crypto Market Cap: $3.26T +1.61%(24h)
Bitcoin Dominance
Bitcoin: 58.7% -0.15%
Ethereum: 11.9% -0.97%
Others: 29.4% +1.13%
Good Luck
#CryptoHellas Team
16/11/2025

The key is whether support can be found around 89294.25
Hello, fellow traders!
Follow us to get the latest information quickly.
Have a great day.
-------------------------------------
(BTCUSDT 1D chart)
This period of volatility is expected to last until November 22nd.
If the price fails to find support and rise near the M-Siganl indicator on the 1M chart after this period of volatility, it is likely to decline to the 69,000-73,499.86 level.
Therefore, the key question is whether it can find support and rise near the HA-Low indicator level of 89,294.25 on the 1D chart.
-
(1M chart)
It is showing a downward trend, failing to reach the Fibonacci ratio 2.618 (133,889.92), which was considered the target level.
However, if the price maintains above the 69,000.0-73,499.86 level, it is expected to maintain an upward trend in the long term.
-
(1W Chart)
If the price rises above the HA-High indicator, it is likely to form a stepwise uptrend.
Since a stepwise uptrend usually ends in a decline, this decline could be a sign of a bearish trend.
The M-Signal indicator on the 1M chart can be used as a benchmark for bullish and bearish trends.
Therefore, if the price remains below the M-Signal indicator on the 1M chart, it should be considered a bearish trend and a response should be considered.
However, considering the overall trend of BTC, the most important range is the 69,000-73,499.86 range. As long as it does not fall below this range, the price is expected to maintain an upward trend in the long term.
-
Thank you for reading to the end.
I wish you successful trading.
--------------------------------------------------
- This is an explanation of the big picture.
(3-year bull market, 1-year bear market pattern)
I will explain in more detail when the bear market begins.
------------------------------------------------------

BITCOIN – THE TIDES ARE TURNING Traders,
On November 5 I mapped out a scenario where Bitcoin would push into 107k to 108k and then decline to 98k first and 89k second.
This entire scenario has now played out perfectly to the pixel. We swept 108k, we dumped to 98k, and then we flushed into 89k. Where I expected price to retrace from exactly this level: $88.912
So the real question now is simple. What now? Do we break lower, or do we go up?
Let’s break Bitcoin down cleanly, without bias, and only by reading structure, levels, and order flow.
Levels, Structure and Order Flow
AVWAP at the core of the structure
Bitcoin is currently trading right near the AVWAP from the 06 August 24 anchor. This is the blue line on your chart and the exact level is 90.881. This anchor began with a large volume impulse.
When heavy volume kicks off a leg, the AVWAP from that point becomes a core reference level for the entire future auction. We are now sitting right on top of it, which is exactly where you would expect absorption or a strong reaction.
The market is basically deciding if this AVWAP will hold or break.
AB=CD completion
The full AB=CD measured move has completed exactly into the AVWAP zone. This is a clean harmonic completion and adds confluence to why price reacted here. AB=CD means the downside leg is symmetrical and usually marks exhaustion inside a trend.
Fixed Range Volume Profile
Using a FRVP from the start of the current HTF auction (07 April until now), we see price wicked directly into the LVN that sits inside the weekly FVG. This area had imbalance and low participation. A wick into an LVN inside an FVG often means that the inefficiency is now cleaned and the auction has reached completion for that side of the range.
Wedge breakout
Bitcoin technically broke out of the falling wedge, but the breakout does not look clean.
We are outside the wedge, but momentum on the breakout is weak. True confirmation would come if price re-enters the wedge from the outside and climbs back through the wedge body.
Re-entering the wedge tells you that the breakdown was liquidity and not a structural continuation. If we reclaim it, upside targets become more likely.
Order Flow – What the data shows
Spot and Futures CVD
Across the 15m, 30m and 1h charts, Spot CVD is forming a bullish divergence. Price keeps making lower lows, but Spot CVD is holding higher. This shows that spot buyers are stepping in at the lows and absorbing sell pressure.
Futures CVD on both stablecoin margined and coin margined contracts continues to push lower.
Price is not following these lower lows. This creates hidden bullish divergence and confirms that aggressive sellers are hitting the market while limit buyers are absorbing the pressure.
This is a classic sign of absorption. Selling continues, but the market is refusing to break lower with the same intensity.
Open Interest – A shift
Earlier in the dump, Open Interest was falling. This means positions were being closed.
Most of this was shorts taking profit or exiting the move. When OI drops during a downtrend, continuation becomes harder because the move loses fuel.
Near the end of the screenshots, there is a shift. Both stablecoin margined and coin margined OI start to rise again.
This rise in OI happens while:
CVD continues to make lower lows
Price stops making new lows
Price begins to stabilize
This tells us that new positions are being opened at the lows. Given the CVD behavior, most of these are new shorts entering the market.
When new shorts enter and price does not break, the probability of those shorts becoming trapped increases. If buyers step in, this setup often leads to a short squeeze.
This is how reversals form in a controlled market.
Funding rate – Binance
Funding is positive but very small. This means there is no extreme long pressure. There is no overcrowding on the long side. The market is not stretched. With fresh shorts entering at the lows and funding staying neutral, the market can turn quickly if support holds.
What this means
The combination of:
Spot CVD divergence
Hidden bullish divergence on futures CVD
Rising Open Interest at the lows
Neutral funding
Price refusing to break down - So price needs to hold.
shows that the market is absorbing aggressive selling at a key level. If buyers defend the current level, this can force newly opened shorts to cover, which would fuel the next move up.
Targets
109k
This is the first upside objective.
There is a CME ETH gap resting at this level and gaps of this type tend to get filled.
109k also aligns with the 1.113 Fibonacci extension of the latest wave.
This makes it the first logical level if price continues to hold the AVWAP and absorb selling pressure.
112k
The next major level is 112k.
This area contains single prints on CME and matches an AVWAP level on the BTC CME chart.
112k also lines up with the 1.272 extension of the wave.
From a Fibonacci rotation perspective, 1.272 is the next stop after 1.113 and often acts as a mid-cycle continuation target.
118.800
The final target sits at 118.800.
This is the full 1.618 extension of the wave and mathematically completes the auction.
If the market rotates from AVWAP support, this level becomes the natural endpoint of the move.
As long as price continues to hold the AVWAP at 90.881 and the market keeps absorbing futures selling, all three upside targets remain in play.
Invalidation
The structure changes only if price breaks below 88k. A clean drop under 88k opens the door for the next major high timeframe support at 85k.
85k carries strong confluence. It aligns with the 0.786 Fibonacci retracement on the HTF move and sits directly on a Point of Control zone within the Fixed Range Volume Profile.
Below that level, the auction shifts into a lower structure entirely.
TLDR
Bitcoin completed the downside scenario perfectly.
Price is now sitting directly on the AVWAP at 90.881.
AB=CD is complete.
LVN inside weekly FVG has been cleaned.
Futures CVD is still pressing lower but price is not. That is absorption.
But the key update is OI. OI was dropping earlier on the LTF, but now OI is rising again, and this is happening while CVD continues down and price holds steady.
That means new shorts are entering the market and getting absorbed.
If AVWAP holds, expect a bounce.
Targets:
109k
112k
118.8k
If 88k breaks, 85k is next.
--------
Abbreviation List
AVWAP
Anchored Volume Weighted Average Price. A dynamic support or resistance level based on volume since a chosen anchor.
AB=CD
A harmonic measured move where AB equals CD.
FRVP
Fixed Range Volume Profile. Shows where volume was traded inside a chosen range.
LVN
Low Volume Node. A low interest level where price often rejects strongly.
FVG
Fair Value Gap. An imbalance left by aggressive price moves.
CVD
Cumulative Volume Delta. Tracks buying vs selling pressure.
OI
Open Interest. The amount of open futures positions.
POC
Point of Control. Level with the highest traded volume.
--------
If you like this kind of analysis, drop a like and leave a comment. Everything here is shared for free so more people can cut through the noise and finally see what is actually happening under the surface. No hopium. No fear. Just real data, real structure, and real order flow.
The goal is simple. To help traders stop guessing and start understanding what the market is actually saying.
Stay sharp.
Stay objective.
And remember… the chart whispers long before it speaks.
- ThetaNomad

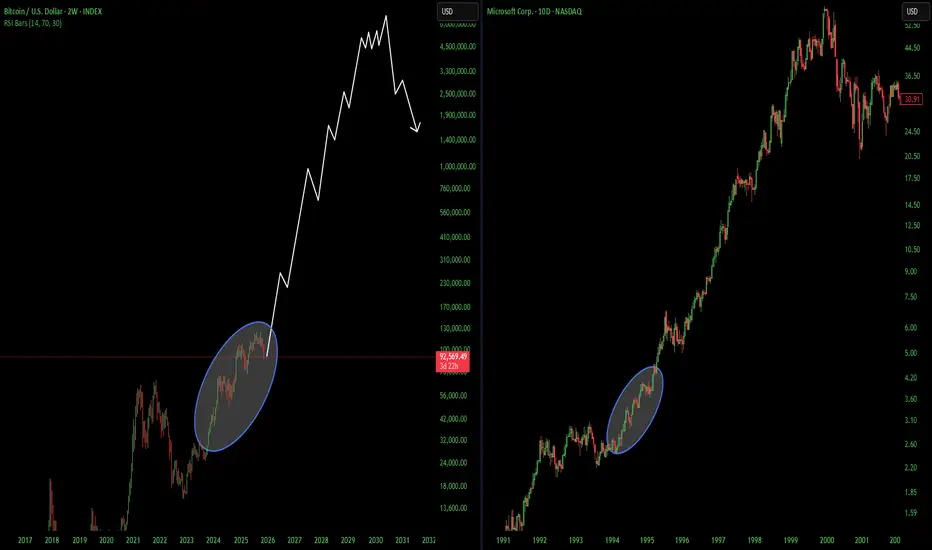
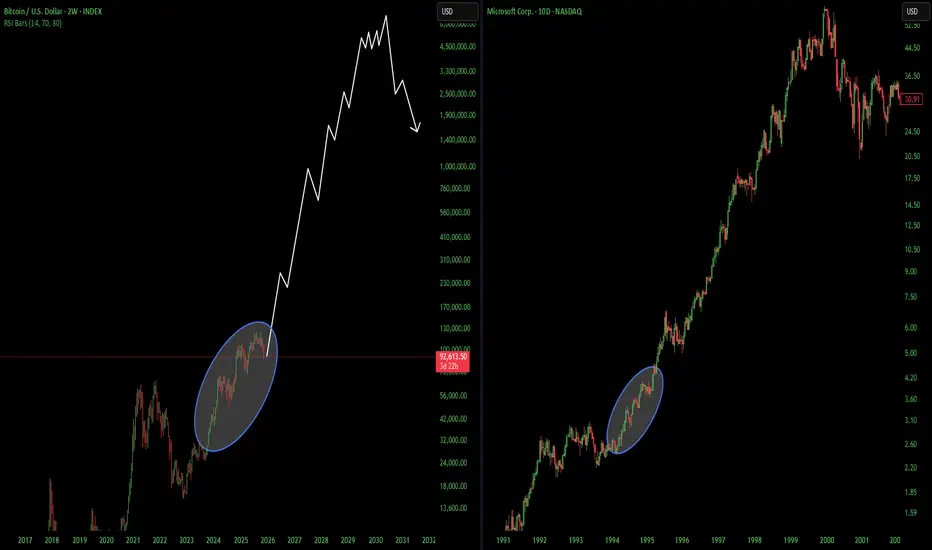
The 2025 structure currently matches ~85% of the 2022 pre-bear Mhistorically BTC often touches EMA89 then retests EMA55 before a bear market and right now the chart structure looks similar to past cycle tops
Scenario A – Reclaim EMA55 (Bullish Recovery)
Chance: ~35%
Must close multiple weekly candles above EMA55
Would signal the bull trend is still intact
Correction becomes similar to 2013/2017 mid-cycle crash
Bullish targets:
$110k
$125k
$135k final blow-off
=============================
Scenario B – Rejection at EMA55 → Full Bear Market
Chance: ~65%
This is the historically normal outcome.
If BTC:
fails to reclaim the EMA55,
AND closes weekly candles below EMA89 →
Then this confirms a macro trend reversal.
Bearish targets (based on past cycles):
First major support: $72k–76k
Cycle bottom zone: $55k–63k
Extreme wick target (like 2020 crash): $48k (low probability)

Bitcoin on a roller coaster: is 2026 ready for a new high?On November 18, BTCUSD fell by about 29% — from a peak of around $126,000 to ~ $89,000 . The fall in Bitcoin was due to a combination of factors: after the record high, many investors took profits, money flowed out of Bitcoin exchange-traded funds (spot ETFs), and caution set in on global markets, with tech stocks and AI companies falling. The sharp price fluctuations triggered forced closures of leveraged trades, which exacerbated the decline, while altcoins fell even faster and drained liquidity from the market — as a result, there were more sellers than buyers, and the price fell even further.
Five reasons to expect a new BTCUSD impulse in 2026:
Inflows into spot ETFs. If funds start actively buying BTC on the spot market again, this will generate stable demand from large players.
The halving effect. Fewer new coins are being mined, but demand remains high, which will eventually push the price up.
A more dovish Fed. Lower rates → more liquidity → investors are more willing to take on risk assets, including BTC.
Clear rules and business acceptance. Clear regulation and integration with banks/companies simplify entry for mass investors.
Infrastructure development. L2/Lightning, convenient custody, and new on-chain use cases make BTC more useful — demand is growing.
FreshForex analysts note that in 2026, Bitcoin's dynamics will largely depend on three factors: capital inflows into spot ETFs, the general “risk-on/risk-off” regime against the backdrop of Fed decisions, and key statements from regulators about the crypto market. Investors are advised to maintain a strict risk management system and focus on the macroeconomic calendar.

Long Term Bitcoin ForecastAlways early, never in doubt
I have already exited my Bitcoin related ( NASDAQ:IBIT Puts) shorts and NASDAQ:MSTR Puts. I felt confident I would be early as that that is my habit. There will undoubtably be a relief rally at some point that I may re-enter. My long term forecast is that the bull phase of the Halvening price cycle has ended and the bear phase has begun. Let's break down each price action component I am watching...
First let's take a step back to learn why we got here.
The false breakout or "Spike" as I call them are one of the most trustworthy signals that I trade. If you study one single element of price action it should be this. When price fails to close above a prior ATH (or below a major low) this is the highest probability of a reversal. Market psychology is on display that traders refused to continue the rally and now many are "trapped". This was the reason for the mass liquidations in October that started this bear trend. Many thought a breakout was in order but the confirmation failed.
One day after the "Trump tweet" the Daily Ichimoku Cloud trend confirmed bearish. This is another indicator of Bitcoin's trend that has been useful for all of Bitcoin's history. It is also what we will evaluate later on the Weekly.
At this point the most important level to watch is the 50% Retracement for the entire bull phase going back to November 2022 low. There are Volume Profile levels to watch but we assume that price will retest the 50% and evaluate what will happen in the Ichimoku Cloud trend context there.
Back in April 2025, when price on the Weekly made a move to the Weekly Ichimoku Cloud, price never hit or got inside the cloud nor did Momentum have a reasonable chance of crossing into bearish. "This time it's different" because if price does test the 50% Retracement it will signal full bearish trend confirmation on the Weekly timeframe.
During the last cycle, the bearish trend ended when the timing element of the Monthly Ichomoku cloud turned upwards. There is a similar timing element on the Monthly now in November 2026.
My fundamental, market psychology based speculation is that the ETF buyers from January 2023 must have their patience tested. That price is around 43k.
TL:DR;
Price will trend bearish down to 43k with the bear phase ending around November 2026.

BTC RETRACEMENT- BUY Bitcoin is pulling back exactly where it should inside the long-term rising channel. Every cycle, BTC hits the top, cools off, and returns to the mid-zone before pushing higher. This retracement isn’t weakness forever, it’s the market resetting, grabbing liquidity, and setting up a stronger base. 🔄
The key buy zones are 83k–86k for the first bounce, and the deeper 64k–68k demand zone if the pullback continues. These levels match past accumulation and trend support, making them solid dip entries before the next move toward new highs. 🚀

Bitcoin (BTC) – What Comes After the Sharp Drop?
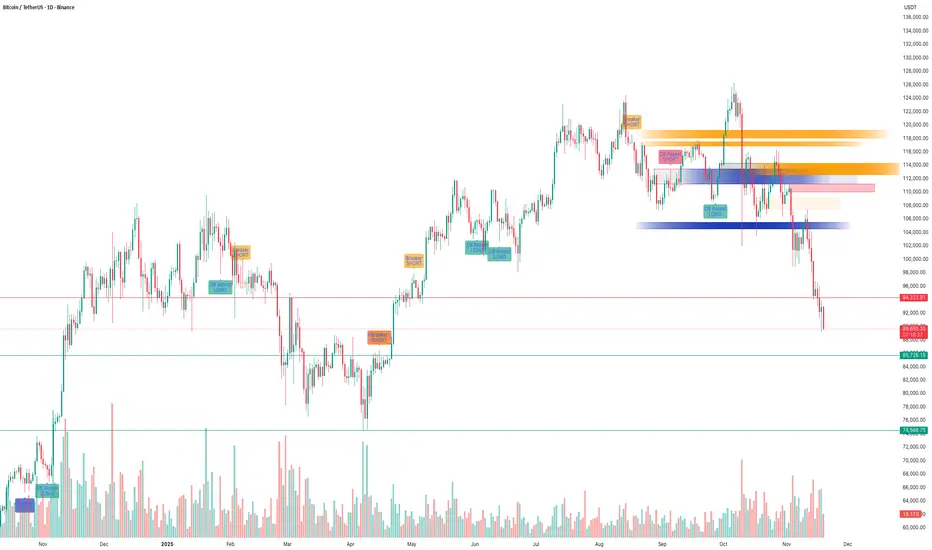
A Technical Outlook Based on Smart Range Zones
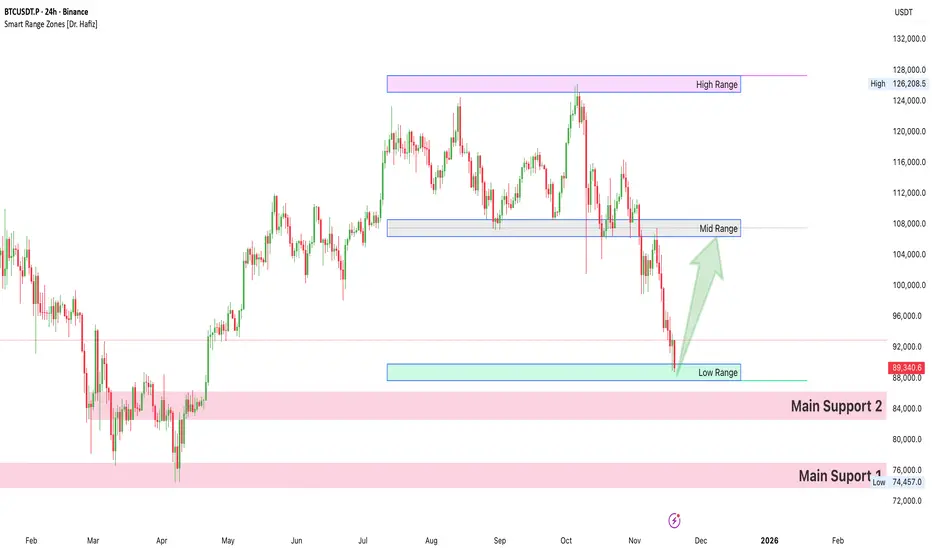
🟦 Introduction
After a strong bearish move, Bitcoin has reached a critical juncture. The recent sell-off has driven BTC directly into the Low Range Zone , an area that historically generates strong reactions and often initiates relief rallies.
The market is now positioned between major higher-timeframe supports and mid-range resistance, making this an important decision point for BTC’s next major direction.
The attached Smart Range Zones chart shows precise High–Mid–Low ranges , plus two deep Main Support Zones, which together build a clear market structure roadmap.
🔍 Detailed Technical Analysis
1. Range-Based Market Structure
Smart Range System has clearly mapped the following key areas:
🔵 High Range Zone (≈ $124,000 – $128,000)
* Represents the upper distribution area.
* Strong supply; previous sell-offs originated from here.
* Bullish momentum must reclaim this zone for any attempt at new ATHs.
🟦 Mid Range Zone (≈ $104,000 – $110,000)
* Former support, now broken strongly.
* Likely to act as major resistance on any relief move.
* A textbook retest zone where trend continuation (bearish) often happens.
🟩 Low Range Zone (≈ $88,000 – $92,000)
* BTC is currently reacting inside this zone.
* Historically, this zone produced the largest bounce in July/August.
* If buyers defend here, a retracement towards Mid Range becomes highly probable.
2. Higher-Timeframe Support Blocks
Below the Low Range, your chart highlights two powerful demand areas:
🟥 Main Support 1 (≈ $74,500 – $76,000)
* Major untested zone.
* If reached, this would likely produce a l arge higher-timeframe bounce .
🟥 Main Support 2 (≈ $82,000 – $86,000)
* First deep HTF support block.
* Lines up with multiple historical volume clusters.
* Ideal for long-term spot accumulation.
If BTC breaks the Low Range cleanly, these supports become the next logical liquidity targets.
3. Price Action & Candle Behavior
* Long downward wicks inside the Low Range show buyer absorption .
* Momentum is slowing down, suggesting sellers are losing dominance.
* Strong, impulsive candles earlier indicate panic liquidation likely cooled off.
4. Market Sentiment & Liquidity
* The decline aligns with high-leverage liquidations.
* Fear index likely elevated, which historically aligns with bottom-zone entries.
* BTC dominance stable: no major altcoin rotation yet.
* Macro news still cautious but not aggressively bearish.
Sentiment currently favors a t echnical bounce rather than a full trend reversal.
📈 Potential Scenarios for BTC’s Next Move
🟢 Scenario 1: Relief Rally Towards Mid Range (Most Probable)
* BTC holds the Low Range (88k–92k).
* Short-sellers take profit → push price up.
* A bounce to 103k–110k (Mid Range) is likely.
* Here, BTC will face major resistance.
Key Level to Break for Bullish Continuation:
👉 **$110,000**
🔵 Scenario 2: Consolidation in Low Range (Neutral)
BTC may:
* Move sideways between 88k–95k
* Build a base for a stronger directional move
* This is typical after sharp drops
A consolidation would be healthy and would prepare liquidity for the next impulse.
🔴 Scenario 3: Breakdown Toward Main Supports (Bearish Extension)
If buyers fail to defend the Low Range:
First Target
👉 Main Support 2 (82k–86k)
Second Target (Max Pain Zone)
👉 Main Support 1 (74k–76k)
A drop this deep would require:
* Macro panic
* Major liquidation cascade
* Loss of current structural support
🎯 Summary
* BTC has entered the Low Range Support Zone , a historically strong reaction area.
* A bounce toward Mid Range (98–102k) is currently the highest-probability scenario.
* Failure to hold this zone opens deeper targets at 86k and 76k.
* Traders should monitor the Low Range for confirmation signals.
Bitcoin approaching major buying opportunity of the year!Here we go are you ready for another major buying opportunity in bitcoin! Key levels to watch for. Ignore the fud!

BTC WARNING!⚠️ WARNING:
I’m giving this to you straight, no filter.
Bitcoin is now staring down a very real chance of not making a new high for up to 4 years, and historically that kind of setup has come with –80% drawdowns.
That would drop the total market cap to roughly $500 billion.
Social media makes it look like “everyone is buying,” but the truth is the world has run out of fresh Crypto Bros with Lambo fantasies willing to chase this thing at any price. The buyers are tapped out.
No sugarcoating it: GTFO & STFO.
And on a positive note —
THANK YOU for helping me hit 5,000 followers! 🙏🔥
Let’s keep going.
If you find value in the work:
👉 Boost
👉 Follow
👉 Leave a comment
Let’s push to 6,000 and keep building a community rooted in facts, not fairy tales.

BTC/USD - Order Block Retest Sets $93K vs. $86K DecisionKey Technical Observations
• Order Block (OB) Identification: The red rectangular zone, approximately between $89,500 and $90,000, is labeled as an OB. This zone represents a price level where institutional orders were likely executed, making it a critical area of potential support or resistance when the price revisits it.
• Current Price Action: The price is currently retesting the lower boundary of this OB, trading at approximately $89,320.31.
• Dual Possibilities: The chart illustrates two potential paths forward, suggesting a high-volatility decision point at the current level.
📈 Scenario 1: Bullish Reversal (Uptrend Continuation)
• Condition: The price successfully holds the Order Block (OB) area as support and shows a strong rejection of the lower prices. This would imply that the buy-side institutional orders at the OB were successfully 'filled' and are now pushing the price back up.
• Entry Signal: A clear break and close of a 30-minute candle above the OB (e.g., above $90,000) or a bullish candle pattern forming right on the support.
• Target: The move is projected to target the upper level at approximately $93,000.
📉 Scenario 2: Bearish Breakout (Downtrend Continuation)
• Condition: The price breaks decisively below the Order Block (OB) area. This would indicate that the selling pressure has overwhelmed the buy orders in the OB, leading to a breakdown of a key structural level.
• Entry Signal: A clear break and close of a 30-minute candle below the OB (e.g., below $89,500) and/or confirmation of the OB zone flipping to new resistance on a retest.
• Target: The move is projected to target the lower level at approximately $86,000.
🔥 Trade Strategy Recommendation
Traders should wait for confirmation of which scenario is playing out:
1. For a Long Position (Scenario 1): Wait for a strong bounce and candle close above the OB zone to confirm support is holding, with a stop-loss placed just below the low of the OB structure.
2. For a Short Position (Scenario 2): Wait for a clear 30-minute candle close below the OB zone to confirm the breakdown, with a stop-loss placed just above the high of the OB structure.
Disclaimer: This is a technical analysis based on a single chart and does not constitute financial advice. Always perform your own research and manage your risk carefully.

BTC At Sub 80k? The Structure Says It’s PossibleBTC has followed one pattern for two years.
Every major pullback reset 33–34% before the next leg up.
Look at the last cycles:
• 2024 dropped 34% from January to December
• Oct 2024 → Jan 2025: new highs, then a 33% retrace across four months
• Apr 2025 → Oct 2025: price ran from 74k → 125k, then stalled
• Every breakout in this range ended with the same size correction
The structure didn’t change. The market behaved the same every time.
From the 125k top, BTC still has room to drop 10–15%.
If the cycle repeats, the retracement lands near 80k before the next push.
History doesn’t repeat perfectly, but BTC has been consistent with this pattern.
I’m watching the range. My shorts stay open.

BTC – SMC Suite Follow-Up: Liquidity Grab at 116K and the Drop!!BTC – SMC Suite Follow-Up: Liquidity Grab at 116K and the Drop That Followed
This is a follow-up to my earlier idea “ BTC – Liquidity Grab at $116K Before Deep Correction? ” where I highlighted the danger of price trading into stacked SMC levels on the 1D chart.
1️⃣ Quick recap of the original idea
In the previous post, price was trading around the $112K–$116K zone.
Using the SMC Suite on the 1D chart, I highlighted:
• A high-timeframe supply / OB cluster around 116K.
• A liquidity grab above prior highs – price spiked into fresh liquidity sitting above the range.
• A confluence of Breaker + OB Re-test + FVG acting as a “danger zone” for fresh longs.
• The idea that this move could be a distribution / liquidity grab before a deeper correction.
The key message was: this is not a safe place to be aggressive long; watch for rejection and potential downside.
2️⃣ How price reacted afterwards
Since that post:
• Price respected the 116K zone as supply – every attempt to hold above it failed.
• The highlighted OB + Breaker block acted as a ceiling; price consolidated there and then rolled over.
• After losing the mid-range structure, BTC started a trend of lower highs and lower lows , confirming distribution.
• We have now traded all the way down into the d emand / support zones below 92K and then lower , which were also plotted in advance by the same SMC levels.
In simple terms, the area we marked as a “ danger zone for longs ” turned out to be the top of the move before this large downside leg.
3️⃣ What the SMC levels showed well
This move is a nice case study of how the SMC concepts aligned:
• Liquidity Sweep : Price ran above previous highs into fresh liquidity, then failed to hold.
• Breaker + OB Re-test : Former demand became supply; retest of this breaker block rejected price.
• FVG + Imbalance Zones : Upside imbalances got filled and then flipped into resistance.
• Structure Shift : After the rejection, market structure shifted bearish with clean breaks of prior swing lows.
None of this is about “perfect prediction”, but about reading where smart money might be offloading risk and where retail is most vulnerable.
4️⃣ Takeaways & what I’m watching next
• HTF SMC levels matter. When multiple concepts cluster (Breaker, OB, FVG, previous highs), treat that zone with respect.
• Liquidity grabs at highs are great warning signals – especially when followed by a clear structure shift.
• For now, I’m watching how price behaves around the current demand zones and whether we see:
• Strong rejection + reclaim of broken levels (potential swing-long areas), or
• Continuation of lower highs pointing to further downside.
This post is for educational purposes only, not financial advice.
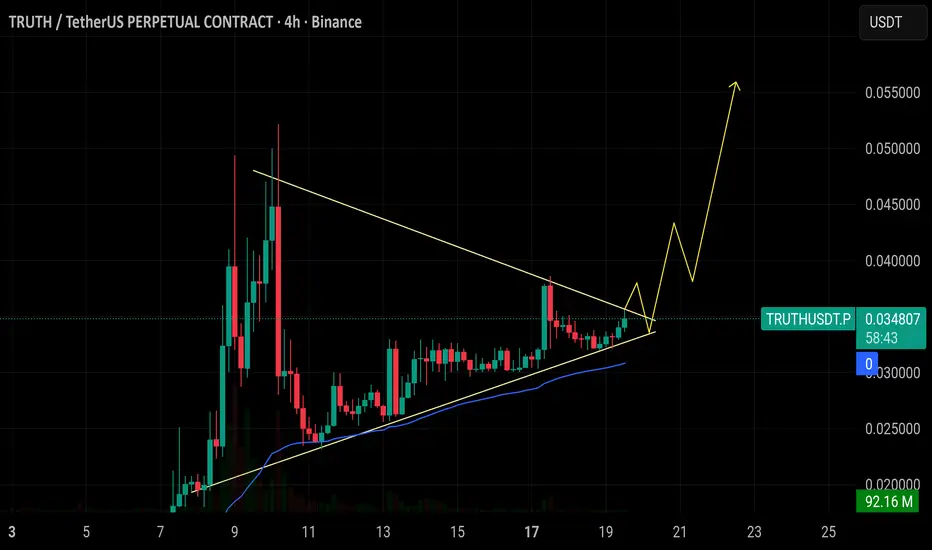
$TRUTH is pressing right at the breakout point of a symmetrical $TRUTH is pressing right at the breakout point of a symmetrical triangle, riding strong ascending support as the range tightens. If this zone holds, the triangle breakout path activates momentum can accelerate quickly above the trendline, targeting the 0.055 zone.
BITCOIN (BTC) — THE FALL HAS ONLY JUST BEGUN⚠️ THE GREAT BITCOIN REVERSAL — THE STORM NO ONE IS READY FOR ⚠️
For years, Bitcoin INDEX:BTCUSD climbed with the arrogance of a king convinced its throne was eternal.
But every empire falls.
And the chart…
The chart has been whispering the truth long before anyone wanted to hear it.
Today, that whisper has become a SCREAM. 📉⚡
🔥 1. The Final Wave Has Broken — and So Has the Illusion
The macro Wave 5 top is in.
Perfect confluence.
Perfect exhaustion.
Perfect euphoria.
The same pattern that ended EVERY Bitcoin mega-cycle… just printed again.
This wasn’t a top.
It was THE top.
The moment the bull cycle let out its final breath. 💀📈
🩸 2. Smart Money Has Already Left the Building
While retail celebrated “new highs,” Smart Money carved out:
• Stop hunts
• Liquidity grabs
• Breaker blocks
• Distribution ranges
• A devastating SOW
• And the cleanest market structure break BTC has shown since 2018
Institutions aren’t buying dips.
They are offloading the mountain .
The crowd doesn’t see it — yet.
⚡ 3. A Market Structure Collapse Echoing 2014, 2018 and 2021
Each cycle’s death began the same way:
A gentle pullback…
A sudden rejection…
Then a violent swing failure ,
followed by the HTF structure snapping in half.
That exact sequence is happening right now .
This is not a correction.
This is a cycle reset .
🎯 4. Fibonacci Retracements Don’t Lie — They Warn
Every true macro Wave 2 in history has returned to:
🔻 0.786
🔻 0.886
🔻 1.0 – 1.618 extensions
Where do they converge this time?
👇
🔮 $6,000 – $1,250
The forgotten land of 2017 mania…
A level BTC has avoided for 8 years.
But the cycle demands balance.
And balance always returns.
🌪️ 5. Price Action Has Flipped From Confidence to Panic
The candles have changed character:
• Weak closes
• Long tall wicks of rejection
• Failed rallies
• Imbalances breaking lower
• Bull traps everywhere
• A violent displacement to the downside
This isn’t cooling off.
This is unwinding.
📉 6. Market Cycle Psychology Has Entered Its Darkest Phase
We just exited Euphoria.
We are in Complacency.
Next comes:
😨 Anxiety
😱 Fear
💀 Capitulation
🔥 Anger
🌑 Depression
Only after that does a new accumulation begin.
And that’s why Wave 2 is infamous.
It destroys what Wave 1 built.
🚨 THE VERDICT: THE DOWNFALL IS IN MOTION — AND WE ARE EARLY
From $126K to $90K was not the crash.
It was merely the first spark in a forest full of dry leaves.
Wave A has barely begun.
Wave B will deceive.
Wave C will devastate.
The endgame target remains:
🎯 $1,250 – $6,000
The cycle reset.
The cleanse.
The opportunity of the decade — but only after the fire burns everything above it.
🔥 This is not fear. This is structure, math, psychology, liquidity, and time itself.
And all of them point in the same direction. Down, Down And Down
🔥 Follow this idea to stay ahead of the next macro move.
📈 We’ll update the chart as the structure unfolds — Wave A, Wave B trap, and the full Wave C capitulation zone.
💬 Drop your thoughts below — agree or disagree, the chart will decide.
🚀 Turn on notifications so you don’t miss the next critical breakdown.
⚠️ DISCLAIMER: This analysis is for educational and informational purposes only.
Not financial advice. Always manage risk and make decisions based on your own research and personal strategy.
#Bitcoin #BTC #Crypto #CryptoAnalysis #TradingView #BTCUSD #BearMarket #ElliottWave #SmartMoney #PriceAction #MarketCycle #Fibonacci #TechnicalAnalysis #CryptoCrash #CryptoWarning
