BTC: H&S Breakdown Aligned With Weekly Rising Wedge BreakHi team!
Bitcoin has confirmed a clear Head & Shoulders formation on the daily chart, breaking below its neckline and retesting the structure as resistance. Price attempted to reclaim the broken level but failed to break out from the rejection zone, showing that sellers are still in control for now.
On the weekly timeframe, BTC has also broken down from the bottom trendline of the larger rising wedge, further strengthening the bearish technical bias.
This multi-timeframe alignment suggests that momentum remains weak, and any short-term rallies could be corrective unless buyers manage to reclaim the broken structure with strong volume.
The next key level to watch lies around the previously broken support zone, which could act as the next downside target if selling pressure continues.
1-BTCUSD

Retest Confirmed - Bitcoin Analysis (2D)Hello everyone.
I must say that it's not very easy to say it loud but for a short period of time, the Bulls have lost the fight.
According to several factors, the next two months will be blood-colored in the entire market.
Get ready to bleed. Because your portfolio will. So will you.
Okay, but why?
Let's see;
Fundamental Factors:
-The USA is still creating more tension around the globe. Only last week, the USA has operated a huge campaign over the Caribbean Sea. And yes, if you ARE a trader, you'll follow these kinds of events because this market is not a playground for kids.
-The USA has finished its recession today but for the first time in history it took a lot of time for them to solve the problems. During the "solving" phase, the market has already calculated the fair prices for so-called "bullish news". By “bullish”, I mean reopening the USA, which is not actually bullish at all because it was never meant to be happening in the first place anyway.
-Today the USA senate has talked about another export restriction for China. This actually is the trigger for today’s red candles.
-The FED is still telling people the same story about inflation. Their utopian targets for inflation are not realistic and they know it as well. Powell has marked that there might be no rate cuts in December after all. Personal thoughts: There will be. In the short term? BEARISH.
-Another thing to consider is the ETFs. Remember what happened in the market when BTC and ETH ETFs were listed? This is what's happening at the moment. History just repeats itself again and again. Many altcoin ETFs will be approved during this month. This will trigger another event called "accumulation". Hedge funds and other customers will seek to buy the dip. Therefore, they will push the prices of ETF-listed altcoins to the bottom so they can buy at lower prices while your portfolio melts. CEXs will also help them do so by letting them manipulate the order book via fake resistance orders. Sorry, but this is how it works.
Now the fun part. Let's talk about the Technical Factors:
-For this time I'll start with USDT dominance.
There is not much to talk about but I'll leave a link so you can examine. The entire market will remain bearish as long as this parameter stays above 5.2%.
-Another thing to keep an eye on is the S&P index, which is looking very bearish due to uncertainty around the globe and for the most part the US.
-Let's get back to BTC.
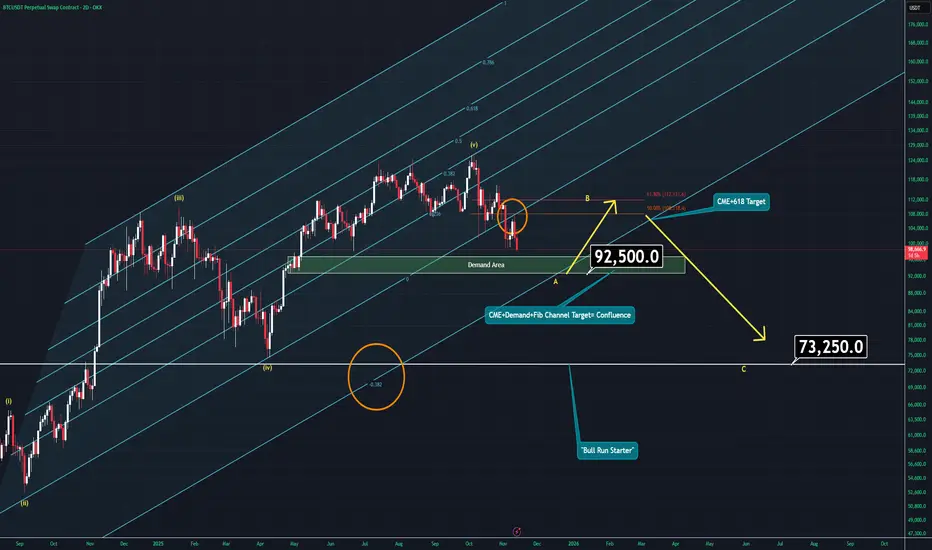
In previous analysis, I already explained to you what might be coming soon and we might actually have been at the end of wave 5. Well, sadly that analysis worked. Yes, sadly because I want this market to grow.
At the moment we are going to see an A-B-C correction pattern and it will take a few weeks to complete. During this era, you need to be careful about two things:
Don’t even think that getting a swing long position to hold for 2 years will work.
You will see a correction through 110K soon but it will only be wave B. So, if you're carrying long-term hedge positions, you'll need to watch for an ENGULFING daily candle in Bitcoin around 92K. That's where the CME gap was left — also a demand area and moreover, there is Fib channel confluence. Before that “engulf” happens, I'd not suggest lowering breakeven in losing positions.
The wave 5 also will be a perfect trap for newcomers and for people who don't know much about the market. Many will jump into altcoins when they're cheap, but most likely they will be cheaper around March 2026.
Bitcoin has already completed its retest after breaking the lower boundary of this Fib channel. No need to overthink it. As long as Bitcoin stays below 110K, don't look for any “BULL RUN.”
And if somehow Bitcoin reaches around 110K, wait for a weekly candle close. That will both confirm and trigger bullish momentum. Don't worry, you won't miss the move — you'll just confirm it.
Thanks for reading,
Get ready.
BTC todayScenario 1: Bounce from upper trendline and W FVG (93/87k) - Bullish.
Scenario 2: Breaks upper trendline and Keeps free falling to retest 74k support - Bearish.
STOP listen to influencers that don't make money from trading. They make money from the shit they sell you and the money you put on their affiliate code.

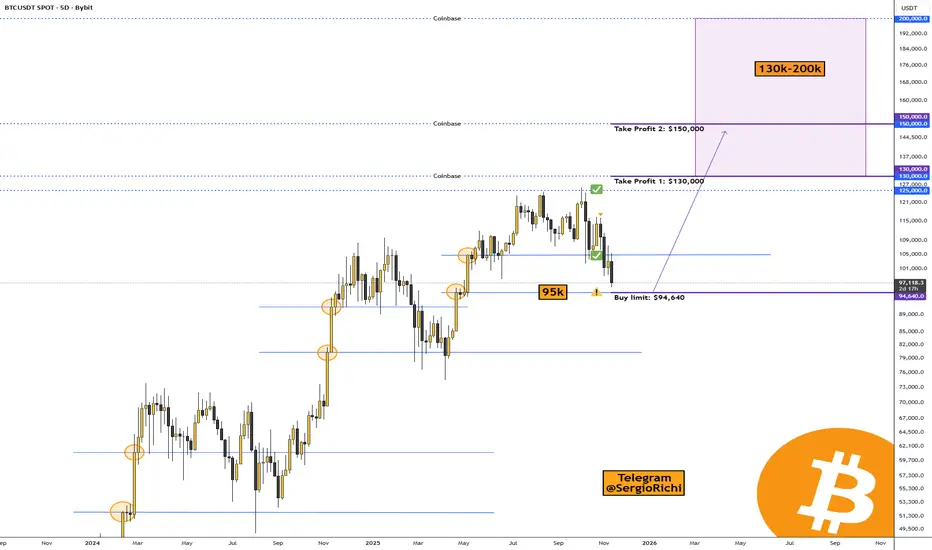
Bitcoin is approaching a key level at $94,640CRYPTOCAP:BTC #Bitcoin — Bitcoin is approaching a key level at $94,640.
The correction in the crypto market continues, and it's now starting in the US stock market.
Bitcoin is nearing an important level on the 5-day timeframe—specifically $94,640.
That's where market makers and big players have placed limit buy orders, and I think we'll see some major trader liquidations there too. For those who trade Bitcoin exclusively, I've marked a buy level.
• Buy limit: $94,640.
• Take Profit 1: $130,000
• Take Profit 2: $150,000
The range for wrapping up Bitcoin's cycle is pretty wide, since there are large orders set up there for taking profits. It's tough to pinpoint exactly where the price peak will be—we can only go by the data we can see.
• Coinbase: $130,000, $150,000, and possibly $200,000.
• Binance: $130,000, $150,000, and likewise, it's unlikely but possible to climb to $200,000.
Based on Elliott waves, we're finishing the 5th upward wave, and I figure the peak will hit in 2026, followed by a straight drop.
Indicator for Bitcoin miners:
The cycle indicator on Bitcoin shows the peak hasn't been reached yet:
Samuel Benner's Cycle and the 2026 Peak
The "200-year farmer chart," often referred to as Samuel Benner's Cycle Chart, is a historical economic forecasting tool created in 1875 by Ohio farmer and self-taught economist Samuel Benner.
It's credited with a "90% success rate" in broad sentiment prediction, and modern applications extend to stocks, crypto, and even solar cycles correlating with recessions.
It's best used as a sentiment gauge, not a precise timer.
Implications for 2026
The chart marks 2026 as a "B" year—a cycle peak in "Good Times," signaling high prices and a time to sell before transitioning to panic and hard times from 2026-2032.
This suggests a potential bull run peak, followed by downturn risks amid global debt, inflation, and geopolitics. As of late 2025, we're in a growth phase approaching this apex, per the model's extensions.
Dear friends, it looks like 2026 will mark the end of the growth cycle for Bitcoin and altcoins, so we'll need to find exit points, bail out of the crypto market, stock up on supplies for 3-5 years, and get busy building bunkers 😀🔥.
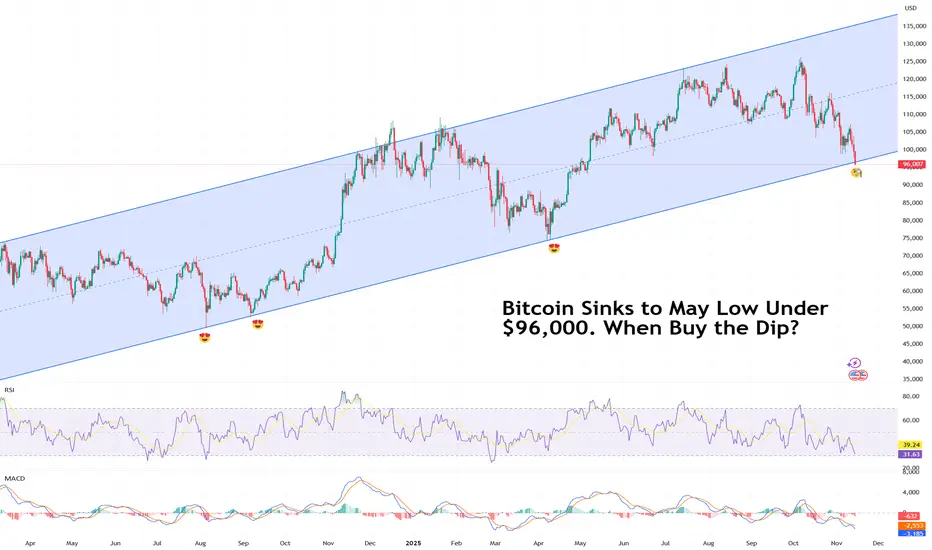
Bitcoin Sinks to May Low Under $96,000. When Buy the Dip?Because sometimes the dip just keeps on dipping.
Bitcoin BITSTAMP:BTCUSD can’t seem to catch a break. The flagship crypto slid below $96,000 on Friday, a level last seen in May, and traders aren’t exactly rushing to buy the dip.
The decline caps a tough few weeks for the OG coin, now lower by about 24% from its record high of $126,000 .
The selloff hasn’t been contained to just Bitcoin. The whole crypto market has been slammed.
Ethereum BITSTAMP:ETHUSD stumbled into the low $3,100s, while Solana COINBASE:SOLUSD fell to the mid-$140s. The entire digital asset space looks winded, and this time, the usual quick rebounders and sharpshooters are sitting on their hands.
What’s going on? In short — traders are nervous, the data floodgates are about to open, and the Federal Reserve isn’t giving anyone the all-clear just yet.
🧨 Buy Dip or Wait for Data?
The end of the US government shutdown should’ve been good news — until investors remembered what comes next.
All the pent-up economic reports that couldn’t be released during the freeze are about to hit the tape: jobs data, inflation numbers, and other key reads that could shape the Fed’s next move.
The bad news: December rate cut isn’t guaranteed. Markets had been leaning heavily on that expectation to justify the monthslong risk-on rally. Now, with the data torrents about to test that narrative, traders are hedging their bets — and Bitcoin’s getting caught in the crossfire.
If the upcoming reports show the economy is still running hot, the Fed might delay cuts. And higher-for-longer rates are basically kryptonite for speculative assets.
💀 Liquidations and Leverage: A Familiar Story
Bitcoin’s latest slump wasn’t just about macro nerves — it was also a good old-fashioned liquidation cascade.
As prices dipped under key technical levels, margin traders got squeezed out in a hurry. According to data from liquidation trackers, over $220 million in crypto positions were wiped out in just one hour. In the past 24 hours? North of $600 million gone.
In previous dips, you’d see traders rushing to scoop up discounted coins, confident that the bounce would follow. The hesitation this time speaks volumes: sentiment’s shifting, and traders are more cautious after months of euphoric rallies in both AI stocks and crypto.
🌡️ The Contagion Spreads
Crypto weakness isn’t isolated anymore — it’s part of a bigger story. Risk assets everywhere are under pressure. The AI trade is cooling, tech stocks are wobbling , and volatility is creeping back into markets that had gone eerily calm.
In short, when traders start treating crypto like a growth stock proxy, Bitcoin stops being a hedge and starts acting like the Nasdaq on leverage.
🪙 So… When to Buy the Dip?
That’s the million-satoshi question. Historically, deep Bitcoin drawdowns during otherwise healthy macro backdrops have rewarded patience. But this time, the setup’s trickier. The next few weeks should bring a barrage of data that could redefine everything from rate expectations to risk appetite.
What can you do now? Watch the data, respect the trend, and don’t fight momentum.
Notice how the long-term upside swing on the daily is still there. But as they say, past performance isn't an indication of future results.
The Fed’s next move, coming early December, will likely decide if this dip becomes a real buying opportunity.
Off to you : Are you looking to buy the dip or you’re waiting for the dip of the dip? Share your strategy in the comments!
BTCUSD Long: Rebound From Demand Line Targets $104K ResistanceHello traders! Bitcoin (BTCUSD) continues to trade within a well-defined structure, showing a gradual transition from a bearish phase toward potential accumulation. After an extended decline inside the Descending Channel, the market found strong support around the $100,600–$101,000 Demand Zone, where a fake breakout occurred — signaling liquidity grabs and renewed buyer interest. This zone has acted as a major reaction area multiple times, marking it as a key demand region. Following the rebound from this level, BTCUSD formed a Pivot Point near $101,200, initiating a mild bullish recovery along the Demand Line, which now serves as dynamic support. However, price remains capped below the $104,000 Supply Zone, an area that aligns with both the upper boundary of the current Range and the previous Fibonacci Arc retracement, where sellers previously re-entered the market.
Currently, Bitcoin is consolidating between $101,200 support and $104,000 resistance, reflecting indecision before a potential breakout. If buyers manage to defend the Demand Line and reclaim $103,000, a move toward $104,000 and possibly higher could follow, completing the short-term recovery phase. Conversely, a confirmed breakdown below $101,000 would invalidate the bullish scenario, likely driving price back toward the $100,000–$99,600 zone for another liquidity test.
I expect the current structure suggests Bitcoin is in a neutral-to-bullish phase, with attention focused on how price reacts around the Demand Line and Range boundaries. A strong rebound from current levels could trigger the next leg toward $104,000 resistance. Manage your risk!

ANFIBO | Bitcoin BTCUSD - Bet a Buy order [11.14.2025]Hi traders, Anfibo’s here!
BTCUSD – Technical Outlook
Technical Structure:
BTC is now trading extremely close to a major structural support zone, aligning with the 61.8% Fibonacci retracement around the $94,000 region. This confluence makes the area a high-value reaction point—historically, 61.8% fib zones often act as strong bases for corrective rebounds during healthy bull-cycle pullbacks. Momentum is slowing down as price compresses into this support cluster, signaling that the market is preparing for a potential relief bounce… unless the level fails.
Trading Strategy:
Our approach today focuses on respecting this key confluence zone.
If BTC stabilizes above 94k, a short-term rebound toward 110,000 USD is a realistic target.
However, if price breaks below 91,000 USD, structure becomes decisively bearish, exposing deeper supports and invalidating the rebound setup.
This is a “react at the level, not before the level” type of day.
Daily Trading Plan:
>>> BUY ZONE:
ENTRY: 93,500 – 95,000
SL: 90,500
TP: 110,000
(Looking for a clean rebound from the 61.8% confluence, ideally with volume pickup or bullish rejection candles.)
>>> SELL ZONE: (only if 91k breaks cleanly)
ENTRY: 90,000 – 91,000 (retest of breakdown)
SL: 94,000
TP: 87,000 → 80,000 → 77,000 → 72,000 → 63,000
(A structural breakdown would shift momentum from corrective to impulsive downside.)
Risk Management:
Keep size moderate; counter-trend buys at major supports require disciplined SL usage.
If entering long, move stop to breakeven once price clears 98k–100k to reduce downside exposure.
Never average down near broken supports; wait for structure to confirm strength before adding.
If the 91k level breaks, switch to defensive mode — reassess bias and avoid catching falling knives without confirmation.
Conclusion:
BTC is sitting on one of its most important confluence supports at 94k. A rebound from here can push price toward 110k, but a clean breakdown below 91k will shift the broader narrative toward a deeper corrective leg with multiple supports waiting below (87k → 80k → 77k → 72k → 63k). Today is a critical inflection point—let the level decide the direction and react accordingly with disciplined execution.
GOODLUCK GUYS!!!

BTC/USD - Rising Wedge - Reversal Pattern - Short/Sell IdeaBTC/USD - Rising Wedge - Reversal Pattern - Short/Sell Idea📉📉
Bitcoin is forming a rising wedge on the 4H chart, a bearish reversal pattern signaling weakening bullish momentum. Price is currently around $114,700, with wedge resistance near $128,000 and rising support around $112,000. A confirmed break below $112K could trigger a move toward $103K, with the main downside target at the volume Point of Control (POC) near $97K — a major liquidity zone where the highest trading activity has occurred.
A brief retest of $115K–$118K after breakdown is possible before further downside. Invalidation occurs on a decisive breakout above $128K.

usdt.d 4dHello
I am Mehdi with 4-hour analysis
Based on the analysis, we expect the cryptocurrency market to start a new upward trend
Reasons
1. We are at the ceiling of the daily timeframe channel
2. Accurate harmonic ratios
3. Price action pattern
4 MACD divergence
5 RSI divergence
Resistance level 5.7
Finally, thank you for supporting me by liking, sharing and commenting

BTCUSD: Bulls Defend $102K Zone — Eyeing Breakout Toward $107KHello everyone, here is my breakdown of the current Bitcoin setup.
Market Analysis
BTCUSD is trading within a well-defined triangle formation after a period of volatile movements between $102,500 and $107,000. The chart shows that price recently rebounded from the Triangle Support Line, aligning with the $102,000–$103,000 Support Zone, where buyers have consistently stepped in to defend this level. This zone has acted as a strong accumulation area, confirmed by multiple bounces and rejection wicks signaling absorption of selling pressure.
Currently, after a fake breakout to the downside, BTCUSD quickly recovered, retesting the Resistance Zone near $105,000–$105,500, which also aligns with the Triangle Resistance Line. This confluence area represents the next key reaction point. A confirmed breakout above this resistance would indicate a potential continuation of the broader bullish trend, while a rejection here could lead to a short-term correction back toward the support base. The market behavior shows constructive consolidation, with higher lows forming along the support trend line — a sign that buyers are gradually regaining control. As long as BTCUSD remains above $102,000, the short-term structure favors further upside movement within the triangle, aiming toward the $106,500–$107,000 resistance area.
My Scenario & Strategy
As long as Bitcoin holds above the $102,000–$103,000 Support Zone, the bullish outlook remains valid. The first upside objective (TP1) is the $106,500–$107,000 Resistance Area, where traders should watch for potential rejection or breakout signals. A confirmed breakout and close above $107,000 could trigger an extension toward $109,000–$110,000, aligning with the upper boundary of the triangle and the previous reaction zone.
However, if BTCUSD fails to hold above $102,000, this would invalidate the bullish scenario and open the way for a deeper pullback toward $100,000–$99,000, where fresh buying interest may emerge. For now, the structure supports buying pullbacks while price remains above the ascending Triangle Support Line, as momentum continues to favor the bulls.
That's the setup I'm tracking. Thank you for your attention, and always manage your risk.

CAUTION: BITCOIN'S CORRECTION JOURNEY TO $96,050Bitcoin has hit a resistance wall with a double top on the weekly as well as the monthly timeframe. What's even more concerning for bulls is the RSI divergences on these time frames. Volume has been drying up as price was hitting new all time highs while momentum was also declining. Now the smoke has now lit up into a flame and the big correction is in progress.
I am expecting an A-B-C correction to an initial target of $96,050 where bulls will step up buying pressure to go up to make either a higher high or a lower high on the weekly chart. Stay tuned for further update.
Cheers fellow traders!

BITCOIN on a 6-month Low! Bear Cycle starting based on GOLDBTC?Bitcoin (BTCUSD) hit $96000 today for the first time in 6 months (since May 07). For a long time we presented evidence (spearheaded by the 4-year Cycle) of why October was a strong candidate for a market top and so far this continuous correction validates all the data.
Today we circle back to an old favorite of ours, the GOLDBTC ratio. During the previous Bull Cycle, a Double Bottom on that ratio was what confirmed the start of BTC's 2022 Bear Cycle. On the current Cycle, we had this Double Bottom in August and since then, the GOLDBTC ratio has been rising.
Even on previous Cycles, a rise on this ratio always coincided with a BTC Bear Cycle. Based on that evidence too, the next Bitcoin Bear Cycle should be over before 2026 ends.
As a side-note for investors, keep in mind that a rise on the GOLDBTC ratio doesn't necessarily mean that Gold will rise while only Bitcoin falls. Both can fall at the same time, the ratio highlights pace, it just indicates that Gold can also decline in value but less aggressively than Bitcoin.
So are we in a Bitcoin Bear Cycle? Feel free to let us know in the comments section below!
---
** Please LIKE 👍, FOLLOW ✅, SHARE 🙌 and COMMENT ✍ if you enjoy this idea! Also share your ideas and charts in the comments section below! This is best way to keep it relevant, support us, keep the content here free and allow the idea to reach as many people as possible. **
---
💸💸💸💸💸💸
👇 👇 👇 👇 👇 👇

DeGRAM | BTCUSD BTCUSD is aiming to reach a key support level.📊 Technical Analysis
● BTC is approaching a major confluence zone where the long-term support line meets the key demand area near 94k–92k. This level previously triggered strong reversals.
● Price remains inside a broad falling structure, and a bounce from the lower boundary would confirm trend exhaustion and open room for recovery toward 102k–108k.
💡 Fundamental Analysis
● FXStreet reports renewed inflows into BTC ETPs and improving risk sentiment as markets expect milder Fed policy, supporting medium-term bullish pressure.
✨ Summary
BTC nearing 94k–92k demand; bounce may target 102k–108k. Key support: 92k. Break above falling trend = continuation.
-------------------
Share your opinion in the comments and support the idea with a like. Thanks for your support!

BTCUSD | London Session | Bullish Structure BalanceThe monthly bullish structure balance has now been filled, and the higher-timeframe map remains intact.
BTC continues to rotate inside a bullish range and is still positioned in the discount zone.
Range boundaries:
• Range low (invalidation): 78.167
• Range high (continuation): 123.231
As long as price holds above the range low, the bullish bias stands.
- Market Structure Mapping (MSM) — Current View
The structural picture is straightforward:
BTC is holding a clean range.
There is no breakdown. No structural shift.
The architecture is stable.
Cross-market structure adds context:
• The U.S. dollar sits directly on a major volume node.
If the dollar pushes higher from here, risk assets usually feel it.
If the dollar softens, crypto keeps its bullish rotation.
• FX majors recently cleared liquidity lows, resetting the structural map.
• Crypto majors remain balanced with no directional damage.
This is a classic data-waiting phase.
The structure is already drawn. The market is waiting for a catalyst to decide the next expansion path.
- Precision Execution Modeling (PEM) — Guidance for Volatile News Days
When heavy data is on the calendar, PEM shifts the playbook:
• Do not react to the first spike.
The wick is emotion. The candle close is intent.
• Step back to higher timeframes.
4H and 1D candles filter out noise and reveal real direction.
• Expect wicks to violate levels without changing structure.
Large funds do not trigger algorithms on a random spike; they react to confirmed structure.
• Protect capital until the market shows its hand.
In fast conditions, patience is a position.
CORE5 :
If you need excitement, watch Netflix. If you need results, wait for the candle close.
— CORE5DAN
Institutional Logic. Modern Technology. Real Freedom.

GOLD ranging.GOLD has been consolidating.Waiting to see if it will BreakOut after news or keep raning until markets reopen after today.

Bitcoin is Still Bearish (12H)Bitcoin still looks bearish | it seems to be inside wave C, and this upward move could be aimed at collecting sell orders and liquidating part of the short positions held by retail traders.
From the yellow circle, the price could get rejected toward TP1 and TP2.
Let’s wait and see what happens.
For risk management, please don't forget stop loss and capital management
When we reach the first target, save some profit and then change the stop to entry
Comment if you have any questions
Thank You

ANFIBO | BTCUSD - $94.000 or $70.000? [11.6.2025]Hi traders, Anfibo's here!
BTCUSD – Technical Outlook
Technical Structure:
Price action currently respects a descending channel, with:
- Upper boundary (resistance): around $106,000 – $107,000
- Lower boundary (support): converging with the D1 trendline and the 0.618 Fibonacci retracement zone, located between $94,000 – $95,000
This confluence area at $94,000 – $95,000 will be crucial. It not only represents technical alignment between multiple structures (Trendline + Fibonacci) but also marks the boundary where short-term sentiment could shift from corrective to impulsive.
Trading Strategy:
Our tactical approach remains straightforward and adaptive:
“Trade the trend when touched – reverse the bias if the trend breaks.”
#1 – Rejection at Upper Boundary:
Should BTC retest the 106–107k resistance and fail to break through, short-term sell opportunities may arise targeting the mid-range or lower boundary (95k region).
#2 – Reaction at Lower Boundary:
If price reaches the 94–95k support zone and holds, this area could offer high-probability long entries, particularly if accompanied by bullish divergence or strong volume confirmation.
#3 – Breakdown of Structure:
A clean break below $90,000 would signal structural weakness, exposing BTC to the next major support cluster between $80,000 and $70,000. Such a move would represent a deeper corrective leg in the broader cycle and could reset the market’s medium-term trend.
Trading Plan:
>>> SELL ZONE: (x1000)
ENTRY: 106 - 108
SL: 109
TP: 95
>>> BUY ZONE:(x1000)
ENTRY: 93 - 95
SL: 90
TP: 120
Risk Management:
- Stick to small-to-medium positions within the range; increase size only on confirmed breakouts.
- Keep stops tight, as sideways phases tend to trigger false signals.
- Maintain Risk:Reward ≥ 1:2 and avoid overtrading in choppy conditions.
- Reassess bias once the channel is clearly broken.
Conclusion:
BTC is currently in a compressed, corrective phase, moving within a defined range. The key battleground lies between $95,000 and $107,000. Traders should remain flexible, respecting both boundaries of the channel and reacting based on breakout confirmations rather than anticipation.
As long as BTC holds above the $94,000 – $95,000 confluence, the broader bullish structure on the daily timeframe remains intact. However, a decisive break below $90,000 would open the door for a larger-scale correction toward the $80,000 - $70,000 zone—where long-term accumulation could once again become attractive.
GOODLUCK GUYS!!!

BITCOIN SIGNAL: HERE IS WHATS NEXT!!!! (boom)Yello Paradisers! Enjoy the video!
And Paradisers! Keep in mind to trade only with a proper professional trading strategy. Wait for confirmations. Play with tactics. This is the only way you can be long-term profitable.
Remember, don’t trade without confirmations. Wait for them before creating a trade. Be disciplined, patient, and emotionally controlled. Only trade the highest probability setups with the greatest risk to reward ratio. This will ensure that you become a long-term profitable professional trader.
Don't be a gambler. Don't try to get rich quick. Make sure that your trading is professionally based on proper strategies and trade tactics.

The future of Bitcoin in the coming yearA significant crash in Bitcoin is approaching.
Following the failure of the head-and-shoulders top pattern and weekly close below it, Bitcoin faces a major decline.

BTC CRACK! UPDATE WARNING!!⚠️ BTC CRACKS — Officially in a Bear Market (-24%)
Bitcoin has now broken below $97,000, down 24% from its highs, officially entering bear-market territory.
I’ve been warning about this setup for months — not because I enjoy being bearish, but because the structure was screaming caution.
This isn’t a “buy-the-dip” moment or a garden-variety correction. We’ve hit a major technical and psychological level that could decide the next phase for the entire crypto space.
If this level fails, expect a chain reaction across risk assets — leverage, liquidity, and sentiment all roll over together.
It could be years before you see another uptrend. Note: This is not a short-term trade.
Stay sharp. The real test for crypto starts now.
Thank you ALL FOR getting me up to 5,000 followers!! ))
Click boost, follow, comment nicely for more authentic, no BS, raw analysis. Let's get to 6,000 followers. ))

Bitcoin: Liquidity CycleTypical liquidity cycle is 5-6 years long (65m). Buy bitcoin before an upswing (or end of QT) and sell when liquidity tightens. Macro is the best way to analyze markets?
Adjust your stakes based on position of the cycle.
Markets can have risk-on, risk-off episodes. Where Bitcoin is a risk-on asset.
Use 10Y-02Y for guidance.

Stop!Loss|Market View: SILVER🙌 Stop!Loss team welcomes you❗️
In this post, we're going to talk about the near-term outlook for SILVER ☝️
Potential trade setup:
🔔Entry level: 52.10719
💰TP: 48.72093
⛔️SL: 53.72120
"Market View" - a brief analysis of trading instruments, covering the most important aspects of the FOREX market.
👇 In the comments 👇 you can type the trading instrument you'd like to analyze, and we'll talk about it in our next posts.
💬 Description: The price is currently potentially forming a double-top reversal pattern. There's a large accumulation of buyers near 53-54, and if they manage to maintain the price at these levels, silver will rise toward 56. However, if the price reaches 52, we can expect a pullback to 48-49, from where, in the longer term, a decline to 40-42 is possible.
Thanks for your support 🚀
Profits for all ✅

BTC/USD: Testing Key Support (M/FVG) After Strong DowntrendKey Observations
Downtrend: The price has been moving lower, defined by the downward-sloping black trendline, indicating a period of bearish momentum.
Break of Structure (BOS): A "BOS" (Break of Structure) label is placed below a recent low, confirming the continuation of the bearish structure as the price moved lower.
Current Support Zone: The price is currently testing a significant support zone (the grey rectangular box) around the $96,000 - $98,500 area. This level appears to be a historical reaction zone.
Market Structure/Fair Value Gap (M/FVG): The support zone is also labeled as "M / FVG" (Likely Mitigation or Market Structure combined with a Fair Value Gap), suggesting this area holds significance for potential institutional/smart-money activity.
Future Scenarios (Projected Paths):
Scenario 1 (Black Arrow): The main projected path shows a potential bounce/reversal from the current support zone, aiming to push the price higher. This suggests a buy/long opportunity might be imminent if the support holds.
Scenario 2 (Curved Arrow): The alternative (and often less-likely, as it's secondary) projection suggests a continuation of the downtrend after a potential minor bounce or consolidation, indicating a break below the support zone and further declines.
