Bitcoin Dominance Rejection and Altcoin Pump👋🏻 Hey everyone! Hope you’re doing great! Welcome to SatoshiFrame channel.
✨ Today we’re diving into the 1-Day Bitcoin Dominance analysis. Stay tuned and follow along!
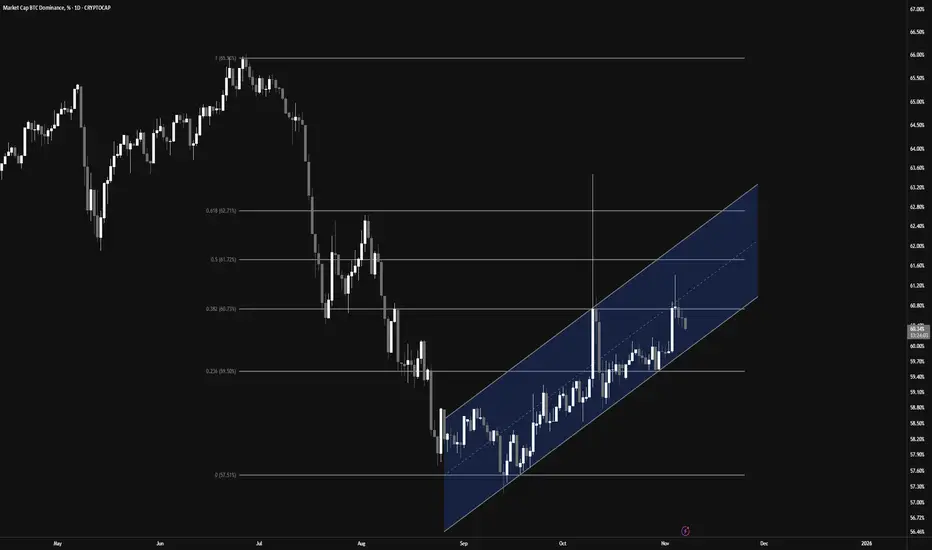
👀 On the daily timeframe, Bitcoin dominance has reached a key resistance zone at 60.73%. If this level breaks, we could see a deeper correction across altcoins. However, a rejection and move downward could trigger a strong rally for altcoins. As Bitcoin’s market weight decreases and capital flows into altcoins, we might be entering an early altseason, presenting potential profit opportunities.
🕯 From a technical perspective, Bitcoin dominance is moving within a well-structured ascending channel. The midline of the channel acts as a solid rejection point. A Fibonacci retracement from the previous downtrend shows a 38% overlap with this midline — a tough level to break. After a strong bearish candle rejection from that area, dominance is now heading lower. If the move continues, we could see a test of the channel’s lower boundary, and a confirmed breakdown would strengthen the altcoin bullish scenario.
💰 Typically, capital rotation in crypto follows this pattern: money flows into Bitcoin, then Ethereum, then the top 10 coins, and finally into smaller altcoins — before converting to USDT and exiting the market. With Bitcoin dominance currently at high levels after a solid Bitcoin season, this could signal the early stages of capital shifting toward altcoins. Traders should watch closely for these shifts to maximize profitability.
❤️ Disclaimer : This analysis is purely based on my personal opinion and I only trade if the stated triggers are activated .
1-BTCUSD
Break of Support or Multi-Timeframe Trend Reversal ?👋🏻 Hey everyone! Hope you’re doing great! Welcome to SatoshiFrame channel.
✨ Today we’re diving into the 15-Mimutes Bitcoin analysis. Stay tuned and follow along!
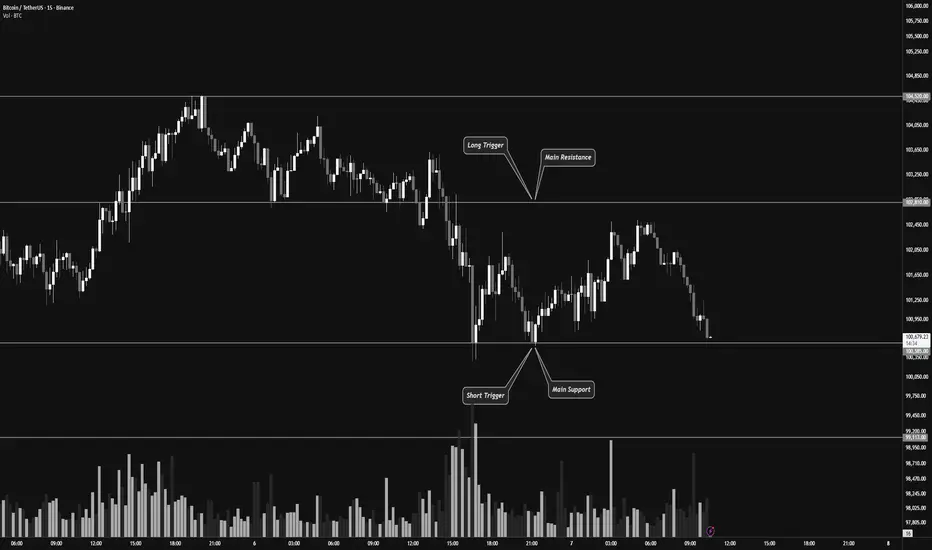
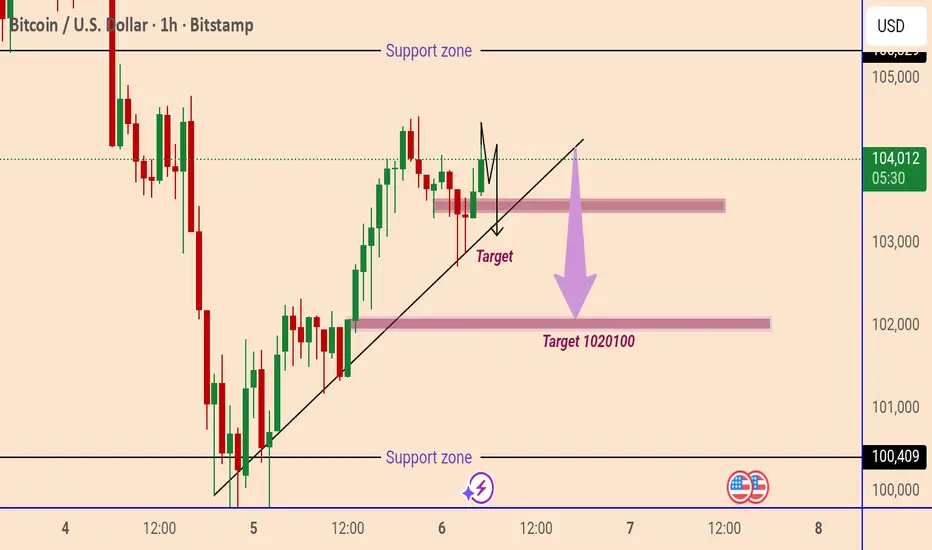
👀 On the 15-minute timeframe for Bitcoin, we can see that after breaking a multi-timeframe support, Bitcoin is currently testing its support zone around $100,585.
If this zone breaks, Bitcoin could continue its downward move and experience further decline.
However, if it moves upward and breaks the resistance zone around $102,810, it could trigger a potential trend reversal.
🕯 Pay attention to Bitcoin’s volume — the volume indicator currently shows an increase in selling pressure, suggesting that we might see a short-term volume consolidation before the price continues downward again.
✍️ The current scenarios for Bitcoin include both long and short setups, which you can use to plan your trades based on how the market reacts.
🟢 Long Position Scenario : A break above the $102,810 resistance zone, accompanied by increasing buy volume and bullish momentum, could signal a good long opportunity toward higher levels.
🟥 Short Position Scenario : A break below the $100,585 support zone, along with increasing sell pressure turning into strong selling momentum, could offer a short opportunity in line with the current trend.
❤️ Disclaimer : This analysis is purely based on my personal opinion and I only trade if the stated triggers are activated .
GOLD will rise in the coming weeks.GOLD has a stable week and should be making it's move back up in the next couple of weeks.

BTCUSD: Falling Wedge Reversal in Play Toward 106KHello everyone, here is my breakdown of the current Bitcoin setup.
Market Analysis
Bitcoin (BTCUSD) has recently shown signs of recovering bullish momentum after rebounding from the 100,600–101,000 Support Zone, which has acted as a key demand region during previous tests. The market experienced a fake breakout below the wedge support line, but buyers quickly stepped back in, pushing the price back inside the structure — a classic indication of seller exhaustion and accumulation interest.
Currently, BTC is trading inside a falling wedge pattern, which is typically considered a bullish reversal formation. The recent bounce from the lower boundary suggests that buyers are attempting to regain control, especially after the sharp decline from the 113,700 Resistance Zone. The price is now gradually approaching the mid-range of the wedge, signaling a potential continuation toward the upper resistance line.
My Scenario & Strategy
If Bitcoin holds above the 100,600–101,000 support, the bullish scenario remains valid. I expect the price to gradually move toward the 104,000–106,000 area as the next short-term target, aligned with the wedge resistance line. A breakout and confirmed hold above the wedge resistance would likely signal a trend reversal, opening the door for a larger continuation toward the 113,700 resistance zone, and possibly beyond.
However, if BTC loses the 100,600 support again and closes below the wedge, this would invalidate the bullish setup and could trigger a deeper move toward 98,000 before a new structure forms.
That's the setup I'm tracking. Thank you for your attention, and always manage your risk.

Bitcoin below 200‑day: Buy the dip or more downside?Bitcoin slid with US risk assets, and a clean break below its 200‑day average puts the 100K support in play right now.
October’s Challenger report showed the biggest monthly job cuts in over two decades, souring sentiment and knocking cryptos alongside equities as traders reassessed near‑term Fed risks.
Weak risk tone plus key technical breaks drove a second wave of selling after the early‑October crypto drawdown, keeping focus on whether 100K holds for Bitcoin.
Key drivers:
Macro shock: October layoffs surged to a 20‑year high, fuelling risk‑off and trimming rate‑cut confidence into year‑end.
BTC technical break: price slipped under the 200‑day, and 50‑day momentum is fading; 100K is the first line of defence, then 92–94K if it fails.
Moving averages are lagging: watch daily closes around these levels rather than one intraday pierce; breadth below long MAs warns of weak trend strength.
Trade the levels, not the noise: defend 100K on BTC for bounce attempts. A daily close below turns focus to 92–94K on BTC before stronger supports.
This content is not directed to residents of the EU or UK. Any opinions, news, research, analyses, prices or other information contained on this website is provided as general market commentary and does not constitute investment advice. ThinkMarkets will not accept liability for any loss or damage including, without limitation, to any loss of profit which may arise directly or indirectly from use of or reliance on such information.

Stop!Loss|Market View: BTCUSD🙌 Stop!Loss team welcomes you❗️
In this post, we're going to talk about the near-term outlook for the BTCUSD ☝️
Potential trade setup:
🔔Entry level: 105019.48
💰TP: 110424.25
⛔️SL: 102201.32
"Market View" - a brief analysis of trading instruments, covering the most important aspects of the FOREX market.
👇 In the comments 👇 you can type the trading instrument you'd like to analyze, and we'll talk about it in our next posts.
💬 Description: The global prospects for a decline to 90000 are lingering, but for now, unless the price pushes toward 100000, the decline will have to wait a bit longer. The most likely scenario now is a price move toward 104000, where a breakout toward 110000 is expected. Near this resistance, not only are technical factors stopping the price but also a accumulation of selling liquidations, so the price will likely drift toward this area in the short-term.
Thanks for your support 🚀
Profits for all ✅
❗️ Updates on this idea can be found below 👇

Stop!Loss|Market View: USDJPY🙌 Stop!Loss team welcomes you❗️
In this post, we're going to talk about the near-term outlook for the USDJPY currency pair☝️
Potential trade setup:
🔔Entry level: 154.304
💰TP: 156.111
⛔️SL: 153.446
"Market View" - a brief analysis of trading instruments, covering the most important aspects of the FOREX market.
👇 In the comments 👇 you can type the trading instrument you'd like to analyze, and we'll talk about it in our next posts.
💬 Description: A second test of the 153.446 support level isn't a good buy signal, and it's best to take aside from buy positions near current levels for now. The most attractive option for buyers remains near the 154.310 resistance level. If the price does reach that level soon, it's highly likely that the price will continue moving toward 155-156 as sellers liquidate their positions.
Thanks for your support 🚀
Profits for all ✅
❗️ Updates on this idea can be found below 👇

Stop!Loss|Market View: GBPUSD🙌 Stop!Loss team welcomes you❗️
In this post, we're going to talk about the near-term outlook for the GBPUSD currency pair☝️
Potential trade setup:
🔔Entry level: 1.31268
💰TP: 1.28032
⛔️SL: 1.32581
"Market View" - a brief analysis of trading instruments, covering the most important aspects of the FOREX market.
👇 In the comments 👇 you can type the trading instrument you'd like to analyze, and we'll talk about it in our next posts.
💬 Description: As previously predicted, the USD's dominance is strengthening and is likely to continue in the mid-term. For the pound, all key short-term targets have been completed, as have the mid-term targets outlined in previous reviews. Further downward movement is currently expected toward 1.27130, which is the next significant support level. Given the current situation, sell opportunities are currently only located above 1.31590, should the price return there for a retest.
Thanks for your support 🚀
Profits for all ✅
❗️ Updates on this idea can be found below 👇

Bearish drop off?The Bitcoin (BTC/USD) is rising towards the pivot and could reverse to the 1st support.
Pivot: 103,498.50
1st Support: 95.526.48
1st Resistance: 111,232.24
Disclaimer:
The above opinions given constitute general market commentary, and do not constitute the opinion or advice of IC Markets or any form of personal or investment advice.
Any opinions, news, research, analyses, prices, other information, or links to third-party sites contained on this website are provided on an "as-is" basis, are intended only to be informative, is not an advice nor a recommendation, nor research, or a record of our trading prices, or an offer of, or solicitation for a transaction in any financial instrument and thus should not be treated as such. The information provided does not involve any specific investment objectives, financial situation and needs of any specific person who may receive it. Please be aware, that past performance is not a reliable indicator of future performance and/or results. Past Performance or Forward-looking scenarios based upon the reasonable beliefs of the third-party provider are not a guarantee of future performance. Actual results may differ materially from those anticipated in forward-looking or past performance statements. IC Markets makes no representation or warranty and assumes no liability as to the accuracy or completeness of the information provided, nor any loss arising from any investment based on a recommendation, forecast or any information supplied by any third-party.

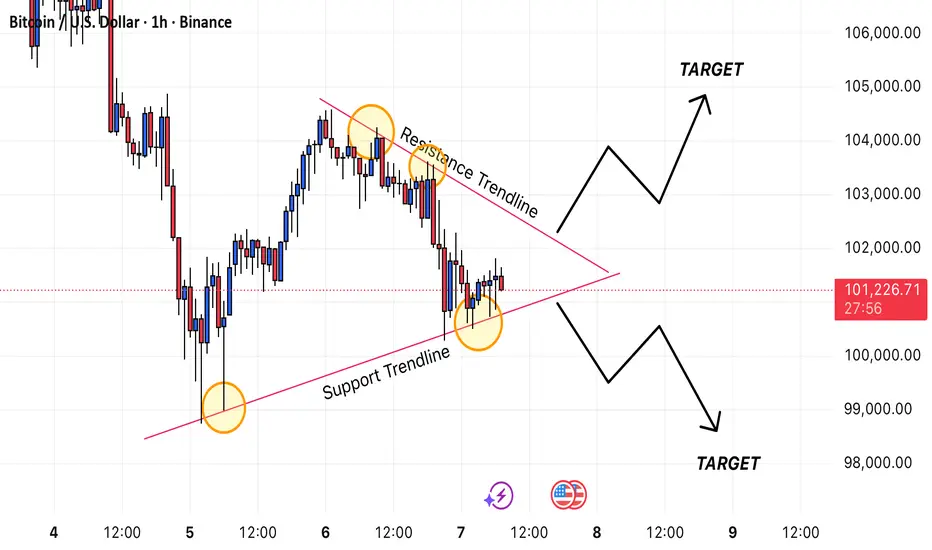
Btc/Usd - Symmetrical Triangle SetupBitcoin is currently trading inside a tightening symmetrical triangle, with price respecting both the descending resistance trendline and ascending support trendline. Multiple touches on each side confirm the structure.
A breakout is likely approaching as BTC nears the apex:
Bullish Scenario:
Break above the resistance trendline could trigger momentum toward the 102,500–105,000 zone.
Bearish Scenario:
Breakdown below support may open a move toward the 99,000–98,000 area.
Until a clear breakout occurs, price may continue to consolidate within the triangle.
Watch for strong volume to confirm direction.
XAU/USD – Selling Opportunity Near Resistance ZoneGold is currently approaching a strong resistance level after an extended bullish move.

Today's Bitcoin Trading StrategyCurrently, the price of Bitcoin stands at $101,300, which is at a four-dimensional resonance point of "macro easing + institutional entry + technical breakthrough + regulatory clarity". The signal for the super cycle's initiation has been fully confirmed. Unlike previous bull markets, this round of rise is led by institutional funds, featuring stronger sustainability and a higher valuation ceiling . The core of operation lies in "firm allocation + dynamic portfolio adjustment": Institutional investors should seize the opportunity of the correction to establish core positions, while swing traders can follow the breakthrough signals to go long accordingly. At the same time, through strict stop-loss discipline and staged profit-taking strategies, they can lock in the certain gains brought by the super cycle. It is necessary to closely track the ETF capital flow and the dynamics of the Federal Reserve's policies. In the liquidity feast, the "asset revaluation" of Bitcoin has just begun.
Today's Bitcoin Trading Strategy
buy:100000~101000
tp:102000~103000
sl:99000

TESLA PT-2 TRILLION DOLLAR PAY CHECKI hope everything is clear now. I have exited all positions here and I am not going into news.
Elon is not going to tell me where my money is going
NOTE:NOT TRADING TSLA

CleanSpark (CLSK): Strong Upside Expected After CorrectionWhy this matters now:
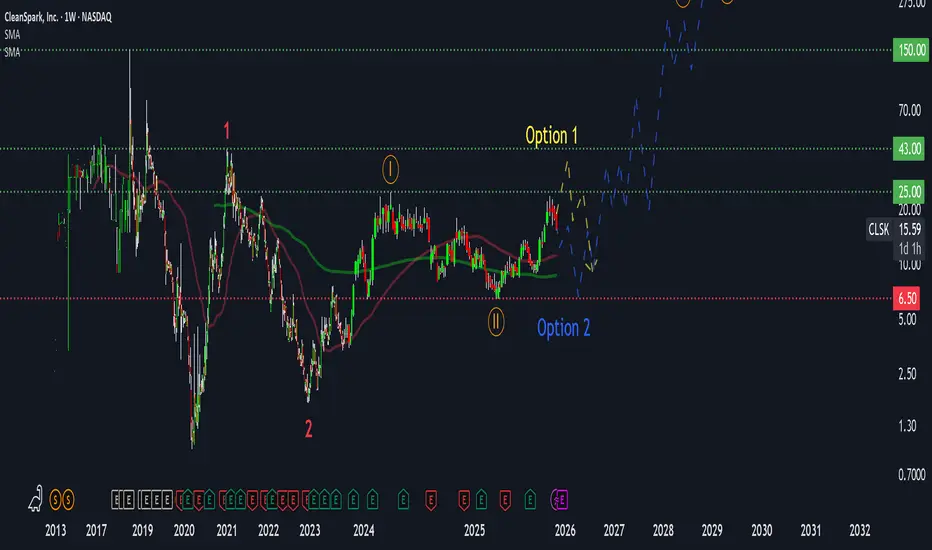
CleanSpark remains one of the strongest miners in the sector, but the current technical structure suggests a likely correction before the start of a major bullish cycle.
🔹 Main Thesis
Technically, CLSK is bullish, but a short-term correction to $8–10 is expected, after which the stock could launch a strong upward move toward $43 and beyond.
🔹 Key Arguments
Wave Structure:
Wave 1 is complete ✅, Wave 2 (correction) is underway. We are now in the final phase before the next impulse wave.
Resistance $25–43:
$25 is a key previous high. A short-term breakout with a small pullback is possible, followed by a retest and formation of the next upward wave. Targets: $43, then $150+.
Volume Cluster $8–10:
The main smart money cluster where significant positions were accumulated provides strong support. This is likely the bounce zone after the correction.
Fundamentals:
EPS growth ~50% YoY, forward P/E ~15. Cash flows are unstable.
Correlation with Bitcoin:
As a Bitcoin miner, CLSK is highly correlated with BTC. Historically, when BTC corrected 70–80%, CLSK tested lows in the $8–10 zone.
Currently, CLSK could first rise to $30–35 and then correct along with BTC by roughly 70%, aligning with the $8–10 support cluster.
Levels and Targets
Resistance: $25 - key level, possible false breakout
Support / Smart Money Cluster: $8–10 - likely bounce zone
Final Cycle Targets: $43 → $150 - breakout above $43 opens the path to $150+
🔹 Risk & Invalidation
Main Risk: strong BTC correction → CLSK tests $8–10 cluster.
Historically, four previous corrections in BTC were around 70–80%, matching the current structure.
❌ Invalidation: break and close below $6 → current wave structure would be invalidated and require reassessment.
🔹 Summary
CleanSpark is forming a strong bullish trend. After a possible correction to $8–10, a powerful upward impulse is likely, with targets at $43 and beyond. Potential from current levels: 10x+, but the path includes a consolidation phase.
🔹 Discussion
What’s your take on CLSK? Do you agree with the correction scenario, or do you see a different move?
💬 Comment below or suggest which ticker we should analyze next!
BITCOIN 's Bear Cycle has started according to the Dollar.It is one of the oldest charts around. Bitcoin (BTCUSD) vs U.S. Dollar Index (DXY). And perhaps one of the most accurate or to phrase it better, one of the most informative.
As you can see, every time the DXY (black trend-line) bottoms and rebounds (green Arcs), BTC tops and corrects (red Arcs), initiating its Bear Cycle.
Right now the news are far from favorable for Bitcoin's Bull Cycle case as the Dollar has broken above the previous Lower High and continues to rebound. That's a potential bottom, hence high probabilities for BTC to start a new Bear Cycle.
Would you trust this chart? Feel free to let us know in the comments section below!
-------------------------------------------------------------------------------
** Please LIKE 👍, FOLLOW ✅, SHARE 🙌 and COMMENT ✍ if you enjoy this idea! Also share your ideas and charts in the comments section below! This is best way to keep it relevant, support us, keep the content here free and allow the idea to reach as many people as possible. **
-------------------------------------------------------------------------------
💸💸💸💸💸💸
👇 👇 👇 👇 👇 👇

TESLA NOV 6 TRILLION DOLLAR PAY CHECKToday is the day for a lot of people with hope. Be careful & trade smartly.
I have explained the price action here.
YES I AM LONG
NOTE:IV IS HIGH SO STAY AWAY FROM OPTIONS

$106K NEXT, THEN $91K - $93KWe need to touch $106K first, then dump immediately below $100K.
People think it will pump again, but it doesn't. The 4-year cycle is real.

BTC is pulling back to test support levelsToday, BTC has shown an overall volatile trend. A death cross signal has appeared on the daily chart, with short-term moving averages forming a bearish alignment, indicating a short-term bearish trend.
Overall, BTC has clearly entered a correction phase in the short term, and the price may continue to test lower support levels. We will pay short-term attention to the support at 102,000, with key focus on the critical support at 100,000.
For resistance above, the short-term level is at 105,000, and the key level to watch is 108,000. If it can stand firmly above 108,000, a rebound into an upward trend may occur.
Buy 102,000 - 102,500
SL 101,000
TP 103,500 - 104,000
Sell 104,500 - 104,000
SL 105,000
TP 103,000 - 102,500

Bitcoin FUDINDEX:BTCUSD has pulled back to the 50% Retracement of the April 2025 low to the October 2025 high at 100,300. This could be a Support to hold up the recent down move.
Bitcoiners have requested the best FUD to affirm that this could be "the local bottom". Bottoms are made in fear so it seems they are trying to manifest as much as possible on social media to confirm this will be as low as it will go for now.
The obvious narrative FUD would be something about how the bull phase of the Halvening price cycle ended precisesly when it was predicted to (at 36 months from the November 2022 bottom) and the bear cycle has begun. However, here I think are some even more scary FUDs for post-Halloween:
The Compound Annual Growth Rate (CAGR) of Bitcoin for the last decade has been in decline. Bitcoin has been going higher and likely will continue to make higher highs and higher lows into the future BUT at a decreasing rate. Bitcoin's price is following a negative exponential curve. Bitcoin will probably make a higher high at some point in the future, this cycle or the next, but the returns to investors will be far less than have been seen in the past and continue to be even less over time.
A more neutral look at future possibilities is to model historic volatility and project the most probable outcome. The 1 Standard Deviation range from today's price for the next 365 days is between 159,600 and 64,800. That means that there is a 68% probability that Bitcoin will trade within this range over the next year. The FUD is that the lower band matches the Volume Profile node from 2024's consolidation creating support in that zone.
Trade wisely.

Bitcoin Bulls Target $113K**Bitcoin (BTC/USD) Analysis — November 2025**
Bitcoin has been moving within a controlled downtrend channel, facing continuous lower highs since late October. The market recently went through a **liquidity sweep**, followed by a minor **market structure shift (MSS)** on the 3-hour timeframe. This suggests exhaustion in the current bearish leg.
After a period of **sideways consolidation**, price is testing a strong accumulation zone near the **$100K–$97K** region. This zone aligns with prior demand and high-volume nodes, making it a potential base for a bullish reversal.
A clean rebound from this level could drive Bitcoin toward the **$113K–$115K** area, where the next liquidity cluster sits. If buyers regain momentum, this move could accelerate into a **V-shaped recovery**, confirming the start of a fresh mid-term bullish cycle.
Overall sentiment remains **bullish**, supported by renewed buyer activity and potential macro-driven inflows ahead. Traders should watch for volatility spikes as the market transitions from accumulation to breakout mode.
**Key Takeaway:**
BTC is stabilizing near key demand, eyeing a rebound toward $113K+. Momentum confirmation above the short-term consolidation zone could trigger a strong upward continuation.
**#Bitcoin #BTCUSD #CryptoAnalysis #BitcoinForecast #BTCPricePrediction #CryptoTrading #BullishReversal #CryptoMarket #TradingViewAnalysis**

Bitcoin Sitting on Crucial 50 EMA Support!Finally, CRYPTOCAP:BTC has reached a key confluence zone, sitting right on the 50 EMA support, a level that has acted as dynamic support since 2023.
Technically, I’m expecting a potential bounce from here. However, if the current candle fails to reclaim this support, we could see a deeper correction, especially with ongoing geopolitical uncertainty weighing on the market. 📉
DYOR, NFA
Thanks for reading! Appreciate your support and engagement

Bitcoin Trendline Breakdown SetupBitcoin (BTC/USD) is trading around $104,010, showing a mild bullish correction. However, the chart suggests a potential downward move if price breaks below the trendline support. The next targets are around $103,000 and $102,000–$102,100, with a major support zone near $100,400.
ICPUSDT - BUY OPPORTUNITYI predicted Solana to achieve its ATH when it was trending bearish and markets where in complete negative sentiment towards Solana, none the less, my Solana outlook and price forecast was based on the blockchain, its usability, and TPS etc. It hit through all the TP areas and is now fully trading at its fair value, and still growing...
Now I am back with my updated outlook on Internet Computer Protocol (ICP). This blockchain is by far the most advance and powerful blockchain I have come across and know. Literally nothing comes close to it. I have done my own thorough research and can honestly say, this blockchain is literally a steal at current market value. In fact I am in complete disbelief and amazed how this blockchain is not in the TOP 5, when compared to other blockchains out there, who don't offer any real value, and or utility but rather just a mere copy tokens, of ETH etc most cant even host a single bite size image on their blockchain. Yes even Solana can not compete with the tech of ICP. ICP is a super-powerful blockchain, that can host anything including Ai fully on-chain. YES Fully On-Chain.
The introduction of Caffeine Ai > sovereign self-writing apps, self writing internet etc You can find more about this on ICP or follow Dom on X @ DOMINIC_W
Caffeine Ai could bring a lot of Devs over, possibility of anyone becoming a Dev through Caffeine Ai, buildings Apps that will generate income, burn cycles on ICP, catalyst for ICP growth and value etc
The scale at which ICP can exponentially grow from there, with mass adoption can far exceed market cap of Solana and many other blockchains. In my opinion, its far more superior than ETH. It is the only true Ai Blockchain which can host Apps fully on-chain etc immune to tampering, hacks etc A full scale IT stack that can engineer Apps, rewrite the internet all within ICP Blockchain.
It will recover, and gain its true value, at least 3 digits, potentially 4. (I am not financial advisor, Pls DYOR).
The ICP launch was heavily manipulated , it posed a threat to other blockchains, big techs etc however the TEAM at ICP continues to deliver (biggest R&D in crypto space), work and progress ICP. Its only a matter of time, ICP will be MASSIVE n people will wake up to its true reality and what it offers!
Todays price will be Historical!!! Yes I have added more ICP with this Dip. DCA is a powerful strategy ;) Thanks for the Dip - I call it the Winter Sale.
Lets see where ICP leads from here now!
I am holding strong, Diamond!
Oh, if you have come this far, Don't forget BOB on ICP - An interesting one to watch out for!!! just saying ;)
Pls DYOR - I am not Financial Advisor. Crypto is highly volatile!
Trade Safe Habibis
